Amazon Sidewalk Performance#
Amazon Sidewalk is a new ecosystem for creating shared wireless networks connecting IoT devices at homes, and beyond the front door, across the entire neighborhood, and even the city. Amazon Sidewalk provides the following benefits:
Offers free collaborative network coverage based on existing products already in end-users' homes
Offers reliable connectivity where it otherwise is not present today
Complements existing IoT protocols
Removes the need for a proprietary gateway
Provides range extension, frustration-free setup, automatic connection, and AWS connectivity
The goal of this section is to provide an analysis of Amazon Sidewalk's performance to give an idea of possible use cases depending on configuration. It discusses the Amazon Sidewalk ecosystem, its configurations, protocols, testing methods, and results on power consumption, network latency, and range testing. This section aims to provide insights on how to extract the best performance from Amazon Sidewalk.
How to Extract Amazon Sidewalk Best Performances#
Testing Scenarios#
In this section, Silicon Labs considered example use cases for each PHY: BLE (Bluetooth Low Energy), FSK (Frequency-Shift Keying), and CSS (Chirp Spread Spectrum). In each scenario, the setup was to send regular uplinks with payload of 19 bytes to the cloud and wait for an ACK message (0 bytes payload) from the cloud. Default parameters for each radio layer are provided. Tests were run on those default configurations to extract Amazon Sidewalk performance out of the box. For CSS, an alternate configuration was studied to try both power profiles as it changes a lot on the behavior.
Silicon Labs provides the analysis for each link in their default configurations, and also describes the level of configurability for each link. Silicon Labs recommends that developers review the Summary section and explore how to tune the performance of your design based on your application.
BLE Scenario#
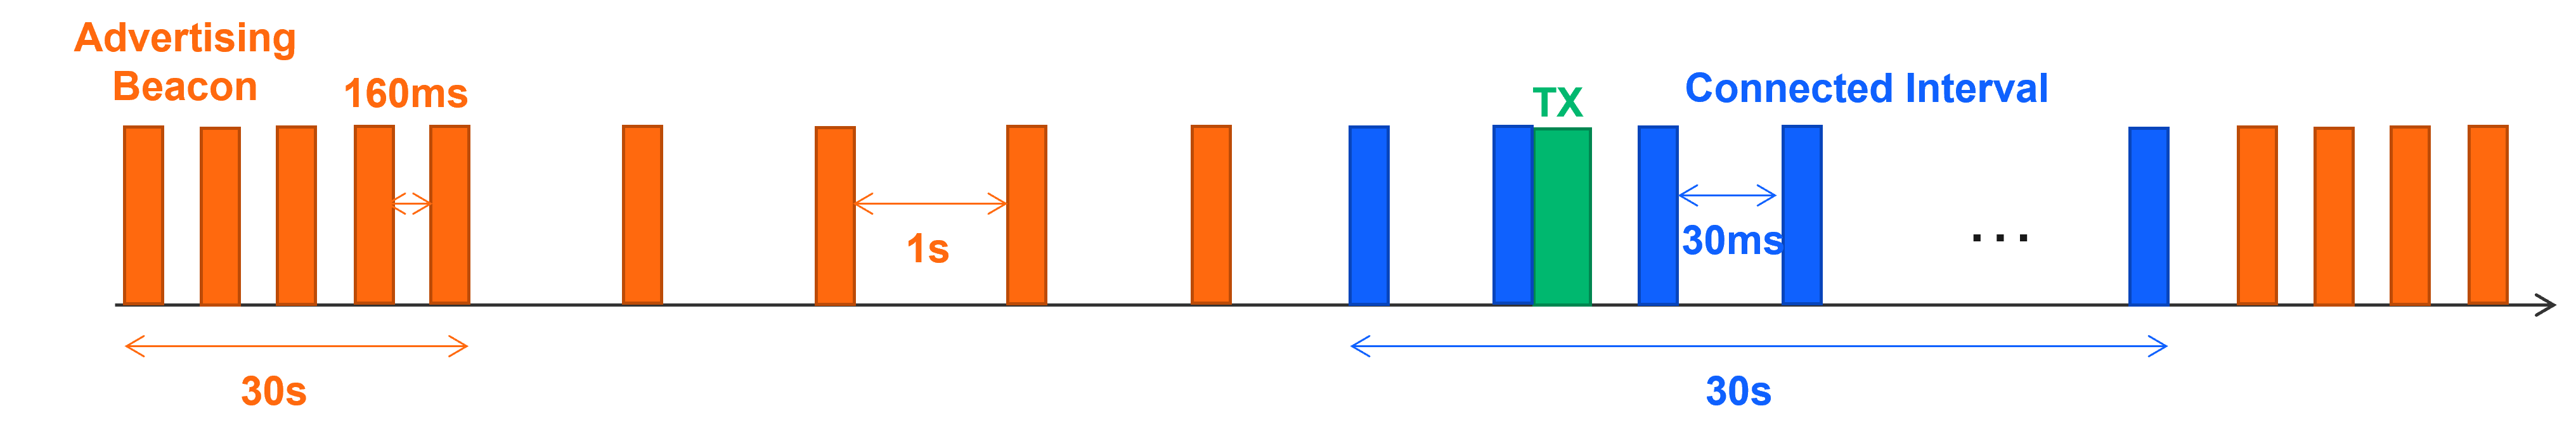
In accordance with Amazon’s specifications, the behavior of BLE is characterized by the use of Bluetooth 5 with a 1 Mbps PHY. The BLE endpoint was established, with the gateway (Amazon Echo 4 for example) assuming the role of BLE Central. Initially, there was a Fast Advertising phase lasting 30 seconds, during which an advertising beacon was emitted every 160ms. This was followed by Slow Advertising, where the beacon was broadcast every 1 second. With no transmission, the connection remained active for 30 seconds. The transmission power was set at 20 dBm, and these settings constituted the default configuration.
FSK Scenario#
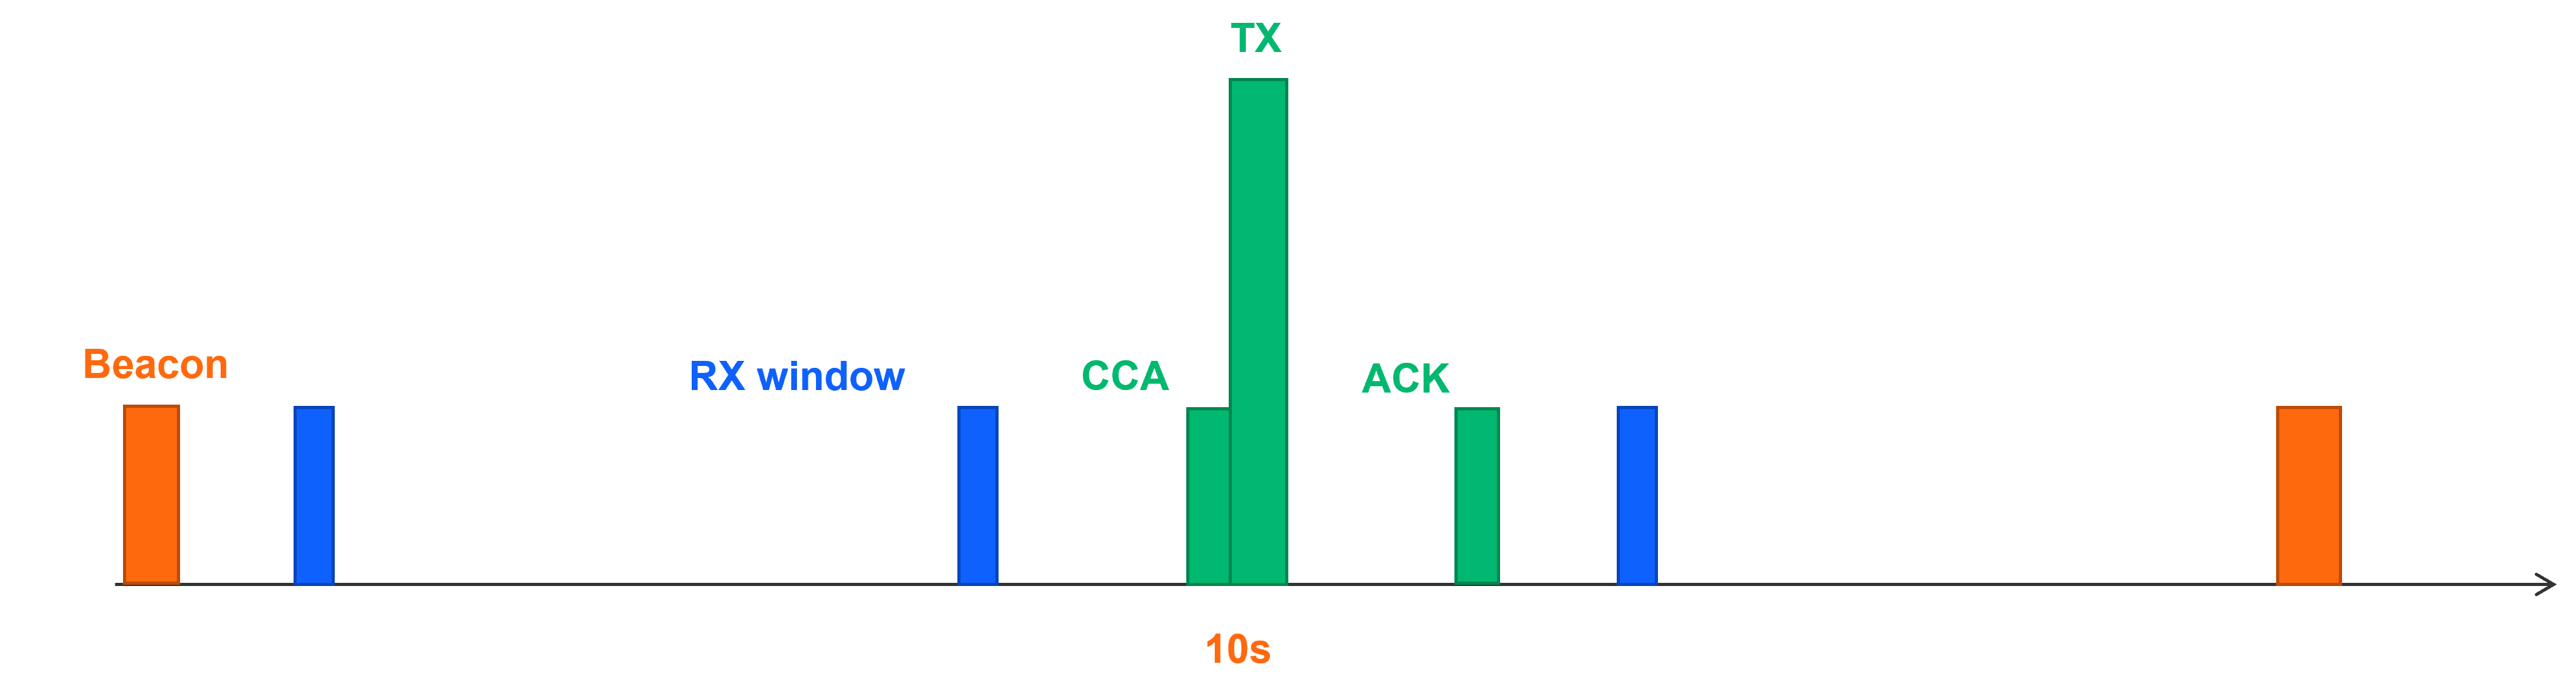
According to Amazon’s specifications, the FSK behavior includes a 50 Kbps FSK communication speed and a synchronous protocol that keeps the device always connected to the gateway. The connection was maintained through beacons sent every 10 seconds, with default settings allowing for three listening windows and transmission opportunities between beacons. The transmission power was set at 20 dBm.
FSK allows for two power profiles 1 and 2. The difference between Power profile 1 and Power profile 2 is in the choice of configuration and its implications for device performance. Power profile 1, which is chosen by the gateway, was configured for high power usage, high-throughput, and low-latency. On the other hand, Power profile 2, which is selected by the endpoint, allows the developer to customize the parameters based on the specific needs of their use case. In the context of this study, the same parameters were applied to both power profiles, resulting in no variation in average power consumption and latency outcomes. The default power profile is power profile 1.
CSS Scenarios#
CSS is an asynchronous protocol. It synchronizes time with the gateway when necessary and conducts transmissions as required. The transmission power is set at 20 dBm by default.
CSS Power Profile A
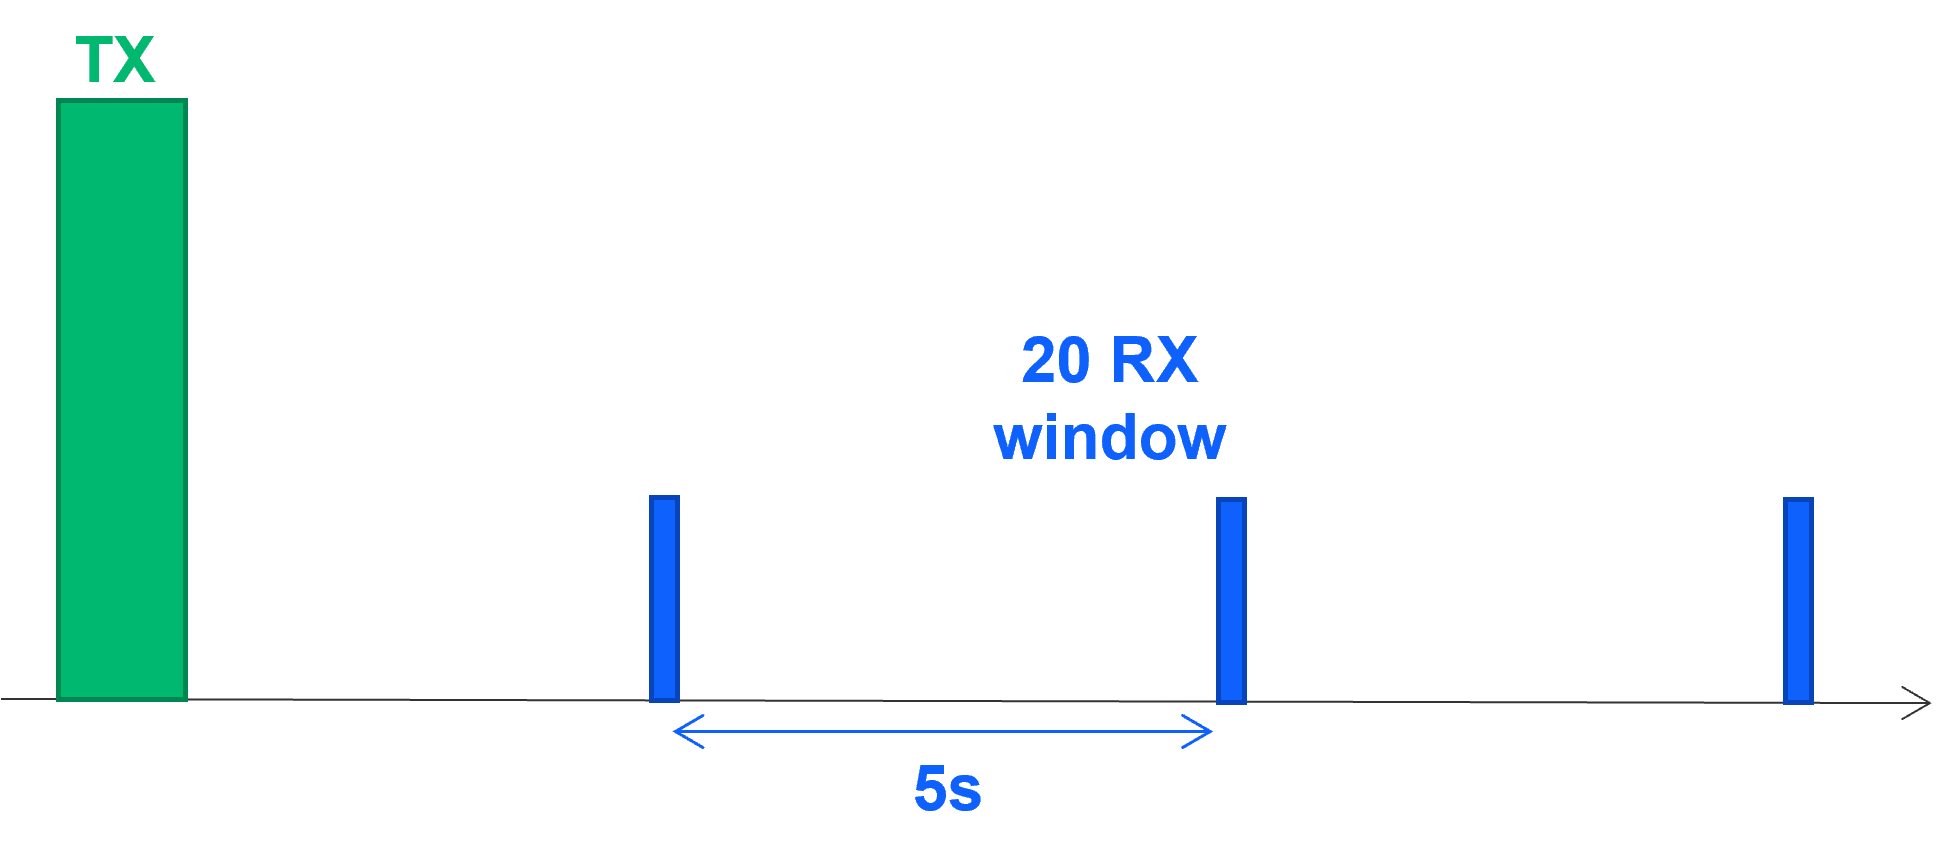
For the CSS power profile A, listening windows were activated only after a transmission, with up to 20 windows available, one occurring every 5 seconds. A time synchronization was required before any transmission if the last one was more than 5 minutes prior. For the purposes of this study, the default number of RX windows after a transmission was used, which is 20.
CSS Power Profile B
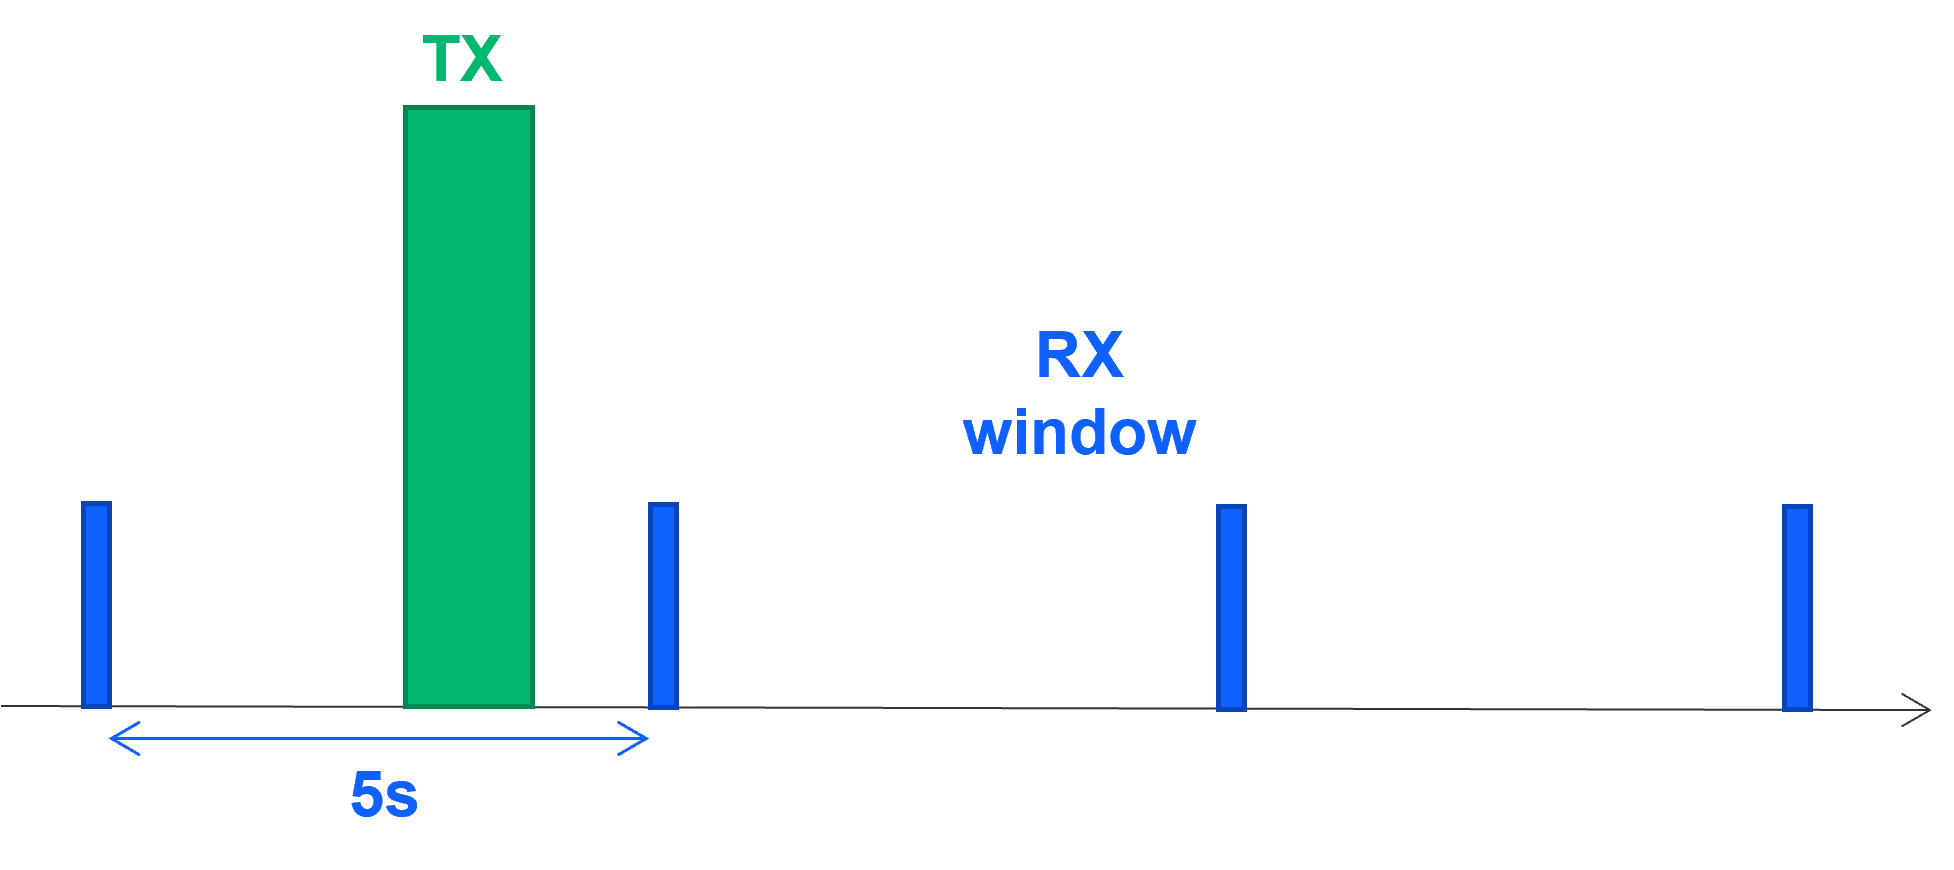
In CSS power profile B, listening windows were scheduled periodically, occurring every 5 seconds indefinitely. Additionally, a keep-alive signal was sent every 5 minutes.
Hardware#
To perform the necessary tests, various platforms were selected for each physical layer (PHY).
Reference platforms include:
For BLE: the EFR32xG24 radio board on the mainboard
For FSK: the EFR32xG28 radio board on the mainboard
For CSS: a combination of the EFR32xG24 radio board and the Semtech SX1262 radio module
For CSS range tests: the Amazon Sidewalk Test Kit
Power Consumption#
Testing Method#
Power consumption was tested using the Simplicity Studio Energy Profiler. The test involved sending 19-byte packets to the cloud and receive an ACK from the cloud. The average power consumption was simulated on TX periodicity. The simulation was based on fundamental events such as TX, RX, and protocol-specific events. Based on those events, a loop was defined.
For more information about the average power consumption of fundamental events, see Power Consumption Analysis.
Results#
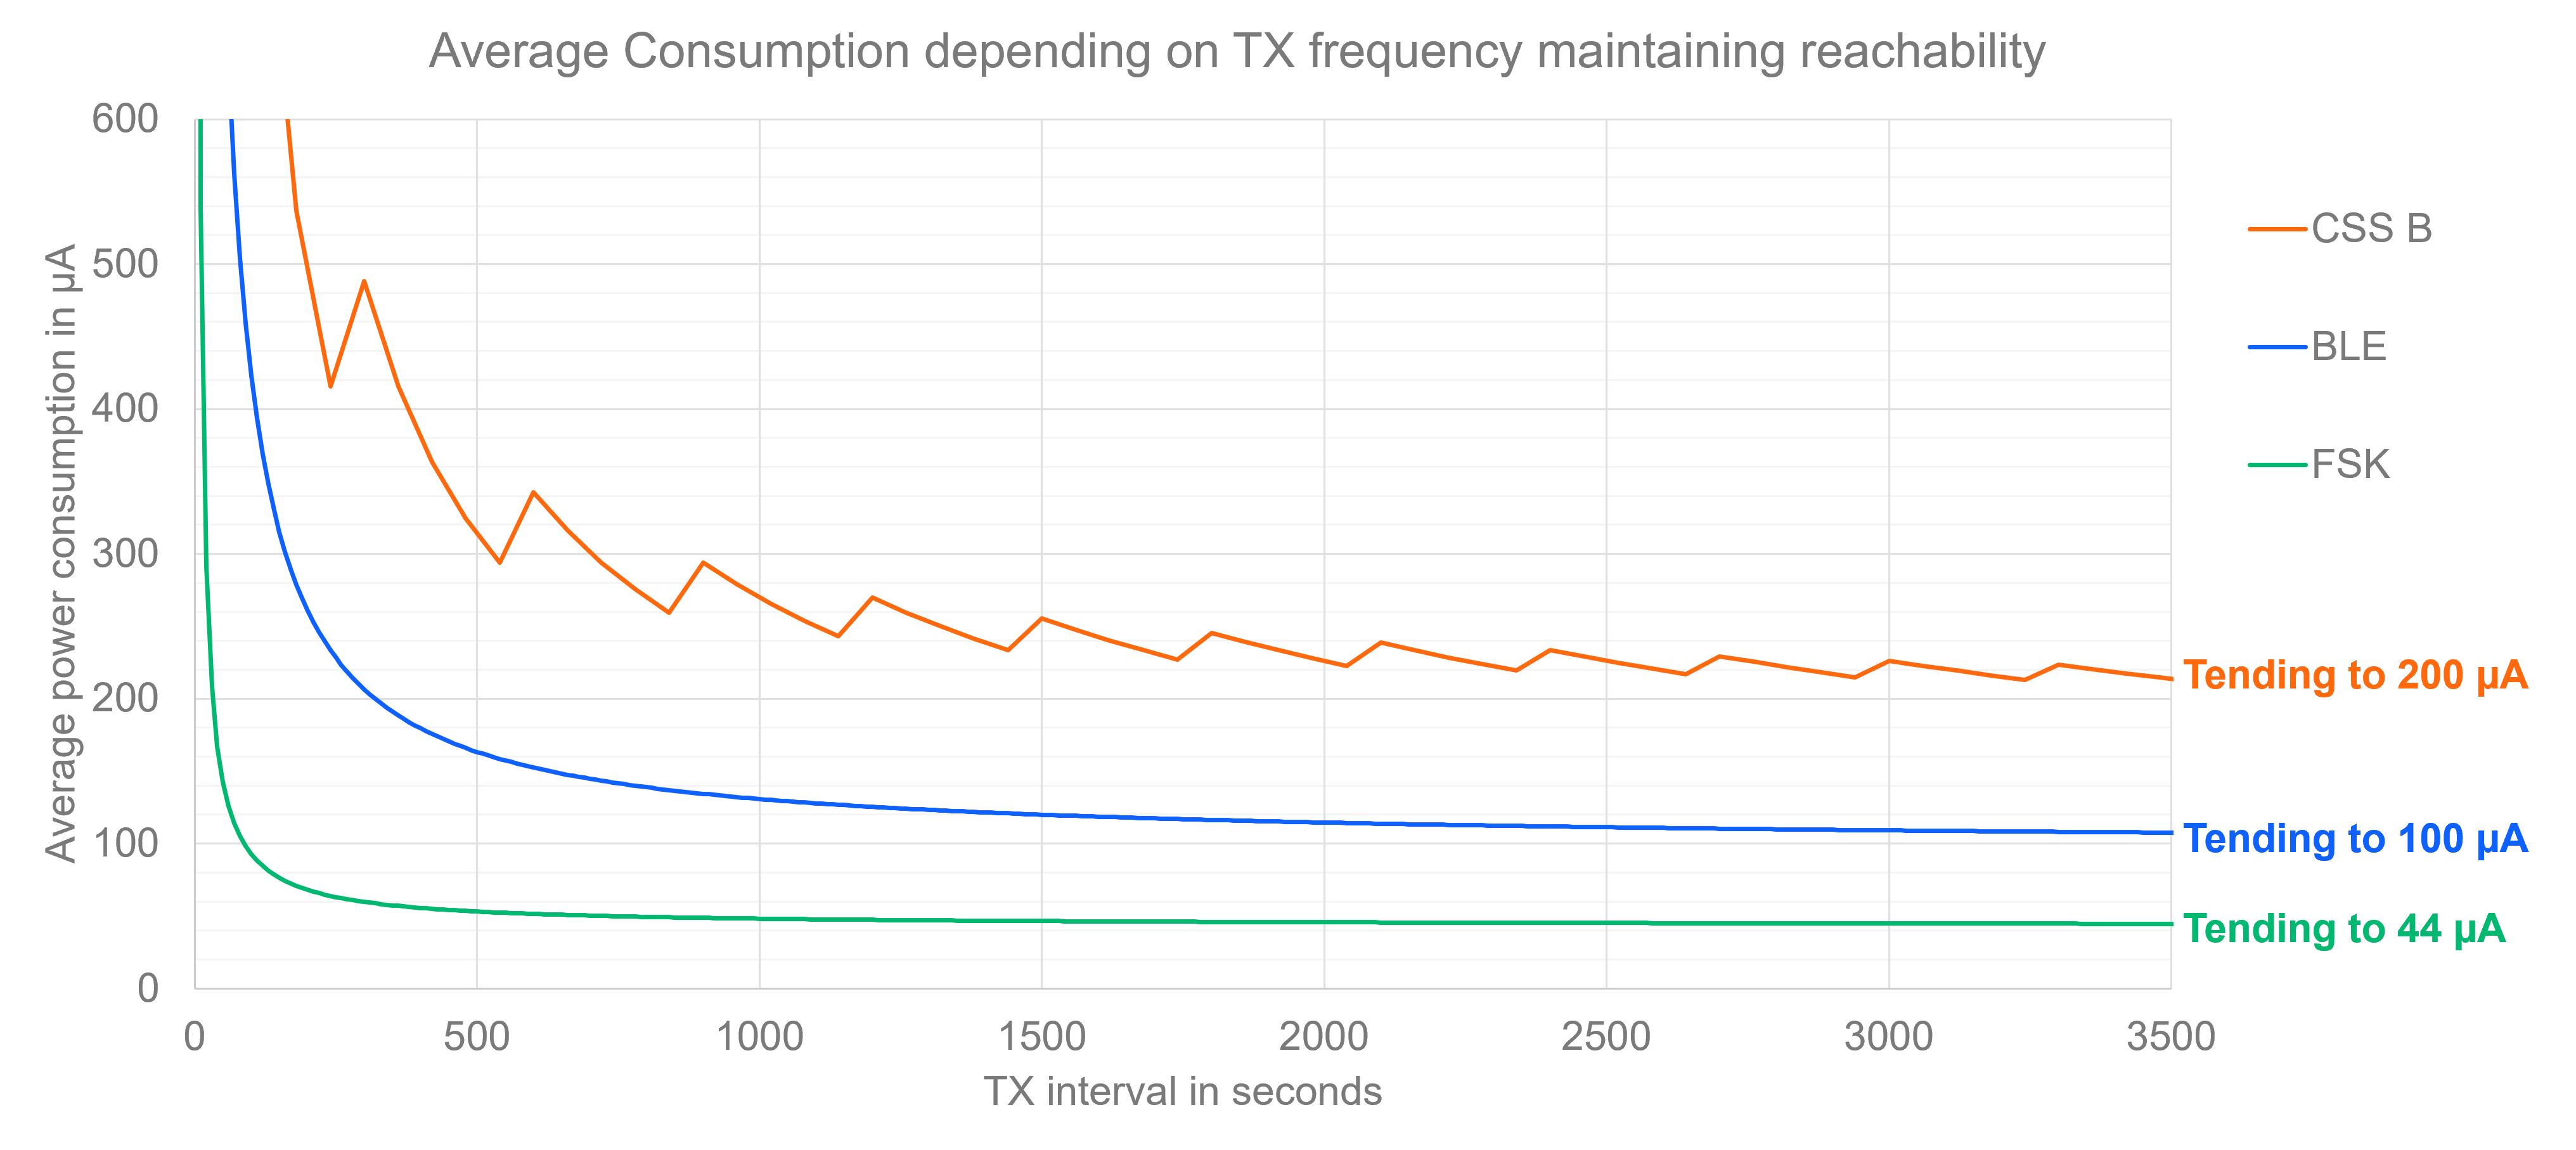
The graph below illustrates three distinct curves representing the average power consumption of BLE, FSK, and CSS as a function of transmission periodicity. The green curve represents FSK power consumption, which is notably efficient, stabilizing at around 44µA. The blue curve depicts BLE power consumption, which levels off at approximately 100µA. This is attributed to the BLE stack’s continuous advertising within the Sidewalk context. To significantly reduce power consumption, the stack would need to be halted between transmissions. The orange curve corresponds to CSS power profile B, showing an average power consumption that approaches 200µA. This curve features slight inclines every 5 minutes, reflecting the keep-alive mechanism of CSS power profile B that transmits every 5 minutes. The power consumption for CSS could be reduced by opting for power profile A, which does not implement this keep-alive feature. In the three scenarios with each PHY, the reachability of the endpoint by the cloud at any given time was maintained.
This graphical representation provides a clear comparison of the power efficiency of different protocols and configurations, highlighting the trade-offs between power consumption and communication frequency.
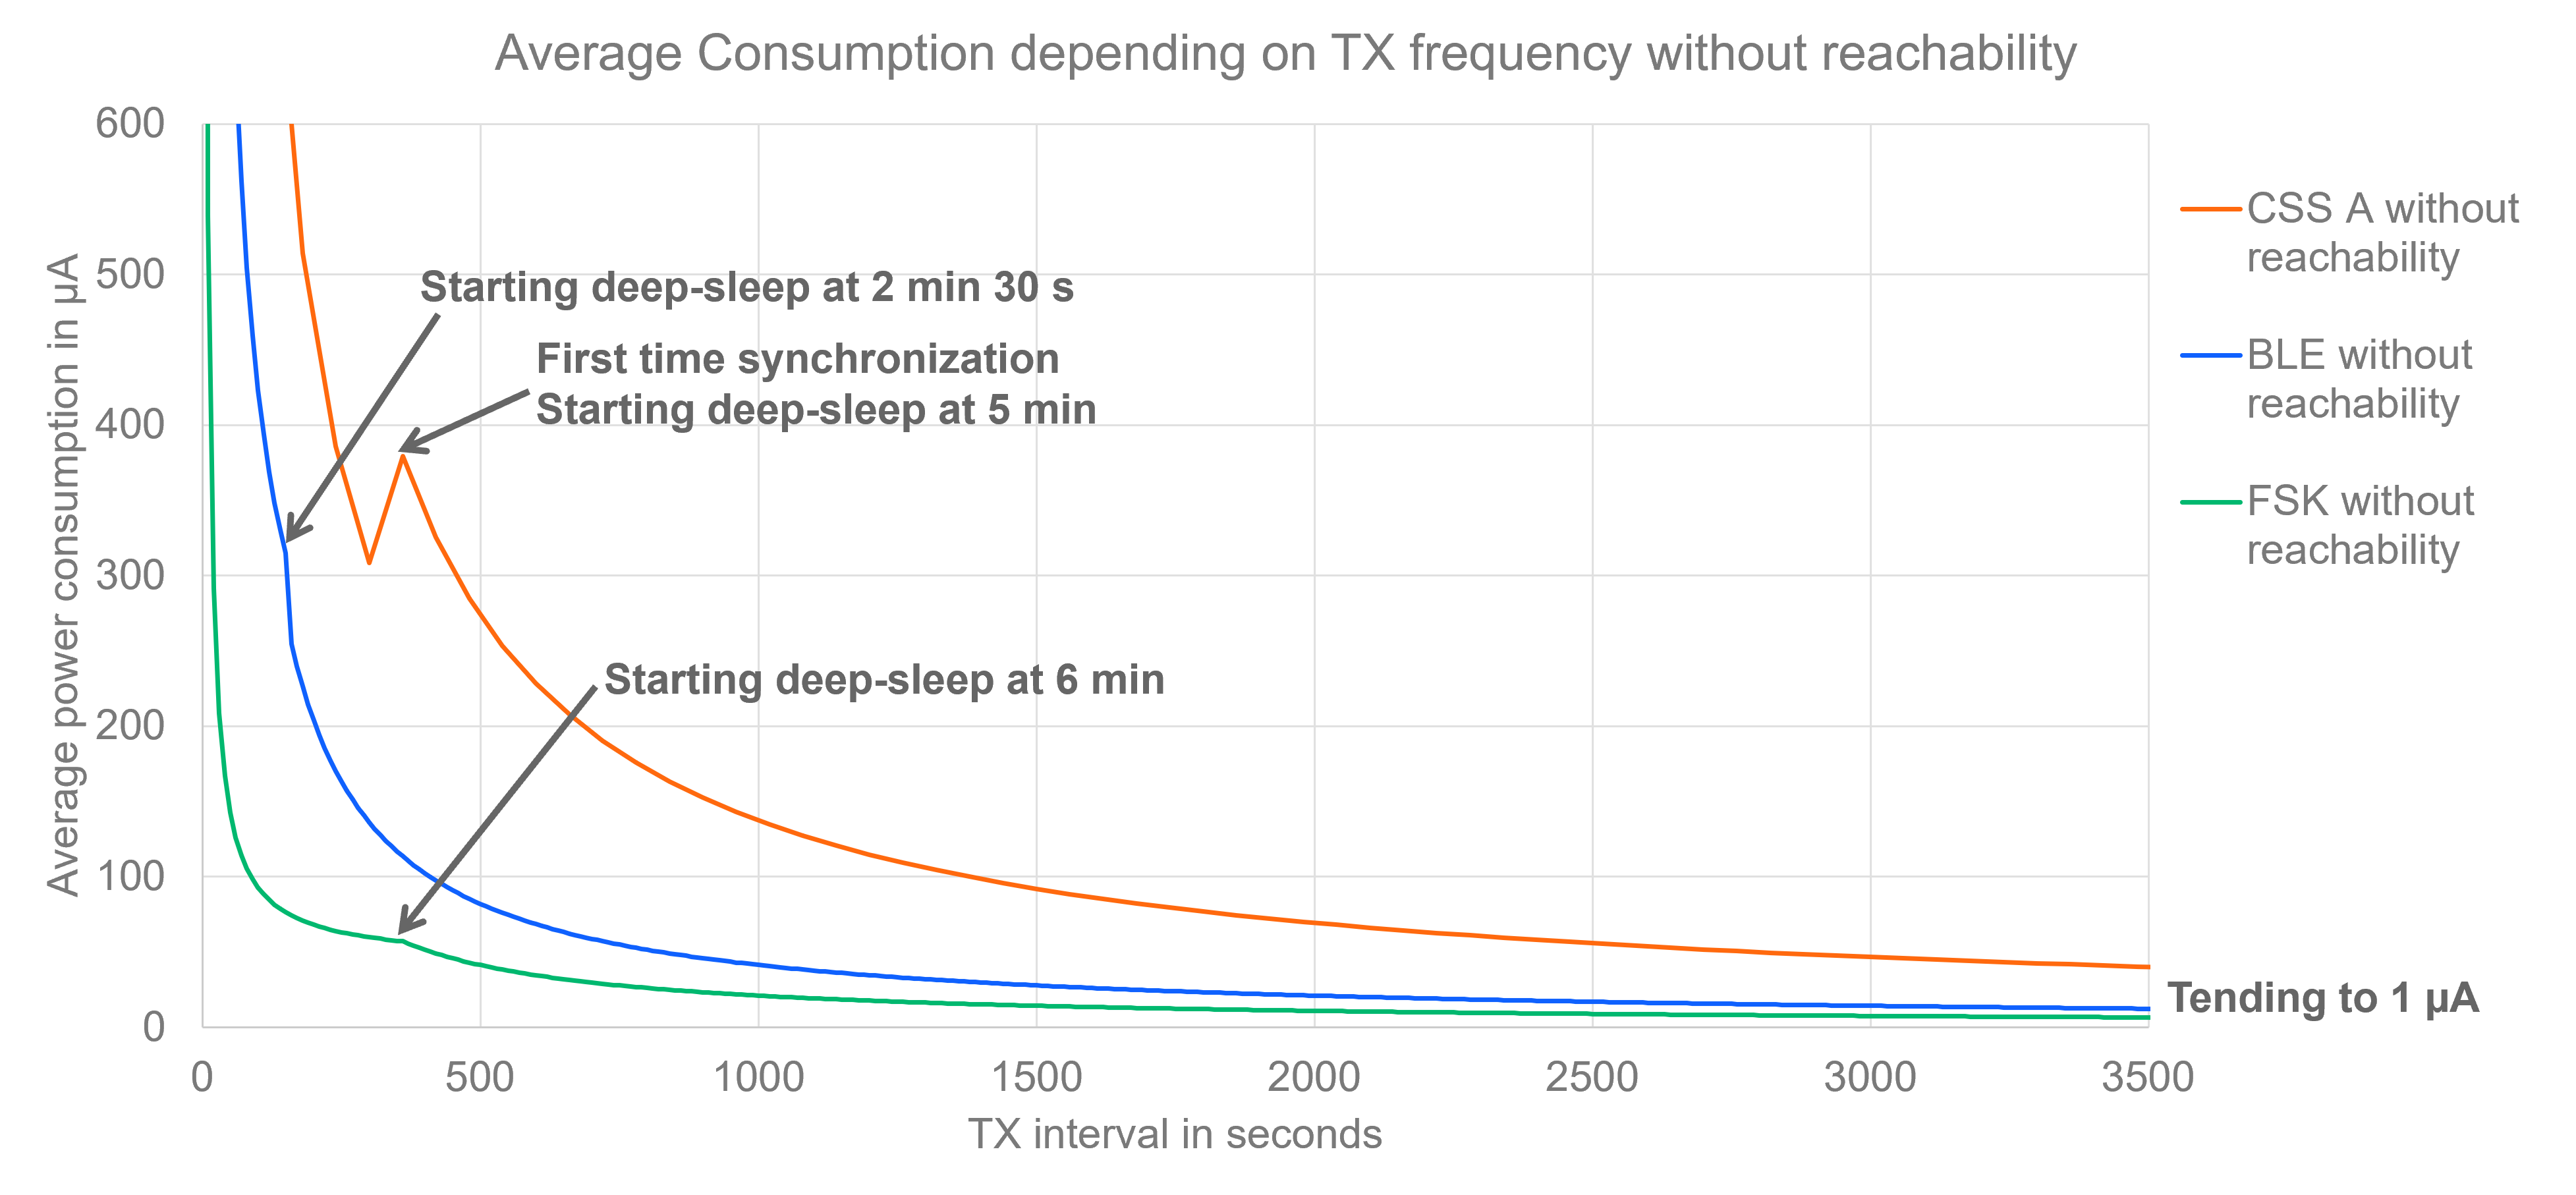
The graph below presents three curves that plot average power consumption against transmission periodicity, with all PHYs tending towards the ultra-low power consumption of EM4, which is 1µA. This scenario assumes that RX reachability is not maintained and the Sidewalk stack enters sleep mode between messages. The analysis identifies the optimal intervals for each protocol to enter sleep mode to maximize power efficiency.
The green curve for FSK power consumption quickly approaches the EM4 current, with the optimal sleep interval identified at 6 minutes. The blue curve for BLE power consumption also rapidly trends towards EM4, with the best time to sleep being at 2 minutes and 30 seconds. The orange curve represents CSS power profile A, where the ideal point to sleep is at 5 minutes. Notably, the power consumption for CSS power profiles A and B (on the previous graph) remains identical up to the 5-minute mark. Beyond this point, power profile A requires a time synchronization before each transmission due to the absence of the keep-alive mechanism found in power profile B. However, the additional power consumed by this time synchronization is negligible compared to the savings achieved by stopping the stack and entering EM4 sleep mode.
This graph effectively illustrates the power-saving benefits of managing the sleep intervals of communication stacks, particularly in scenarios where maintaining RX reachability is not a priority.
Network Latency#
Testing Method#
Latency was tested using a custom test application. The test involved sending 19-byte packets to the cloud and receiving an ACK from the cloud. Average latency was computed on each scenario by sending 500 messages. The message traveled from the endpoint to the GW and to the cloud and back.
Results#
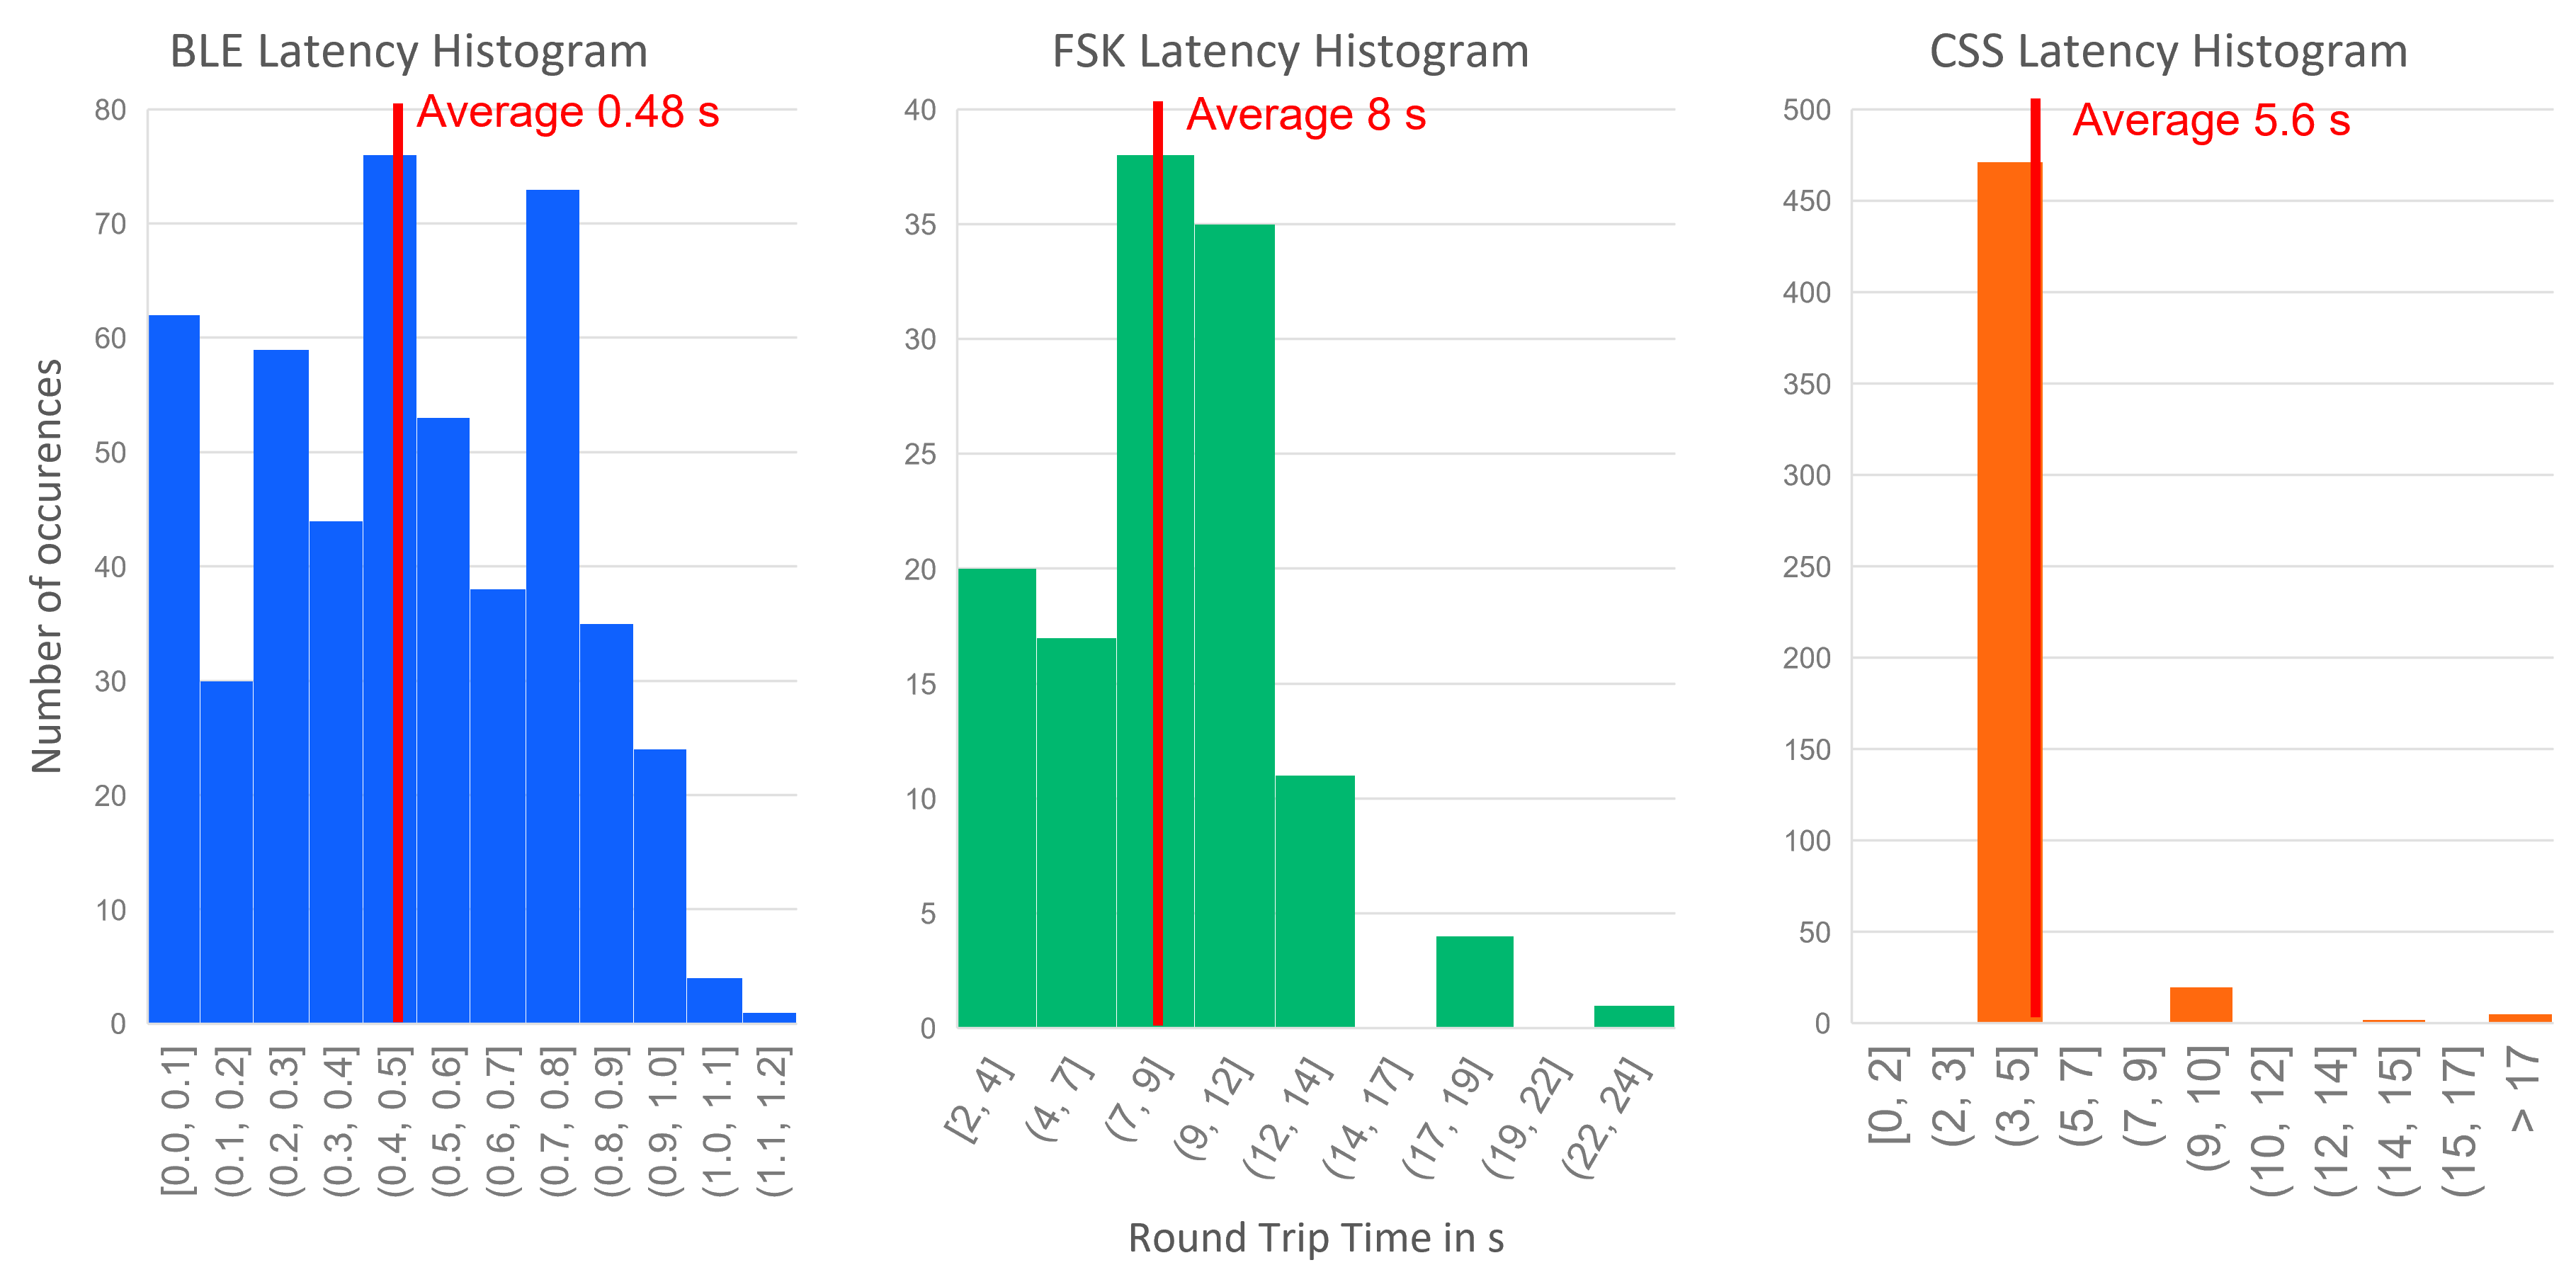
The histograms visually represent the latency testing results for three different physical layers of the Amazon Sidewalk protocol: BLE, FSK, and CSS. Each histogram has latency on the horizontal axis and the number of messages for each latency value on the vertical axis.
BLE Latency Histogram: Shows an average latency of around 500 ms, indicating a relatively quick response time for the BLE protocol.
FSK Latency Histogram: Displays an average latency of approximately 8 seconds. This longer latency is attributed to the protocol’s listening windows, which occur every 3 seconds. Consequently, the reception of messages is possible only at these intervals, leading to an average latency that aligns with multiples of the listening window periodicity.
CSS Latency Histogram: Reveals an average latency of 5 seconds. Similar to FSK, this is due to the protocol’s RX windows being spaced every 5 seconds, which dictates the frequency of reception opportunities.
The latency results for FSK and CSS highlight the significant impact of the protocols’ reception opportunities on performance. Given that Amazon Sidewalk is an uplink-based protocol, while transmissions to the cloud may be swift, the response is limited by the scheduled listening opportunities inherent to the protocol’s design.
Range Testing#
Testing Methods#
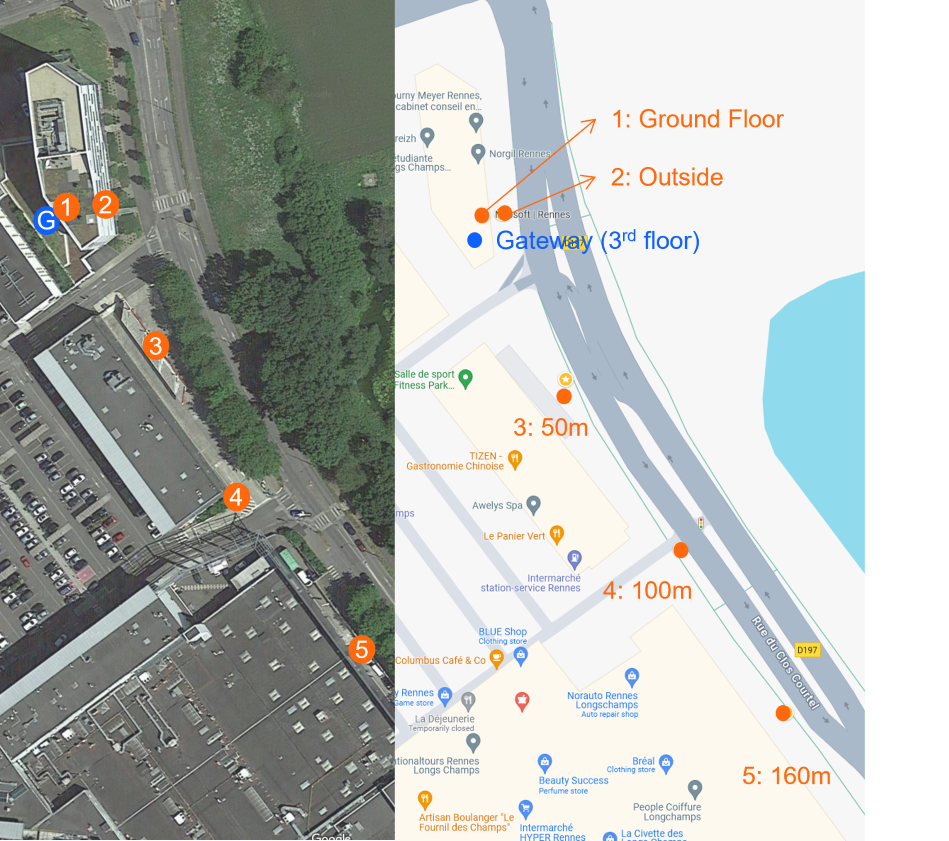
Range was tested for both FSK and CSS. For FSK, the test environment was an urban area with the gateway on the third floor. Points were chosen every 50 meters and at each point, messages were sent and the RSSI was retrieved from the answer. The test stopped when messages failed to send. For CSS, the range test was conducted using an Amazon Sidewalk Tracker.
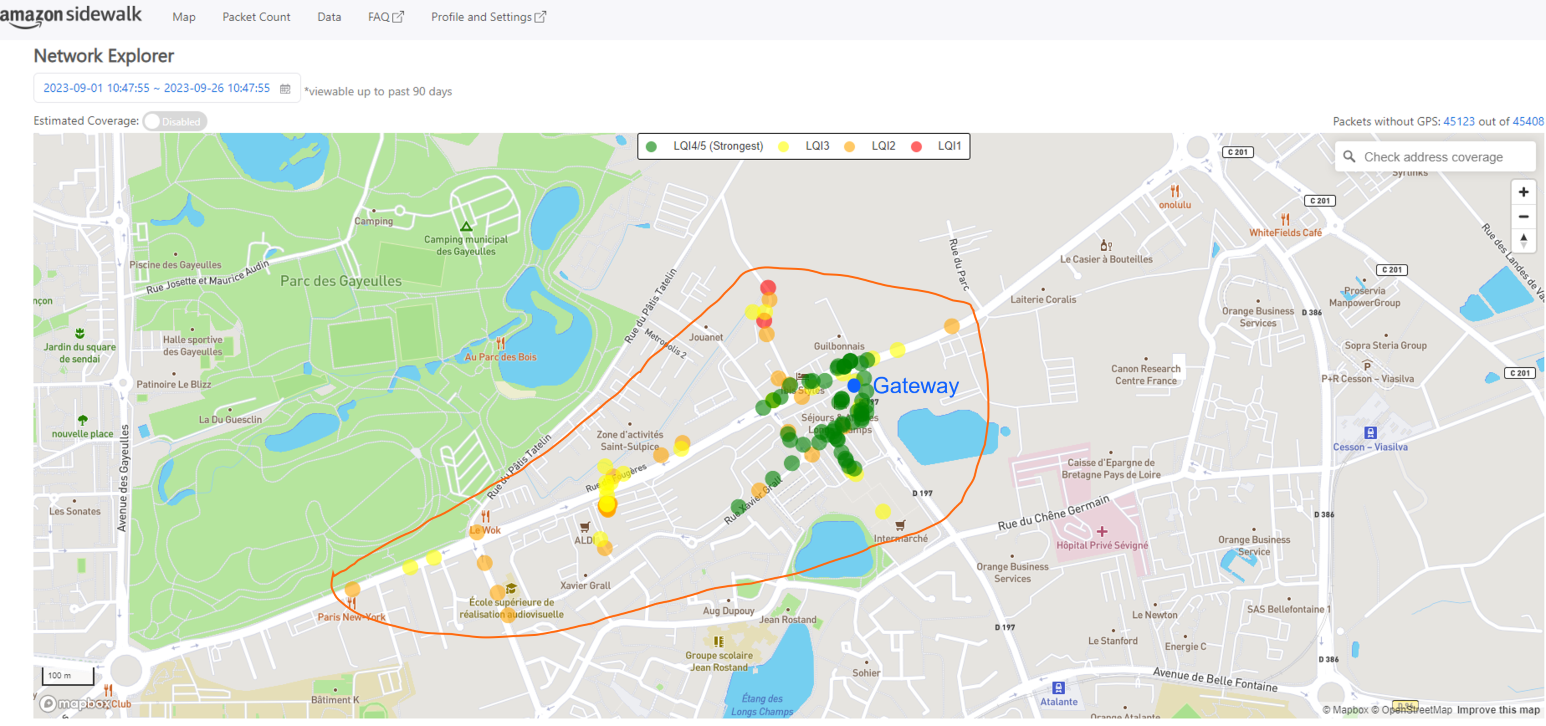
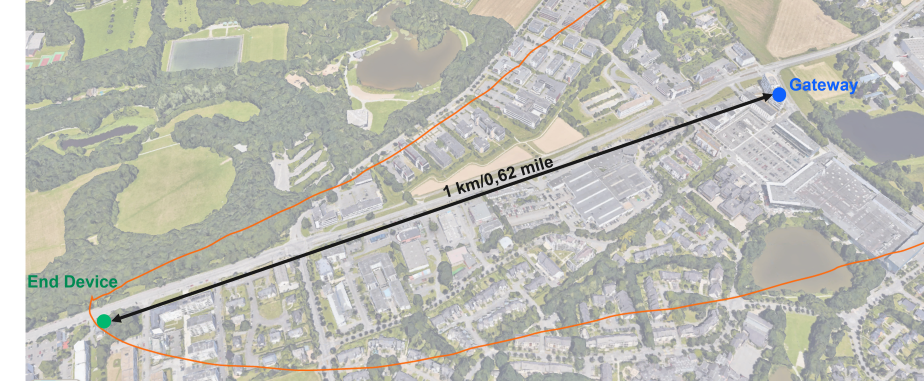
The range for both FSK and CSS was evaluated. In the case of FSK, the testing environment was an urban setting with the gateway positioned on the third floor. Measurement points were established at 50-meter intervals, and at each point, messages were sent and the RSSI was recorded from the response. The testing concluded when message transmission was unsuccessful. For CSS, the range testing was executed using an Amazon Sidewalk Test Kit and the coverage map was retrieved from Amazon tooling. As we are not using one of Silicon Labs dev kits but the Amazon Test Kit instead, the radio configuration can be different from the Silicon Labs reference platform used throughout this guide. However, radiating power should be pretty close so metrics are still relevant and representative of the CSS capabilities for Amazon Sidewalk.
The tests were conducted outside of the US to ensure only one gateway was in range of the test device.
![]()
![]()
Results#
For FSK, the result indicated a maximum range of 160 meters or 524 feet.
For CSS, the result indicated a maximum range of 1 km or 0.62 mile.
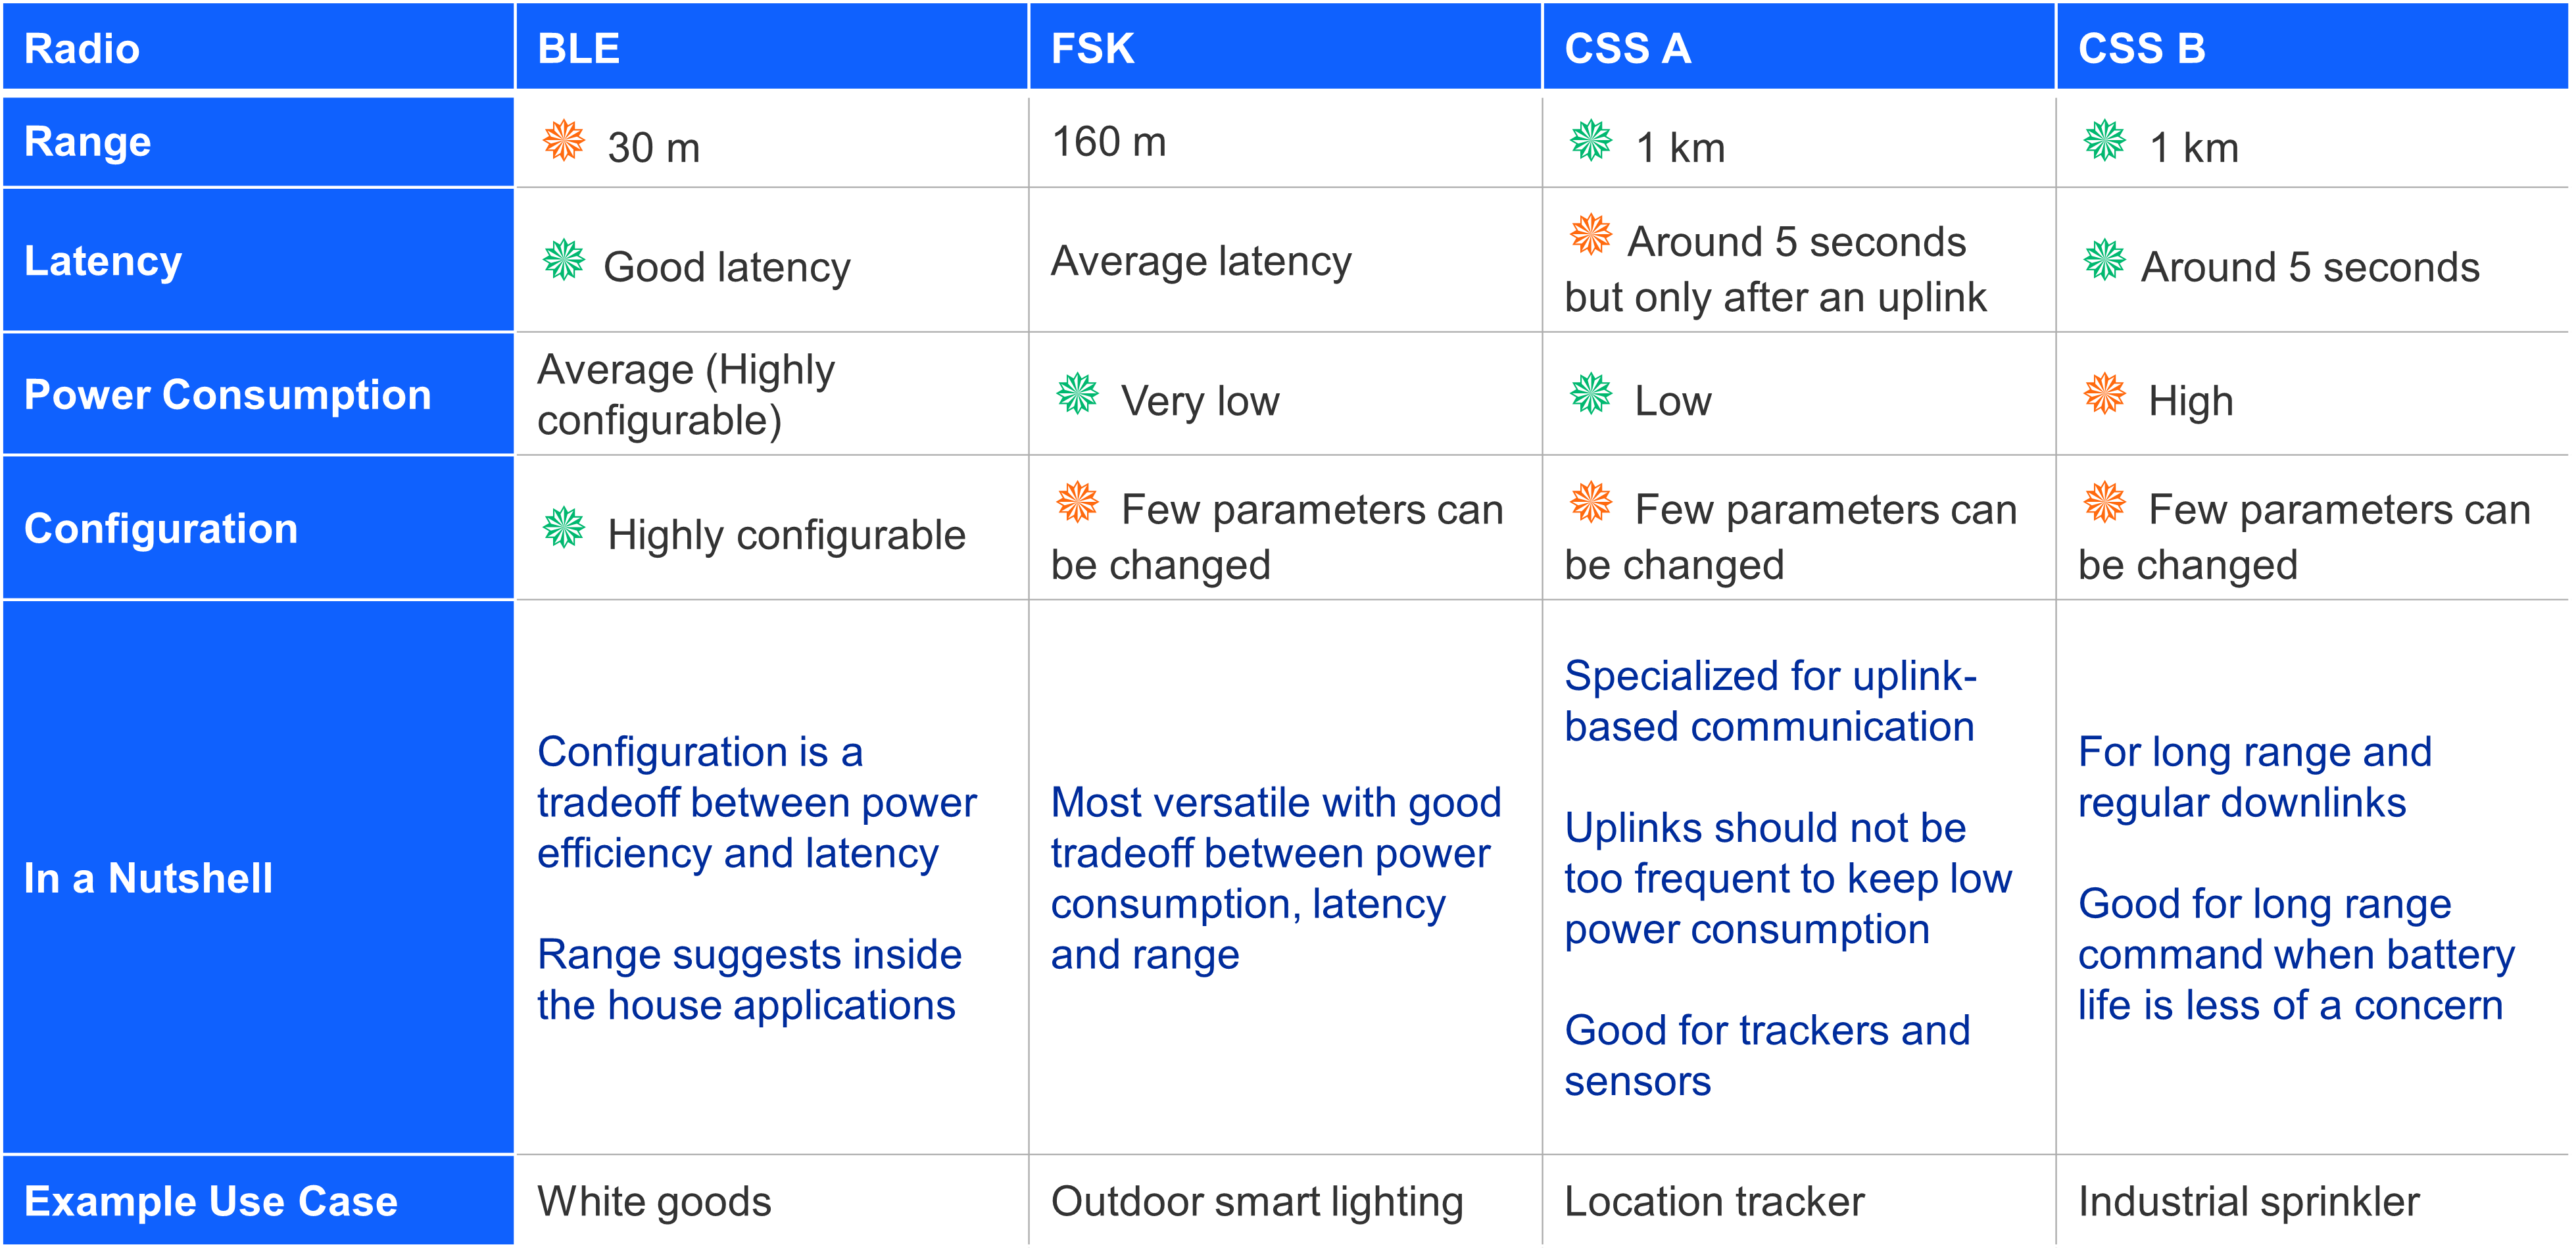
Summary#
The performance study on the Amazon Sidewalk protocol concludes with insightful findings for each physical layer. Each layer presents unique advantages and trade-offs, making them suitable for different applications within the Amazon Sidewalk ecosystem. BLE is characterized by its indoor range and offers highly customizable latency and power consumption settings, making it suitable for household appliances. FSK’s range is optimal just outside the front door and is extremely power-efficient for battery-powered devices. Notably, the trade-off between latency and power consumption for FSK is influenced by the selected value for the number of RX windows parameter, allowing for customization based on the use case, with outdoor smart lighting being a versatile application. CSS supports long-range devices, with Power Profile B being ideal for long-range applications that require regular downlinks and have fewer concerns for power efficiency, such as industrial sprinklers. Conversely, Power Profile A is better suited for uplink-based use cases that demand high power efficiency, like sensors or location trackers. Each layer’s attributes make them uniquely fit for various applications within the Amazon Sidewalk network.
Going Further#
To go further in evaluating Amazon Sidewalk performances, several things can be tried by changing the configuration or experimenting with specific features.
For FSK, a fixed message could be sent periodically with an answer from the cloud, and with a change to the number of RX windows between beacons. This would allow a view of the impact of this parameter on latency and power consumption. The BLE stack is highly configurable and several parameters can be changed like connection interval and peripheral latency. This would be especially interesting for CSS, as TX power consumption is very high. In addition to those existing parameters, Amazon introduced two major features in Sidewalk SDK 1.16 (Sidewalk extension 2.0.0): multi-link and bulk data transfer. The multi-link feature allows switching between available radio layers depending on reception quality. The cost of this radio switch could be evaluated in terms of range, latency, and power consumption. This study does not include throughput testing, but it would be an interesting angle to add. On BLE, it could be measured by leveraging the bulk data transfer feature.
On the gateway side, several configurations and corner-cases could be tried to stress-test the performances of the gateway, especially the impact on the latency depending on the number of devices using and connecting to the gateway.