General Overview#
About the Bluetooth Stack#
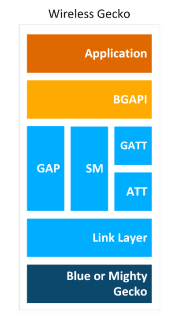
The Silicon Labs Bluetooth stack is an advanced Bluetooth 5-compliant protocol stack implementing the Bluetooth low energy standard. It supports multiple connections, concurrent central, peripheral, broadcaster, and observer roles. The Silicon Labs Bluetooth stack is meant for Silicon Labs Wireless Gecko SoCs and modules.
The Silicon Labs Bluetooth stack provides multiple APIs for the developer to access the Bluetooth functionality. Two modes are supported:
In standalone mode, both the Bluetooth stack and the application run in a Wireless Geckos SoC or module. The application can be developed with C programming language.
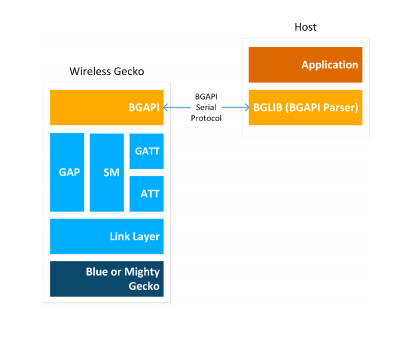
In Network Co-Processor (NCP) mode, the Bluetooth stack runs in a Wireless Gecko and the application runs on a separate host MCU. For this use case, the Bluetooth stack can be configured into NCP mode where the API is exposed over a serial interface, such as UART.
Bluetooth Stack Features#
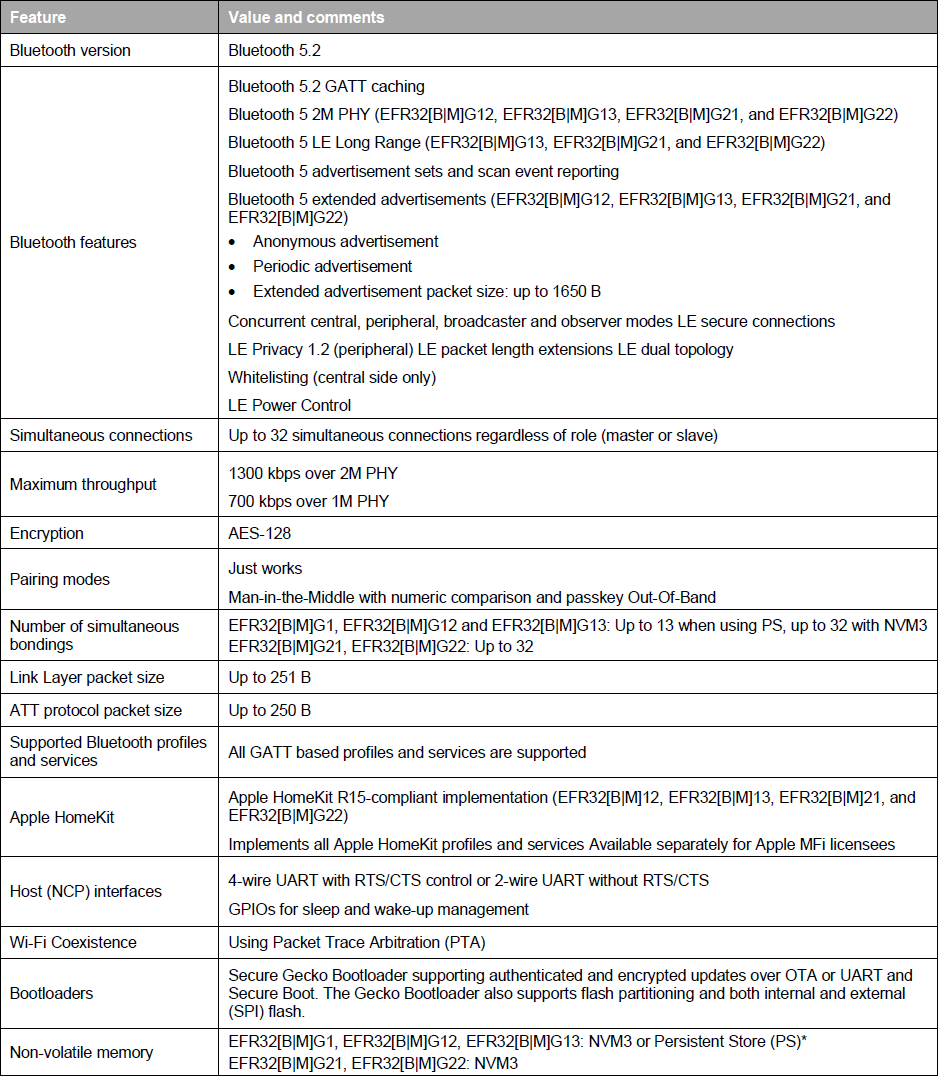
The features of the Silicon Labs Bluetooth stack are listed in the following table.
Bluetooth Qualification#
All products deploying Bluetooth technology must go through the Bluetooth SIG's Qualification Process. Online resources will help you learn more about the Bluetooth Qualification, process, and tutorials on the Launch Studio, which is the online tool used to complete the Bluetooth Qualification Process. For assistance to qualify your device, consider reaching out to your nearest Bluetooth Qualification Consultant.
When qualifying your end-product based on Silicon Labs’ Bluetooth stack, integrate the pre-qualified components. To learn more and see the list of pre-qualified components, see QSG169: Bluetooth® SDK v3.x Quick-Start Guide.
The Bluetooth Stack APIs#
This section briefly describes the different software APIs.
The Bluetooth API#
The Bluetooth API provided by the Silicon Labs Bluetooth stack is the primary API to communicate with the stack. It provides access to all the Bluetooth functionality implemented by the Bluetooth stack, such as the Generic Access Profile (GAP), connection manager, the security manager (SM), GATT client and server.
In addition to the Bluetooth features, the Bluetooth API also provides access to a few other functions such as the Direct Test Mode (DTM) API for RF testing purposes, the Persistent Store (PS) API for reading and writing keys to and from the devices flash memory, the DFU (Device Firmware Update) API for field firmware updates, and the System API for various system level functions.
The BGAPI Serial Protocol and the Bluetooth Host API#
When configured in NCP (network co-processor) mode, the Bluetooth stack can be controlled using the BGAPI serial protocol. This allows the Bluetooth stack to be controlled over a serial interface such as UART from a separate host, such as EFM32 microcontroller. The BGAPI serial protocol provides exactly the same Bluetooth APIs over UART as the BGAPI API when used in a standalone mode.
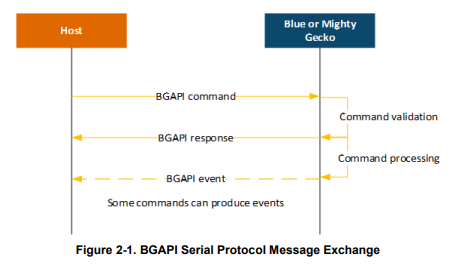
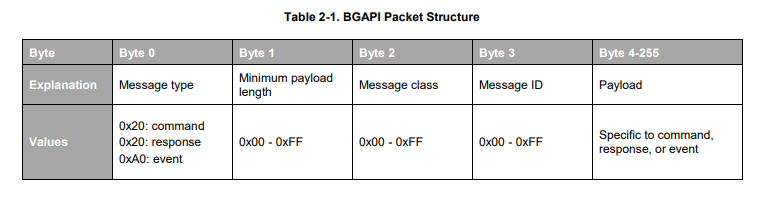
The BGAPI serial protocol is a lightweight, binary protocol that carries the BGAPI commands from the host to the Bluetooth stack, and carries responses and events from the Bluetooth stack back to the host.
The Bluetooth SDK delivers a ready-made BGAPI serial protocol parser implementation both for the NCP target (EFR) and for the NCP host. It implements the serial protocol parser for all APIs provided by the Bluetooth stack. The host code developed on top of host API can be written to be identical to the code for the EFR, which allows easy porting of the application code from the EFR to a separate host or vice versa.
The BGAPI serial protocol packet structure is described below. For more information, see the BGAPI Headers.
The Bluetooth Profile Toolkit GATT Builder#
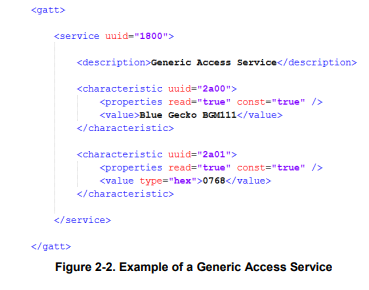
The Bluetooth Profile Toolkit is an XML-based API and description language used to describe the GATT-based service and characteristic easily without writing code. The XML files can be easily written by hand based on the information contained in UG118: Blue Gecko Bluetooth® Profile Toolkit Developer Guide. Use the Profile Toolkit GATT Builder if you are developing outside of Simplicity Studio.
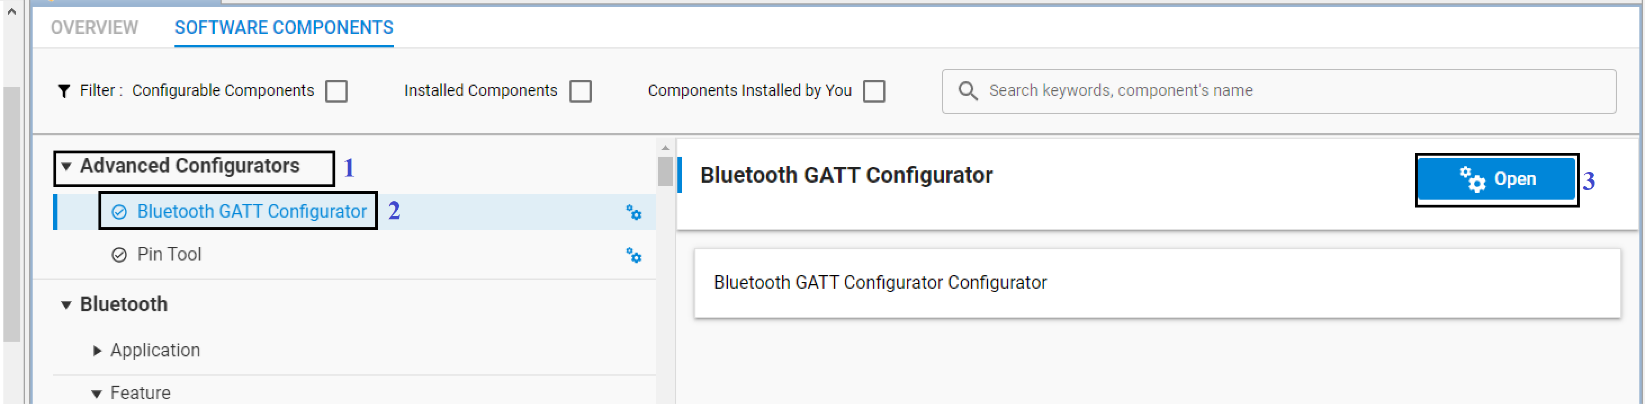
Within Simplicity Studio, the GATT Configurator allows building the GATT in a visual way without hand editing the XML file. See UG438: GATT Configurator User’s Guide for Bluetooth SDK v3.x for details. Open the GATT Configurator in Simplicity Studio through the Project Configurator, Software Components tab, under Advanced Configurators. Click Open and the GATT Configurator tool opens the file gatt_configuration.btconf in a new tab.
gatt_configuration.btconf provides the trunk of the GATT database. It is located inside the config > btconfig directory of your project. You can add additional XML files in the same directory and extend the GATT database. The contents of the additional XML files will appear as Contributed Items in the GATT Configurator UI. For examples, see the ota-dfu.xml file provided with most sample applications.
The GATT database developed with the Profile Toolkit is converted to a .c file and a .h file and included in the application project as a pre-build step when the firmware is compiled. Then, the GATT can be accessed with the Bluetooth stack GATT APIs or by a remote Bluetooth device.
CMSIS and EMLIB#
The Cortex Microcontroller Software Interface Standard (CMSIS) is a common coding standard for all ARM Cortex devices. The CMSIS library provided by Silicon Labs contains header files, defines (for peripherals, registers and bitfields), and startup files for all devices. In addition, CMSIS includes functions that are common to all Cortex devices, such as interrupt handling, intrinsic functions, and so on. Although you can write to registers using hard-coded address and data values, it is recommended to use the defines to ensure portability and readability of the code.
To simplify programming Wireless Geckos, Silicon Labs develops and maintains a complete C function library called EMLIB that provides efficient, clear, and robust access to and control of all peripherals and core functions in the device. This library is within the em_xxx.c (for example, em_dac.c) and em_xxx.h files in the SDK. The EMLIB documentation is available in the Gecko Platform documentation.
About the Bluetooth SDK#
The Bluetooth SDK is a full software development kit that enables you to develop applications on top of the Bluetooth stack using C programming language. The SDK also supports making standalone applications, where the Bluetooth stack and the application both run in the Wireless Gecko, or the network co-processor (NCP) architecture, where the application runs on an external host and the Bluetooth stack runs in the Wireless Gecko. SDK contents and folder structure are described in QSG169: Bluetooth® SDK v3.x Quick-Start Guide.
About Demos and Examples#
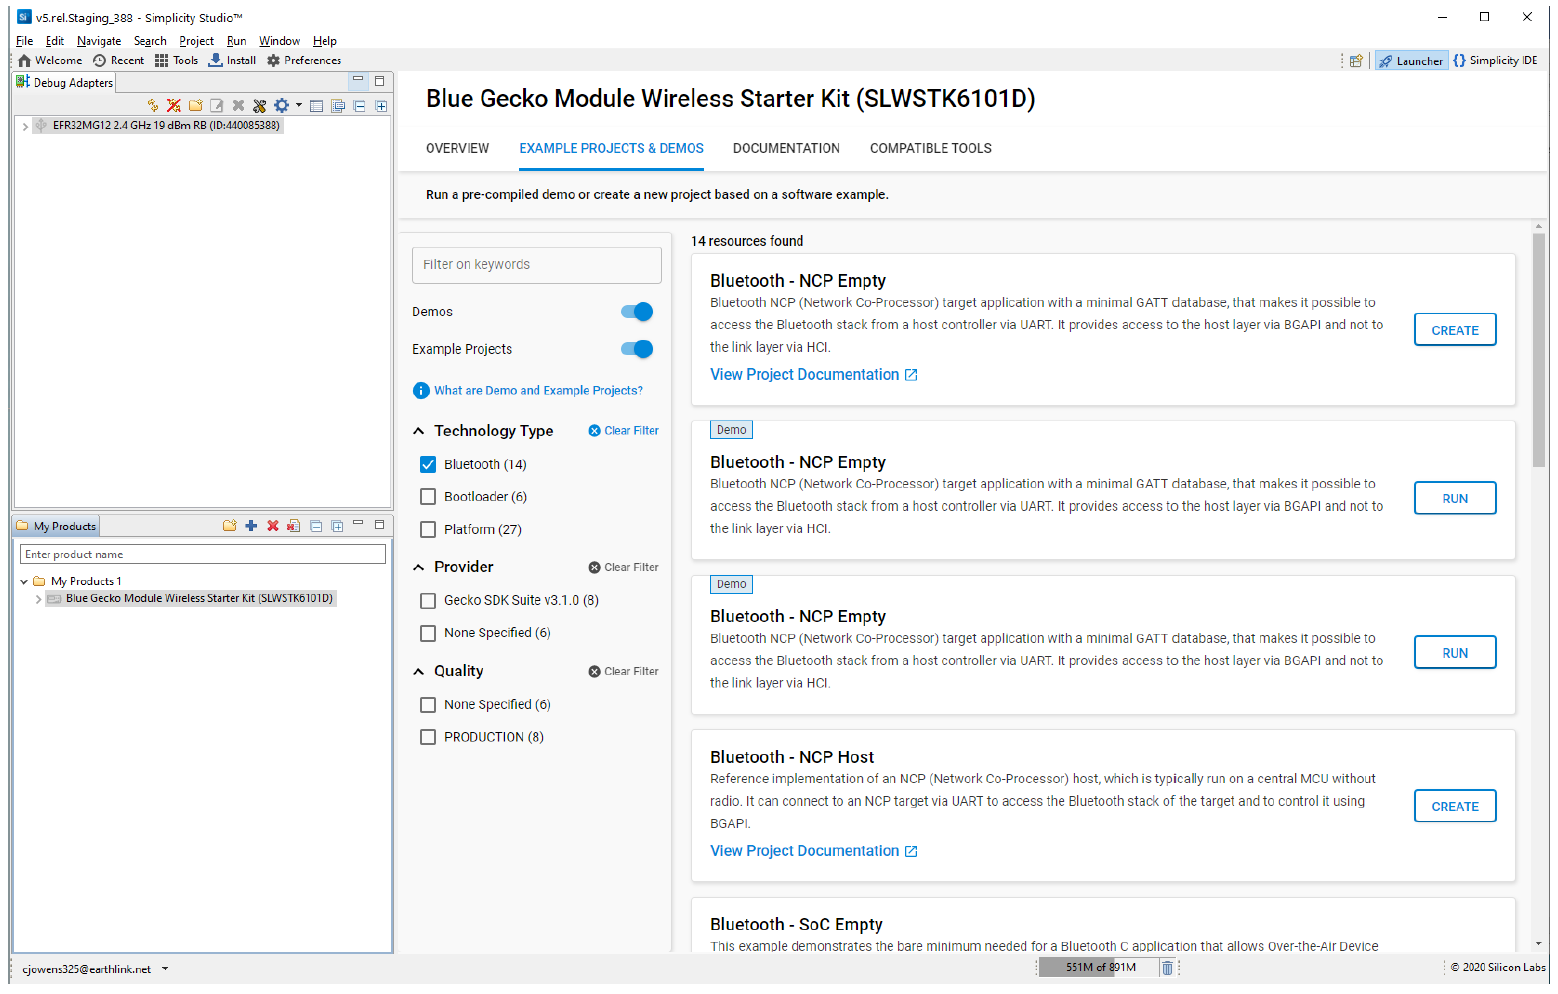
Starting application development from scratch can be difficult. For that reason, the Bluetooth SDK comes with a number of built-in demos and examples covering the most frequent use cases, as shown in the following figure. Demos are pre-built application images that you can run immediately. Software examples can be modified before building the application image. Demos with the same name as software examples are built from their respective example.
Note: The demos and examples you see are determined by the part selected. If you are using a custom solution with more than one part, click on the part you are working with to see only the items applicable to that part.
Demos and Software Example are in the Example Projects & Demos tab in the launcher view of Simplicity Studio.
To download and run a demo on your device, click RUN on the right demo you want to run on your target.
To import software example code into your workspace as a new project using default project configurations, click CREATE on the name of the desired example project and a New Project Wizard window will open. Click FINISH and your project will open in Simplicity IDE mode where you can customize it.
If an example project closely matches your needs, extend the code with your application code and rewrite the custom sections. Otherwise, start with the SoC-Empty application. Note that the SoC-Empty application is not blank, but rather provides a minimal project that only starts advertising.
Demo/Example Descriptions#
The following examples are provided. Examples with ()* in their names have a matching pre-built demo.
Silicon Labs Gecko Bootloader examples (see UG266: Silicon Labs Gecko Bootloader User Guide and AN1086: Using the Gecko Bootloader with Silicon Labs Bluetooth Applications)
Bluetooth Examples
Bluetooth (NCP)
NCP Host: NCP (Network co-processor) Host example that connects to an NCP target via USART. It demonstrates the usage of BGLib with or without USART flow-control. This example does not have a Bluetooth function over the radio because it uses the EFR32 only as a host device. It is only a reference implementation to be ported to a host processor (without a radio).
NCP Empty: Network co-processor target application with a minimal GATT database. Use this as a starting point to create an NCP firmware. An NCP device can be controlled from another (host) device or directly from your PC with the Bluetooth NCP Commander. This example together with the NCP Commander provides an easy way to get started and also debug your application by issuing commands to the stack step-by-step.
NCP AoA Locator: Same as NCP Empty application extended with features to support Direction Finding. To be run on an antenna array board (Direction Finding board). Use this application with Direction Finding host examples.
Bluetooth (SoC - Basic):
SoC Empty: A minimal project structure, used as a starting point for custom applications. The project has the basic functionality enabling peripheral connectivity and contains a minimal GATT database that can be expanded to fit your application requirements.
SoC iBeacon: An iBeacon device implementation that sends non-connectible advertisements in iBeacon format. The iBeacon Service gives Bluetooth accessories a simple and convenient way to send iBeacons to iOS devices. This example demonstrates the power consumption at 0 dBm TX power.
SoC DTM: Used to run Bluetooth DTM (direct test mode) tests for radio testing. See AN1046: Bluetooth® Radio Frequency Physical Layer Evaluation for more information.
SoC Thermometer: Implements the Thermometer (GATT Server) Role of the Health Thermometer Profile, which enables a Collector device to connect and interact with a Thermometer.
SoC Thermometer Client: Implements a Client that discovers and connects up to 4 BLE devices advertising themselves as Thermometer Servers. It displays the discovery process and the temperature values received via UART. Note: Some radio boards will exhibit random pixels in in the display when this example is running because they have a shared pin for sensor- and display-enabled signals.
SoC Thermometer Micrium RTOS: Shows the same functionality as the SoC Thermometer example but running Micrium RTOS in the background. It demonstrates how to implement an RTOS-based application.
SoC Thermometer FreeRTOS: Shows the same functionality as the SoC Thermometer example but running FreeRTOS in the background. It demonstrates how to implement an RTOS-based application.
SoC AoA Asset Tag: An asset tag application for Direction Finding. It transmits direction finding signals to locators, so that the device running this example can be located. To learn more, see QSG175: Silicon Labs Direction Finding Solution Quick- Start Guide.
SoC Voice: This example demonstrates the bare minimum needed for a C application to transmit Voice over Bluetooth Low Energy (VoBLE).
Thunderboard
SoC Thunderboard React, Thunderboard Sense, Thunderboard Sense 2(), and Thunderboard EFR32BG22(): Examples used to show the applicable Thunderboard features.
Dynamic Multiprotocol Examples (see [AN1134: Dynamic Multiprotocol Development with Bluetooth and Proprietary Protocols on RAIL](https://www.silabs.com/documents/public/application-notes/an1134-bluetooth-rail-dynamic-multiprotocol.pdf) for more information)
SoC Empty RAIL DMP: A minimal project structure, used as a starting point for custom Dynamic Multiprotocol applications. The project has the basic functionality enabling peripheral connectivity, without GATT services. It runs on top of Micrium OS RTOS and multiprotocol RAIL.
SoC Light RAIL DMP: Implements the Light (GATT Server) Role, which enables a Switch device to connect to and interact with it. The device acts as a connection Peripheral. This is a Dynamic Multiprotocol reference application, running on top of Micrium OS RTOS and multiprotocol RAIL. To learn how to test this demo see QSG155: Using the Silicon Labs Dynamic Multiprotocol Demonstration Applications.
SOC - Range Test - RAIL - DMP(*): Range Test with Bluetooth connectivity. It runs on top of Micrium OS RTOS and multiprotocol RAIL.
NCP Host Examples (located in C:\SiliconLabs\SimplicityStudio\v5\developer\sdks\gecko_sdk_suite<version>\app\bluetooth\examples_host)
Empty: Minimal host-side project structure, used as a starting point for NCP host applications.
ota-dfu: Demonstrates how to perform an OTA DFU on a Silicon Labs Bluetooth Device. It requires a WSTK with a radio board flashed with NCP firmware to be used as the GATT client that performs the OTA.
uart-dfu: Demonstrates how to perform a UART DFU on a Silicon Labs Bluetooth Device running NCP firmware.
voice: Using a WSTK programmed with NCP firmware, it to connects to the SoC Voice example, sets the correct configuration on it, receives audio via Bluetooth, and stores audio data into a file.
aoa_locator: A locator host sample app that works together with an NCP AoA Locator target app. It receives IQ samples from the target and estimates the Angle of Arrival (AoA). For more information see AN1296: Application Development with Silicon Labs’ RTL Library.
aoa_multilocator: Connects to multiple aoa_locator sample apps (via MQTT) and estimates a position from Angles of Arrival (AoA). For more information, see AN1296: Application Development with Silicon Labs’ RTL Library.
aoa_multilocator_gui: Connects to the aoa_multilocator sample app (via MQTT), reads out the position estimations and displays the tags and locators on a 3D GUI. This sample app is python based. For more information, see AN1296: Application Development with Silicon Labs’ RTL Library.
aoa_compass: Demo application with GUI showcasing the angle estimation capabilities of the RTL library, as described in QSG175: Silicon Labs Direction Finding Solution Quick-Start Guide.