Starting an Energy Analysis Session#
Start an energy analysis session by launching Energy Profiler from either Simplicity Studio 6 or from the Tools section in the Visual Studio Code extension.
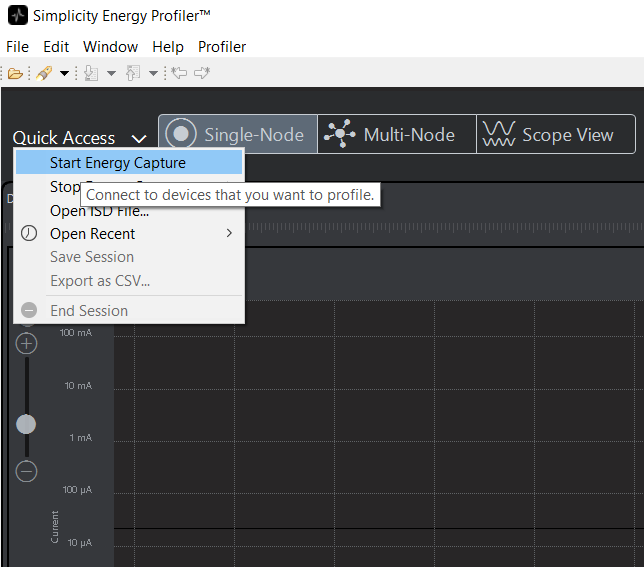
If application firmware is already running on a device, you can connect to it from the Energy Profiler tool. Flash the application firmware to the device and then in the Energy Profiler click Quick Access to display its menu and select Start Energy Capture.
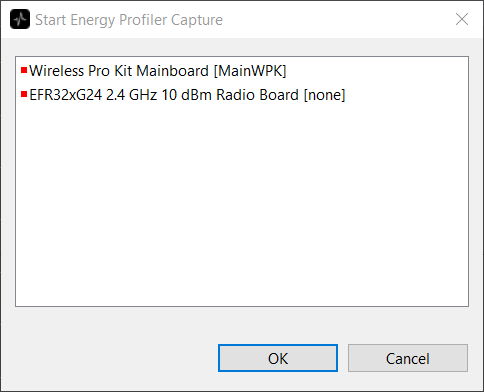
Studio 6 prompts you to select the devices to profile. Select one or more devices and click OK.
Energy Profiler then:
Starts energy capture for that device.
Depending upon which view is currently active, displays the device’s energy data on Single-Node view, Multi-Node view, or Scope view.
Customer Hardware and Software Design Information#
This section discusses design requirements in order for a device to be able to use Energy Profiler features. Among these features is Code Correlation, which connects power consumption and executed code. Using code correlation is discussed in more detail in Profiling with Code Correlation.
Hardware Design#
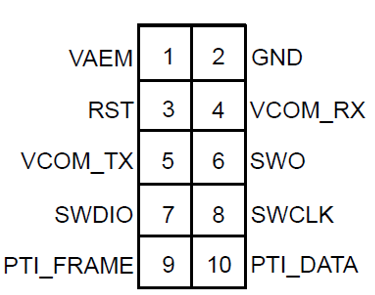
To use the Energy Profiler functionality on a board design, the board needs to include a debug interface that can be connected to a Silicon Labs STK or WSTK. For the basic Energy Profiler current measurements, the board must be powered from the VAEM supply of a Silicon Labs STK or WSTK. To also include code correlation, the debug interface must include the SWO interface. Both the current measurement and the code correlation (SWO) can be obtained by using the Silicon Labs Mini Simplicity 10 pin connector. This connector is detailed in AN958: Debugging and Programming Interfaces for Custom Designs. The Mini Simplicity 10 pin connector can be used with all EFM32 and EFR32 parts. The pinout is shown in the following figure.
The WPK (BRD4002A) include a built-in Mini Simplicity connector, so it can be used as is for current measurement and code correlation. As mentioned in AN958: Debugging and Programming Interfaces for Custom Designs, using the Silicon Labs debug adapter board (BRD8010A) is the easiest way to get the Mini Simplicity pinout from a Silicon Labs STK or WSTK development kit.
Software Design#
To use the current monitoring functionality provided by the AEM interface, no software changes or setup are required. To use the code correlation functionality, the SWO pin interface must be configured to output periodic program counter information.
Use the Project Configurator to configure the project to support code correlation by completing the following four steps:
In the Project Configurator, SOFTWARE COMPONENTS tab, find and install the SWO Debug component.
Click Configure to open the Component editor.
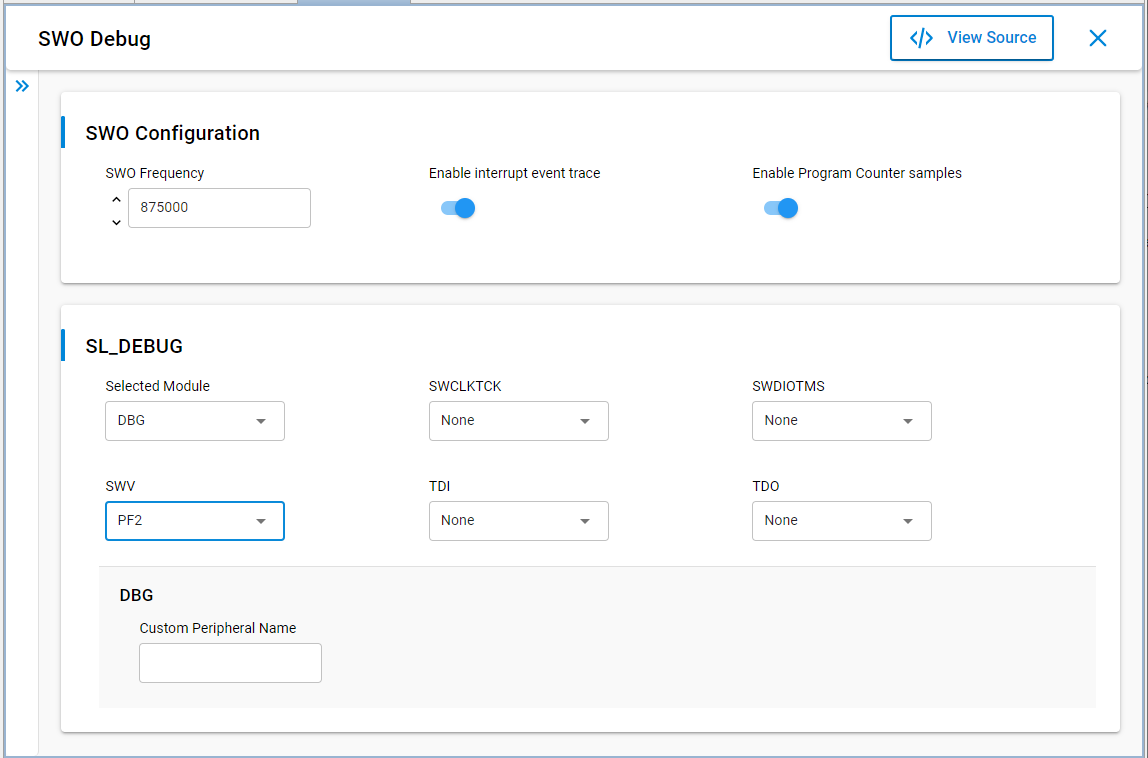
Open its configuration file and turn on Enable interrupt event trace and Enable program counter samples.
If the device allows SWO functionality on multiple GPIO pins, in the SL_Debug card's SWV field, select the pin to be used as the SWO output.
Further initialization of the software component in code is not required provided that the System Init component is installed in the project.