Generating Conversion Data#
Piecewise Linear Curve Fits#
Piecewise Linear Curves are used as a method of converting dBm into power level
in RAIL 2.x and is available in rail_util_pa plugin component.
The following steps explain how to generate the piecewise fit curves for the
following PAs:
EFR32xG21: All PAs
EFR32xG22: High-power 2.4 GHz
EFR32xG23: All PAs
EFR32xG24: High-power 2.4 GHz
The procedure uses the 2.4 GHz high-power PA on EFR32xG2x devices as an example, but the same procedure is applicable to all the aforementioned PAs. For the other PAs, which do not use the piecewise linear fit approach, see Lookup Table Fits below.
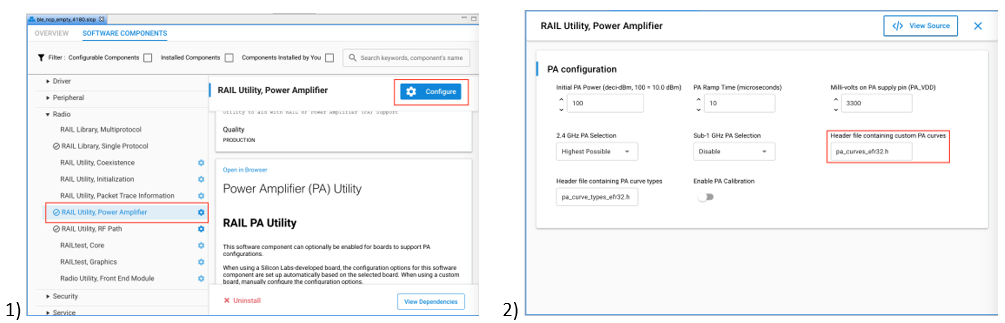
In Simplicity Studio, generate a RAILtest application configured with the desired PA, PA power source, and PA ramp time. The configuration process depends on the Proprietary Flex SDK version. If you are using version 2.x with Simplicity Studio 4, use Hardware Configurator (see AN1115: Configuring Peripherals for 32-Bit Devices using Hardware Configurator for more detail). If you are using version 3.x with Simplicity Studio 5, use the Component Editor to modify the RAIL Utility, Power Amplifier component. Build the RAILtest application, and flash the resulting binary to the chip mounted to the PCB you are trying to characterize.
Connect the RF output of the board (U.FL test connector, SMA connector, or similar, with antenna disconnected from the RF path) to the input of a spectrum analyzer. The spectrum analyzer should be in dBm peak detection mode to sense values between approximately -30 to 20 dBm and centered on the base frequency/channel for your PHY and channel combination. Make sure to account for any cable / adapter loss in your measurements.
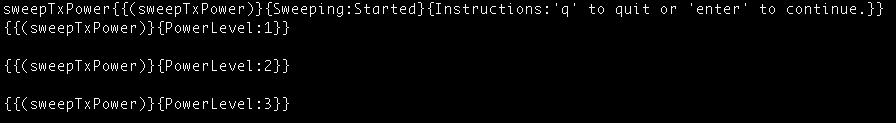
Connect to the RAILtest CLI and enter the command
sweepTxPower. For more information on RAILtest functionality and the CLI interface, see Miscellaneous in the RAILtest User's Guide.Your chip should begin a CW tone at power level 1. Record the power level and dBm power measured on the spectrum analyzer in a CSV file in the format
<POWER_LEVEL>,<ACTUAL_DBM_OUTPUT>with one reading per line. Note that unlike the conversion functionsRAIL_GetTxPowerDbm()andRAIL_SetTxPowerDbm(), which use deci-dBm values, values in these csv files should be specified in dBm. Sample files Vbatt_efr32xg21_HP.csv and Vbatt_efr32xg24_HP_10dbm.csv are included in the SDK for reference, and can be found in the/platform/radio/rail_lib/chip/efr32/efr32xg2x/characterizationfolder of the SDK installation.Repeat step 4 for all power levels. Press Enter in the RAILtest CLI to progress to the next power level.
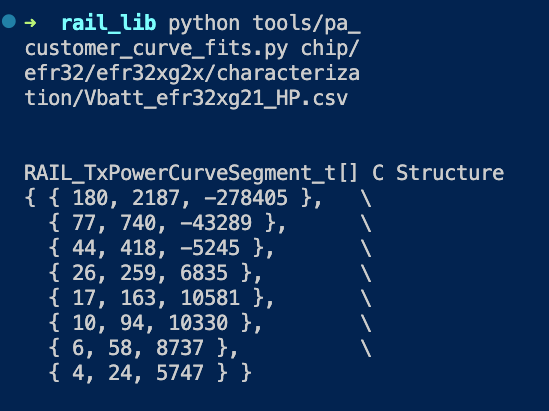
From a terminal prompt, run the pa_customer_curve_fits.py script (in /platform/radio/rail_lib/tools), with the
python pa_customer_curve_fits.py
<CSV_FILE>
. If you don’t already have them installed, you will need to install the numpy and pylab python libraries. Running the commandspip install numpyandpip install matplotlibwill install those libraries in the appropriate directories on your machine to be accessible by python. The following figure shows an example of an intended result, after the pa_customer_curve_fits.py script has been run on the Vbatt_efr32xg21_HP.csv file from a terminal prompt.Note: The script also provides extra parameters such as –maxPower/-m and –increment/-i to accommodate the maximum power from the csv and to divide the data in segments of needed "increment" dBm steps.
If using multiple PAs, repeat steps 1-6 for the PA you did not characterize previously.
Create a copy of the PA curve file (here and in subsequent steps, "PA curve file" refers to pa_curves_efr32xg2x.h in RAIL 2.8 and earlier versions, and sl_rail_util_pa_curves.h in RAIL 2.9 versions and later depending on the platform currently being characterized). Copy the terminal output from the python script under the appropriate macro. Note that there is one
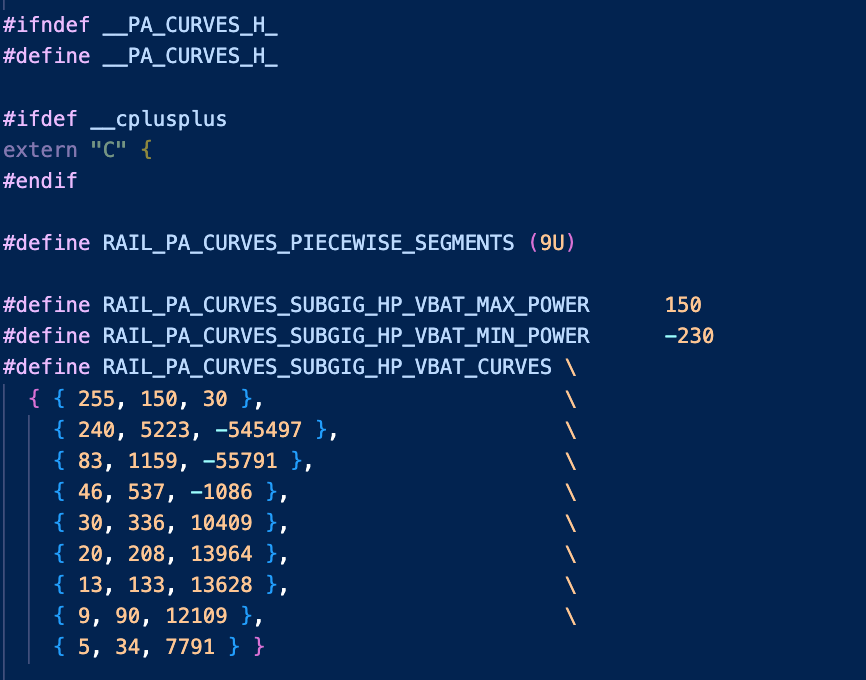
RAIL_PA_CURVES_…define for each combination of PA and PA power source available for your hardware. You do not need to copy data for a PA/PA power supply (…_VBAT_…or…_DCDC_…) combination that is not being used. Additionally, update the…_MIN_POWERand…_MAX_POWERmacros to reflect the values you observed. The following figure shows an example of the copying process, where the values from the previous figure have been copied into the appropriate macros in a sl_rail_util_pa_curves.h file. There is also an example of subGhz curve for EFR32xG23. Note how…MIN_POWERand…_MAX_POWERmacros have been updated.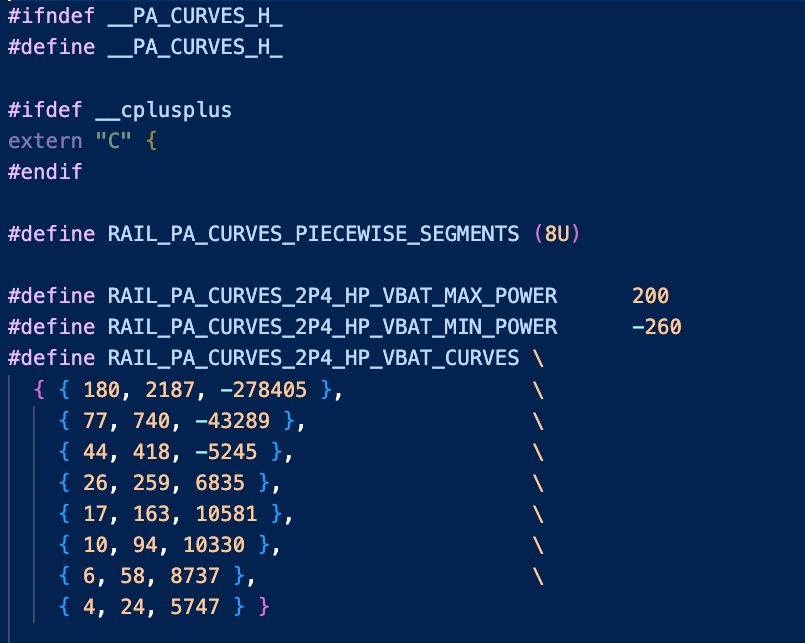
Update the hardware config
HAL_PA_CURVE_HEADERheader to point to your new file. The figures illustrates where to update the header. The interface depends on the tool used (Hardware Configurator in Proprietary Flex SDK 2.x, or Component Editor in Proprietary Flex SDK 3.x).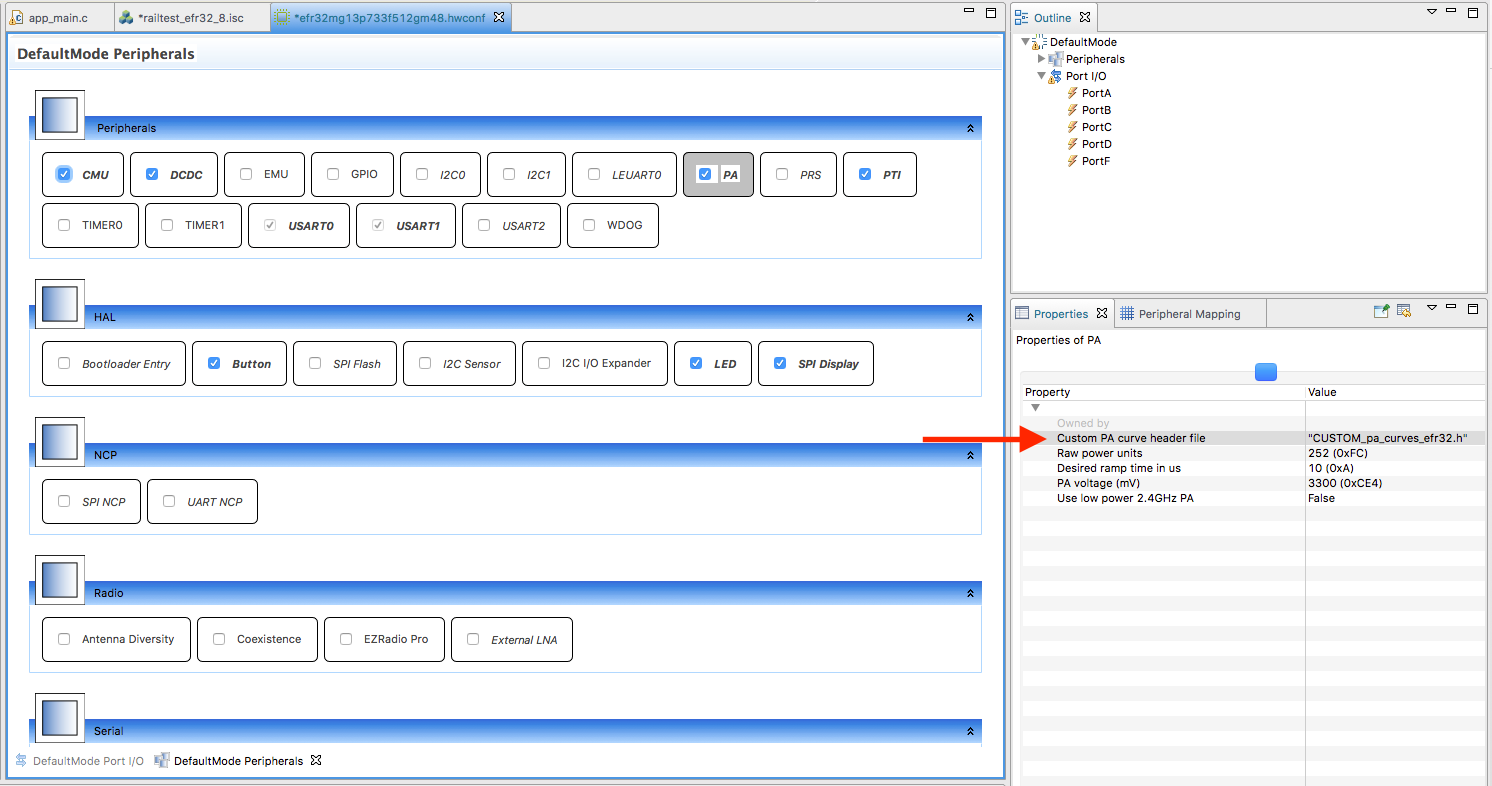
For customers using only one or two of the available PAs, Silicon Labs recommends removing references to these functions from pa_conversions_efr32.c and from the
RAIL_DECLARE_TX_POWERmacros in your new version of the PA curves file. Although not strictly necessary, doing this can save substantial code size versus compiling in useless data for a PA that is never engaged.
Lookup Table Fits#
This information applies to the following PAs in RAIL 2.x:
EFR32xG22: Low power 2.4 GHz
EFR32xG24x01x: Low power 2.4 GHz
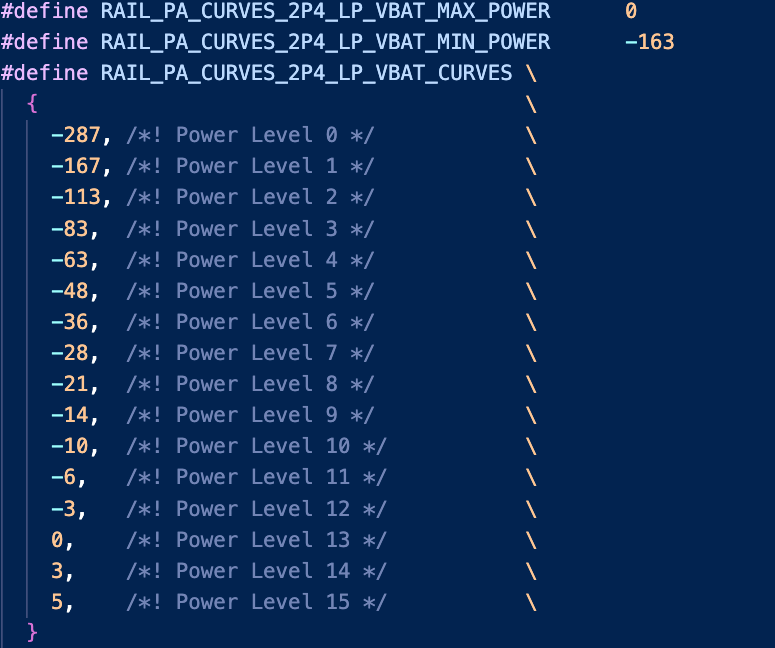
With only a few unique power levels, some PAs on some chip families use a simple lookup table to translate power levels to output powers, as opposed to a more code-size-intensive curve fit. Using the EFR32xG22 low-power PA as an example, follow steps 1-5 in the previous section, but for step 4, place the results directly into the RAIL_PA_CURVES_2P4_LP macro of the custom PA curves file. These values should be entered as deci-dBm (for example, enter -100 to indicate -10 dBm). A similar process can be followed for any other PAs using the lookup table approach. The following two figures contain an example of this process.
dBm-to-powerSetting Mode#
A table in memory that contains a "powerSetting" for each supported dBm level is
provided for the EFR32xG25 and SixG301 families in RAIL 2.x and is the preferred
method for all platforms in RAIL 3.0. In RAIL 3.0, sl_rail_util_pa and
sl_rail_util_pa_tables plugin provide support for powersetting tables for all
platforms in RAIL 3.0. The table specifies the minimum and maximum dBm levels
that are supported, as well as the step size between entries in the table. The
default step size is 0.1 dBm. This allows for precise control over the output
power of the PA, making it possible to achieve the desired level of performance
across the entire range of supported dBm levels. To accomplish this, a new mode
has been added to the EFR32xG25 family that allows for a single PA to support
the entire range of supported dBm levels for both the OFDM and Sub-GHz (FSK) PAs.
Note that this new mode utilizes "power-Setting" instead of the traditional
"power levels" for the output power of the PA. As a result, the capability to
set a specific "raw" power level is no longer supported in this mode. Only the
setting of dBm levels from the table is supported in this mode. The
“powerSetting” table is also provided to the SixG301 family, but there is not a
special mode to use it.
OFDM#
A powerSetting for OFDM is comprised of three primary components: the digital gain, the slice level, and the filter gain. These fields are extracted from powersetting value and are set up.These three components work together to determine the overall power output of the PA for OFDM signals.
To ensure proper usage and optimal performance, it is important to adhere to the valid ranges for the digital gain, slice level, and filter gain. The valid range for the digital gain is 0 to 204 (the value is multiplied by 5 in RAIL, resulting in a range of 0 to 1020), the valid range for the slice level is 0 to 191, and the valid range for the filter gain is 0 to 3.
In addition to the valid ranges, the following are the recommended ranges: digital gain between 200 and 800, filter gain of 2.
To generate a table using the pa_dbm_mapping_table_generator.py script (in platform/radio/rail_lib/tools), you need a CSV file containing the necessary data for OFDM mode. The file should have a header row with column names for:
Digital gain
Slice level
Filter gain
Each subsequent row should contain data for a specific dBm level within the desired range. Each column's data should be separated by a comma, and you can add optional comments for each row using the "#" symbol. It is crucial to ensure that the CSV file is properly formatted, with the correct data in each column and the correct number of rows for the desired dBm range.
Format of the OFDM PA CSV File
TXTRIMPASLICE | GAINDIG | FILGAIN | #dBm |
|---|---|---|---|
x | x | x | #-317 |
x | x | x | #-316 |
x | x | x | #-315 |
x | x | x | #-314 |
This table shows an example of how the CSV file should be formatted for generating a table for OFDM mode. The first row is the header row, which specifies the column names. Each subsequent row contains data on the power settings for a specific dBm level, as well as an optional comment indicating the corresponding dBm value. The data for each column is separated by a comma. It is important to include a row for every dBm level within the desired range, with the appropriate power setting values for each level. Be aware that the "dBm" column in the table is preceded by a "#" symbol, which indicates that it is a comment and will be ignored by the script.
Sub-GHz (FSK)#
A powerSetting for Sub-GHz (FSK) mode is comprised of four primary components: the fine current setting, the coarse current setting, the slice level, and the stripe setting. Sub-GHz powersetting entry has fields of coarse current, fine current, slice and stripe. These fields are extracted from the powersetting entry using mask and shift and are set up. These four components work together to determine the overall power output of the PA for Sub-GHz (FSK) signals.
The valid range for the fine current setting is 0 to 8, the valid range for the coarse current setting is 0 to 31, the valid range for the slice level is 0 to 2, and the valid range for the stripe setting is 0 to 31.
In addition to the valid ranges, the following are the recommended ranges: current fine of 4, and slice level between 1 and 2.
To generate a table using the pa_dbm_mapping_table_generator.py script (in platform/radio/rail_lib/tools), you need a CSV file containing the necessary data for Sub-GHz (FSK) mode. The file should have a header row with column names for:
Coarse current setting
Fine current setting
Slice level
Stripe setting
Each subsequent row should contain data for a specific dBm level within the desired range. Each column's data should be separated by a comma, and you can add optional comments for each row using the "#" symbol. It is crucial to ensure that the CSV file is properly formatted, with the correct data in each column and the correct number of rows for the desired dBm range.
Format of the Sub-GHz (FSK) PA CSV File
COARSE | FINE | SLICE | STRIPE | #dBm |
|---|---|---|---|---|
x | x | x | x | #-317 |
x | x | x | x | #-316 |
x | x | x | x | #-315 |
x | x | x | x | #-314 |
This table shows an example of how the CSV file should be formatted for generating a table for Sub-GHz (FSK) mode. The first row is the header row, which specifies the column names. Each subsequent row contains data on the power settings for a specific dBm level, as well as an optional comment indicating the corresponding dBm value. The data for each column is separated by a comma. It is important to include a row for every dBm level within the desired range, with the appropriate power setting values for each level. Be aware that the "dBm" column in the table is preceded by a "#" symbol, which indicates that it is a comment and will be ignored by the script.
Common#
A common powerSetting format applies to: RAIL 2.x:
SixG301 family
RAIL 3.0:
All Series 2 devices (except EFR32xG25 - see OFDM/Sub-GHz sections)
EFR32xG21 (10 dBm, 20 dBm PA variants)
EFR32xG22 (0 dBm, 6 dBm PA variants)
EFR32xG23 (10 dBm, 14 dBm, 20 dBm PA with HP/MP/LP/LLP sub-modes)
EFR32xG24 (0 dBm, 10 dBm, 20 dBm PA)
EFR32xG26 (0 dBm, 10 dBm, 20 dBm PA)
EFR32xG27 (0 dBm, 4 dBm, 8 dBm PA)
EFR32xG28 (14 dBm, 20 dBm PA)
EFR32xG29 (0 dBm, 8 dBm PA)
EFR32xG2B (Sub-GHz variants)
EFR32xG2D (14 dBm, 20 dBm PA)
SixG301 family
The common powersetting entry is comprised of two main bitfields: the scalor and PA sub-mode setting. The bitfield looks as below: |15-14:sub-mode|13-8:unused|7-0:scalor| The scalor is synonymous to power level in the Lookup Table Fits section. The scalor is extracted using SLI_RAIL_UTIL_PATABLE_SCALOR_MASK and the sub-mode is extracted using SLI_RAIL_UTIL_PA_TABLE_SUBMODE_MASK and SLI_RAIL_UTIL_PA_TABLE_SUBMODE_SHIFT. The sub-mode can have one of these values {0= High Power, 1= Medium Power, 2= Low Power, 3 = Low Low Power}.
To generate a table using the pa_dbm_mapping_table_generator.py script (in platform/radio/rail_lib/tools), you need a CSV file containing the necessary data for Common powersetting. The --type input from the choices 10dBm or 0dBm is needed for the script and that populates the correct sub-mode in the generated powersetting table. Generated output will also have that appended along with the scalor. The CSV file should have a header row with column names for:
Scalor
Each subsequent row should contain data for a specific dBm level within the desired range. Each column's data should be separated by a comma; you can add optional comments for each row using the "#" symbol. It is crucial that the CSV file is properly formatted, with the correct data in each column and the correct number of rows for the desired dBm range.
Format of the Common(FSK) PA CSV File
Scalor | #dBm |
|---|---|
x | #-317 |
x | #-316 |
x | #-315 |
x | #-314 |
This table shows an example of how the CSV file should be formatted for generating a table for Common mode for SixG301. The first row is the header row, which specifies the column names. Each subsequent row contains data on the power settings for a specific dBm level, as well as an optional comment indicating the corresponding dBm value. The data for each column is separated by a comma. It is important to include a row for every dBm level within the desired range, with the appropriate power setting values for each level. Note that the "dBm" column in the table is preceded by a "#" symbol, which indicates that it is a comment and will be ignored by the script.
Generating the Table#
The script pa_dbm_mapping_table_generator.py is located in the
platform/radio/rail_lib/tools directory. It takes data from the CSV file
specified with the File argument and generates a list of power setting values
based on the -min or --minPower and -max or --maxPower arguments. To
understand the CSV format for each respective mode, refer to the OFDM and Sub-GHz
sections above. Note that a -t or --type argument is also required, with a
default value of OFDM, to specify the type of curve.
It also accepts command-line arguments for:
An optional flag
-for--femto indicate whether the table is for a front-end module (FEM) with a default value of False.An optional argument
-oor--outputto specify the output file for the generated code.
The script has a default increment value for the dBm levels, which you can customize as needed. Additionally, the script generates C code for defining the table, including:
The number of values
The step size between dBm levels
The minimum and maximum dBm levels
The actual power setting values
Finally, the script outputs the generated C code to stdout. To use the
generated table, you should replace the applicable contents of the
plugin/pa-conversions/efr32xg25/ files with the output of the script.
Example on how to use the script
python3 tools/pa_dbm_mapping_table_generator.py plugin/pa-conversions/sixg301/RAIL_TX_POWER_MODE_10DBM_POWERSETTING_TABLE.csv -c 301 -min -320 -max 120 -t 10dbm
#output to a file
python3 tools/pa_dbm_mapping_table_generator.py plugin/pa-conversions/sixg301/RAIL_TX_POWER_MODE_10DBM_POWERSETTING_TABLE.csv
-c 301 -min -320 -max 120 -t 10dbm -o output.h
#Add a specific increment in deci-dBm using `-i`
python3 tools/pa_dbm_mapping_table_generator.py plugin/pa-conversions/sixg301/RAIL_TX_POWER_MODE_10DBM_POWERSETTING_TABLE.csv
-c 301 -min -320 -max 120 -t 10dbm -i 10 -o output.h
Migrating from curves to powersetting mapping table#
When you want to migrate to RAIL 3.0, you can use the script
platform/radio/rail_lib/tools/convert_curves_to_tables_s2.py to convert the
CSV used for existing curves to generate powersetting tables.
# Example for xG24 HP mode, 20dBm max
python3 tools/convert_curves_to_tables_s2.py \
chip/efr32/efr32xg2x/characterization/Vbatt_efr32xg24_HP_20dbm_vbat.csv \
-c 24 \
-p HP \
-m 203 \
-n -336 \
-s 10 \
-r lowest \
-o /tmp/pa_table_xg24_hp_20dbm.hFill the appropriate powersetting_mapping_table.h with values for SL_RAIL_PA_TABLE_x_NUM_VALUES, SL_RAIL_PA_TABLE_x_STEP_DDBM, SL_RAIL_PA_TABLE_x_MAX_POWER_DDBM, SL_RAIL_PA_TABLE_x_MIN_POWER_DDBM and SL_RAIL_PA_TABLE_x.
Currently the naming used for RAIL 3.0 tables is SL_RAIL_PA_TABLE_x where x is 0 or 1. All series-2 (other than EFR32xG25 and EFR32xG28) and SixG301 chips support only one powersetting table which means only SL_RAIL_PA_TABLE_0 is available but on EFR32xG25 and EFR32xG28, two PA modes are supported and so they have SL_RAIL_PA_TABLE_0 and SL_RAIL_PA_TABLE_1.
The list below provides the PA modes supported for each part:
EFR32xG21
SL_RAIL_PA_TABLE_0 - 2.4 GHz
EFR32xG22
SL_RAIL_PA_TABLE_0 - 2.4 GHz
EFR32xG23
SL_RAIL_PA_TABLE_0 - Sub-GHz
EFR32xG24
SL_RAIL_PA_TABLE_0 - 2.4 GHz
EFR32xG25
SL_RAIL_PA_TABLE_0 - Sub-GHz
SL_RAIL_PA_TABLE_1 - Linear OFDM
EFR32xG26
SL_RAIL_PA_TABLE_0 - 2.4 GHz
EFR32xG27
SL_RAIL_PA_TABLE_0 - 2.4 GHz
EFR32xG28
SL_RAIL_PA_TABLE_0 - 2.4 GHz
SL_RAIL_PA_TABLE_1 - Sub-GHz
EFR32xG29
SL_RAIL_PA_TABLE_0 - 2.4 GHz
SixG301
SL_RAIL_PA_TABLE_0 - 2.4 GHz