AoA Analyzer#
The AoA Analyzer tool can be used to demonstrate the capabilities of the RTL library with regard to the Angle of Arrival (AoA) estimation from Constant Tone Extension (CTE) signals using one locator device. The tool can be used to configure and connect to a locator, define estimation mode, and evaluate the performance of the RTL library in real-time.
AoA Analyzer aggregates a set of user-friendly tools that are used for configuring, visualizing, analyzing, recording, and post-processing direction finding using a single locator. These are:
3D VIEW: Used for connecting, configuring antenna boards, and visualizing the direction of assets with respect to a locator in 3D.
ANALYZER: Used for creating charts using the real-time data stream from asset tags.
ASSETS: Used for visualizing the list of asset tags, hide/reveal tags in the 3d view mode, start/stop IQ sample recording to postprocess and replay back later.
AoA Viewer: A standalone tool used for replaying and post-processing IQ sample recordings.
To launch AoA Analyzer:
From Simplicity Studio 5’s Launcher perspective, click Tools.
In the Tools Dialog, select AoA Analyzer.
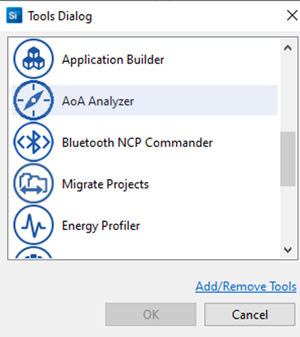
Click OK. AoA Analyzer opens in the Simplicity IDE perspective.
Note: AoA Analyzer works together with Antenna Array boards that were previously programmed with Bluetooth - NCP AoA Locator firmware. To test the device you will also need a tag, programmed with Bluetooth - AoA Asset Tag firmware. For details, see Getting Started with Silicon Labs’ Direction Finding Solution.
3D View#
By default the AoA analyzer opens in 3D VIEW.
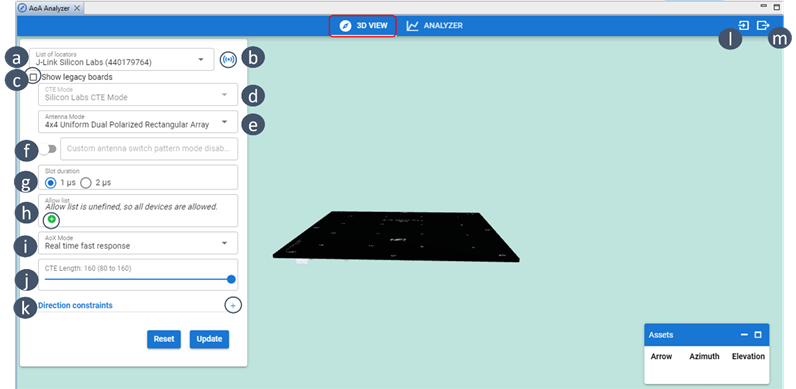
Use the 3D VIEW tool to:
Select your locator from a list of J-Link devices.
Connect your locator.
Enable to display legacy antenna boards (i.e BRD4185A).
Choose the CTE mode.
Select the antenna type: Dual polarized 4x4 URA, 4x4 URA, 3x3 URA or 1x4 ULA.
Enable custom switching pattern. Default is 0 to 15.
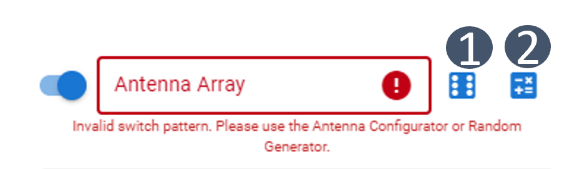
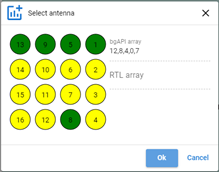
Select (1) to generate a random switching pattern, or (2) to manually configure the switching pattern using a GUI, as shown in the following figure.
Select the switch slot duration: 1 µS, 2 µS.
Add the allowed list of tags.
Select the AoX mode.
Set the CTE length.
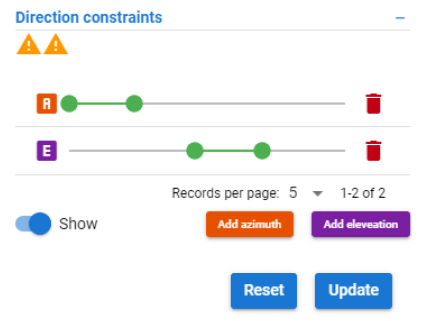
Insert direction (angle) constraints. Note that you can add as many azimuth and elevation angle constraints as you want. Simply click add azimuth / elevation button to add new direction constraints.
import a JSON configuration file of a locator.
export a locator’s configuration to a JSON file.
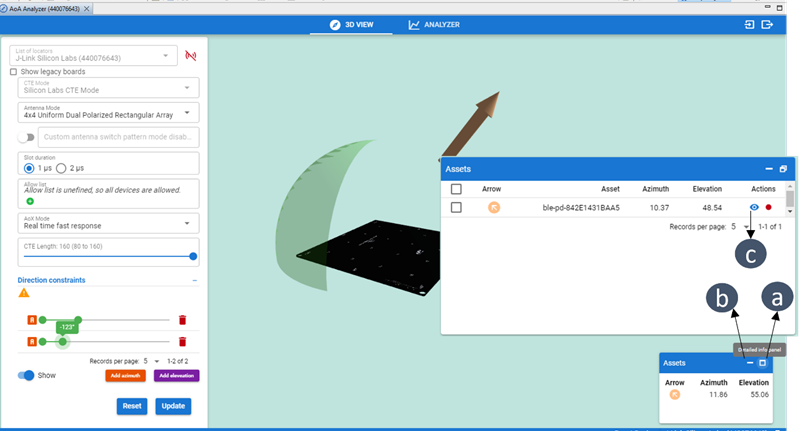
Once the locator is connected through step b, the AoA analyzer generates arrows that emanate from the locator device pointing towards the direction of the asset tags that it finds in its vicinity. It also displays the azimuth and elevation angle values of the tags in the Assets window (see figure in the following section).
Assets#
Use the maximize button in the Assets window to see the Detailed info panel of the asset tags (button a in the following figure), and the minimize button to hide the info panel (button b in the following figure). Use button c to hide a specific tag from the 3D VIEW.
After you make a configuration change click Update to see the effect in real time. Or Reset to return to the default values.
Analyzer#
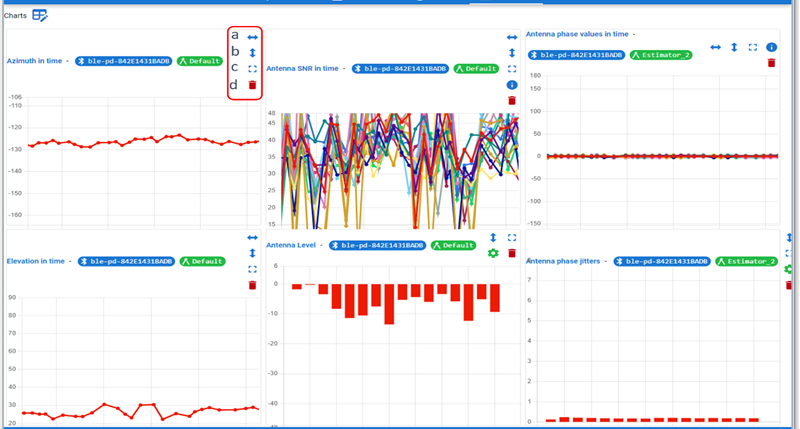
Use the ANALYZER tool to visualize different parameters of an asset tag measured by a locator device in real time using charts. You can create up to 20 charts in one step by combining asset tags, estimators, and the chart types.
To create charts using the ANALYZER tool:
Click Charts.
Select the number of charts and how they will be displayed in rows and columns.
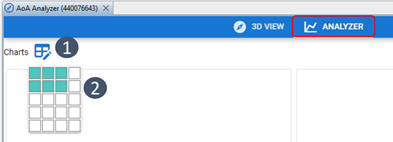
A corresponding grid of chart placeholders is displayed.
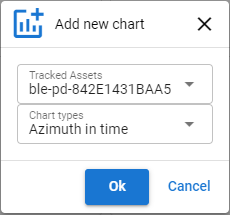
Click the symbol in the middle of a placeholder. The Add new chart dialog opens. Here you can select the asset tag and chart type. Click OK.
Repeat for each chart placeholder to populate the Charts display with real-time graphs. For each chart, you can (a) zoom X, (b) zoom Y, (c) go to full screen, or (d) delete the chart.
Recording and Playback#
In the Assets window of the 3D VIEW tool, use the recording button to start recording IQ samples.
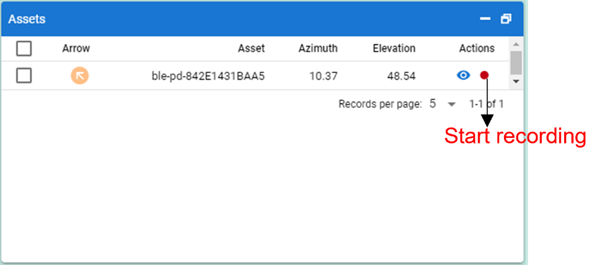
When prompted, save the file to a preferred location. By default the recordings files are saved using the tag’s public BLE device ID in the filename: ble-pd-xxxxxxxxxxxx.aoarec.
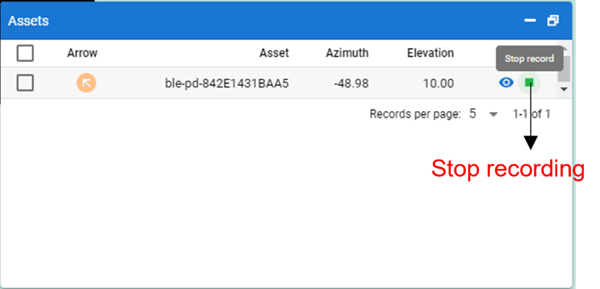
Stop the recording using the Stop record button.
To play back or postprocess the recording, simply drag and drop the *.aoarec file into Simplicity Studio’s Simplicity IDE perspective. Alternatively, go to File > Open file, and browse to the location where you saved the recording.
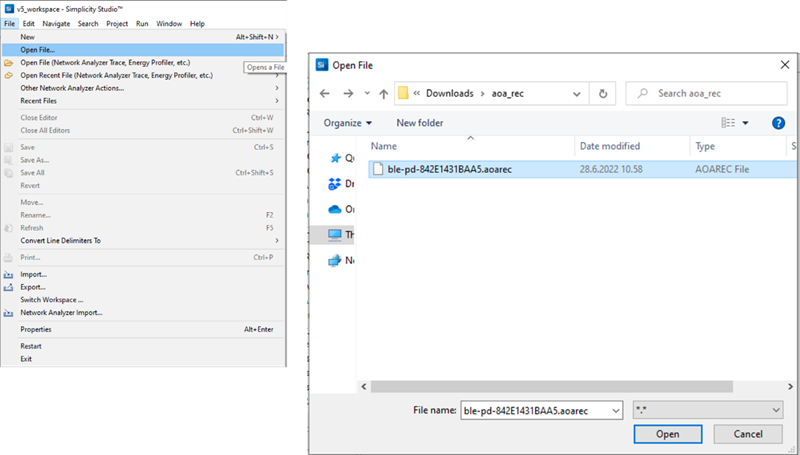
Select and Open the file. Then the recording opens using the AoA Viewer.
The AoA Viewer provides a 3D View, an Analyzer, and Export functions, accessed through tabs on the toolbar. The Overview tab’s functions are annotated in the following figure.
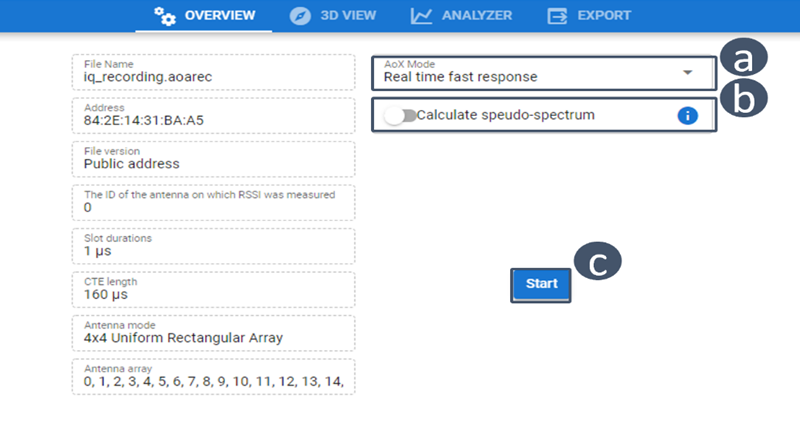
(a) Choose the AoX Mode
(b) Enable pseudo-spectrum calculation (requires huge computational resources and can be slow)
(c) Start the IQ sample processing
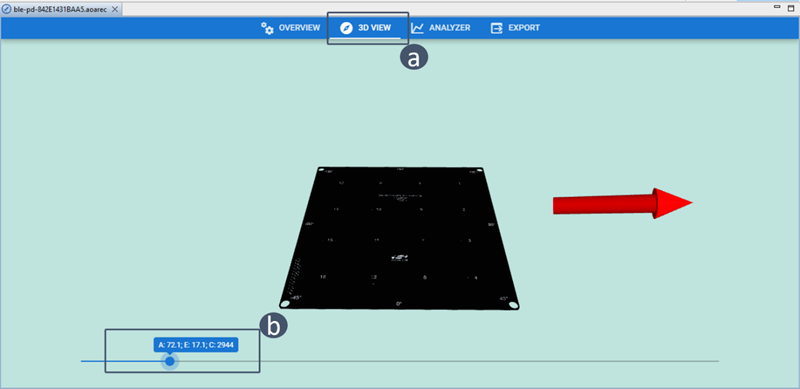
Use the 3D VIEW tool ((a) in the following figure) to start the playback. Click/move inside the scroll bar (b) to view the azimuth (A), and Elevation (E) angles for each corresponding event counter value (C).
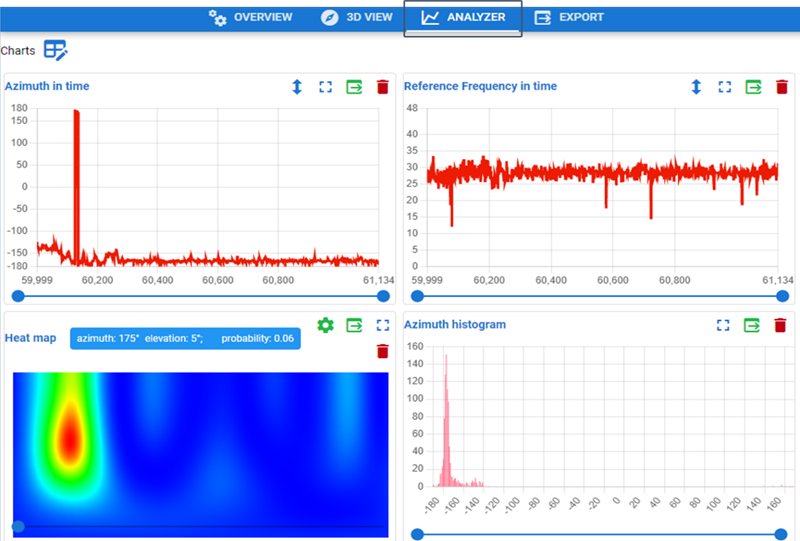
Use the ANALYZER tool to draw line charts and histograms. If you enabled the pseudo-spectrum calculation, you can also graph a heat map to visualize the pseudo-spectra computation.
Use the EXPORT tool to export the postprocessing results of your IQ sample recordings in either JSON or CSV format.