Simplicity Studio Channel Sounding Analyzer#
With the release of Simplicity Studio v5.9, Silicon Labs introduces Channel Sounding Analyzer, which is similar to the previous Accurate Bluetooth Ranging Analyzer tool with a few UI enhancements to accommodate the new host-NCP architecture where the RTL runs on the SoC. Channel Sounding Analyzer is designed to visualize the estimated distance, perform data analysis, and help with troubleshooting. The tool can be accessed through Simplicity Studio’s Tools menu.
To launch Channel Sounding Analyzer:
From Simplicity Studio 5’s Launcher perspective, click Tools.
In the Tools dialog, select Channel Sounding Analyzer.
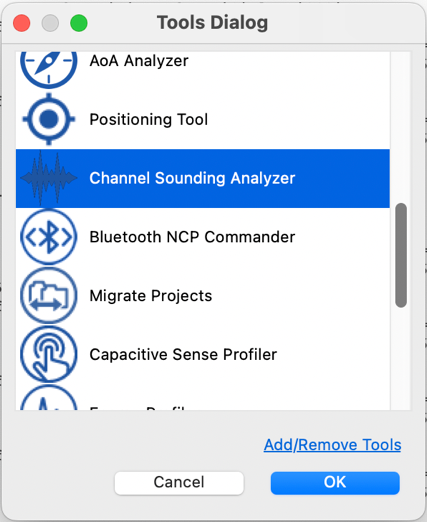
Click OK. Channel Sounding Analyzer opens in a new tab.
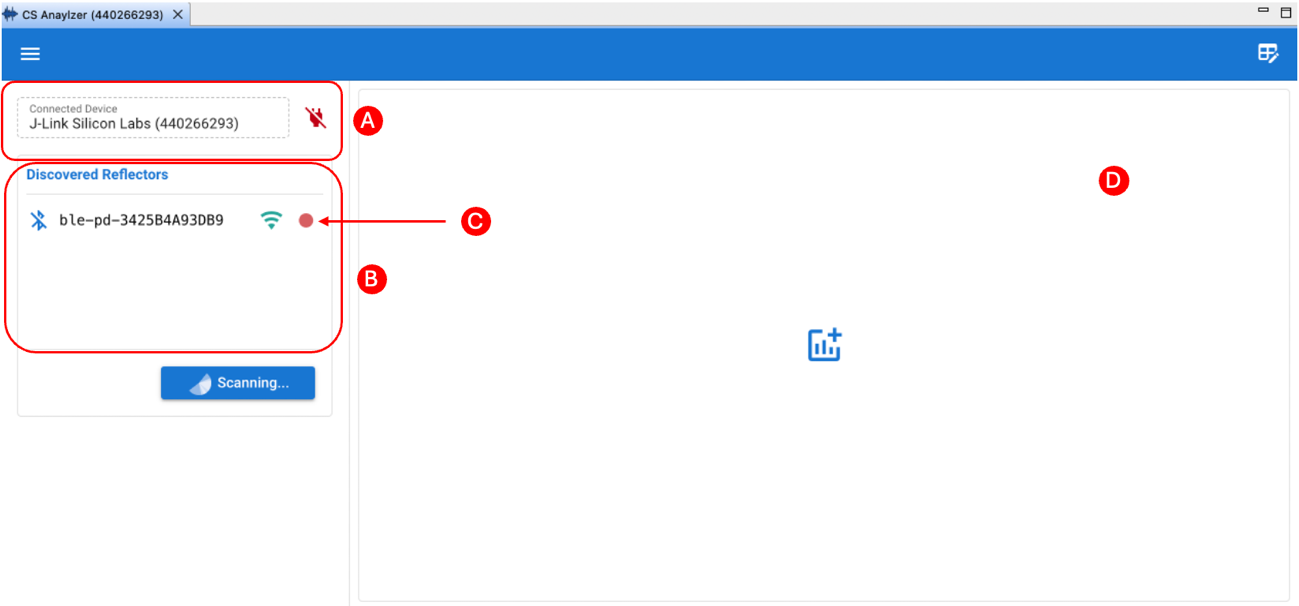
A. Allows connecting to the Initiator device using its J-Link ID.
B. Lists discovered Reflector devices.
C. Starts recording the measurement results.
D. Enables different chart layout.
Note: Channel Sounding Analyzer works with a Channel Sounding enabled radio board (Ex: BRD4198A) that is programmed with Bluetooth – NCP for Channel Sounding.
Key Features#
Out-of-the-Box Device Connectivity#
Through a streamlined interface, you can establish connection to the J-Link of your Initiator device and start scanning for a Reflector device.
To start a connection:
Select the J-Link ID of your Initiator device and connect it using the connect plugin. Scanning starts automatically.
Connect to your Reflector device from the list.
Select the CS mode: PBR or RTT.
Enable/disable Moving Object Tracking and click OK. The tool starts visualizing the distance estimation automatically.
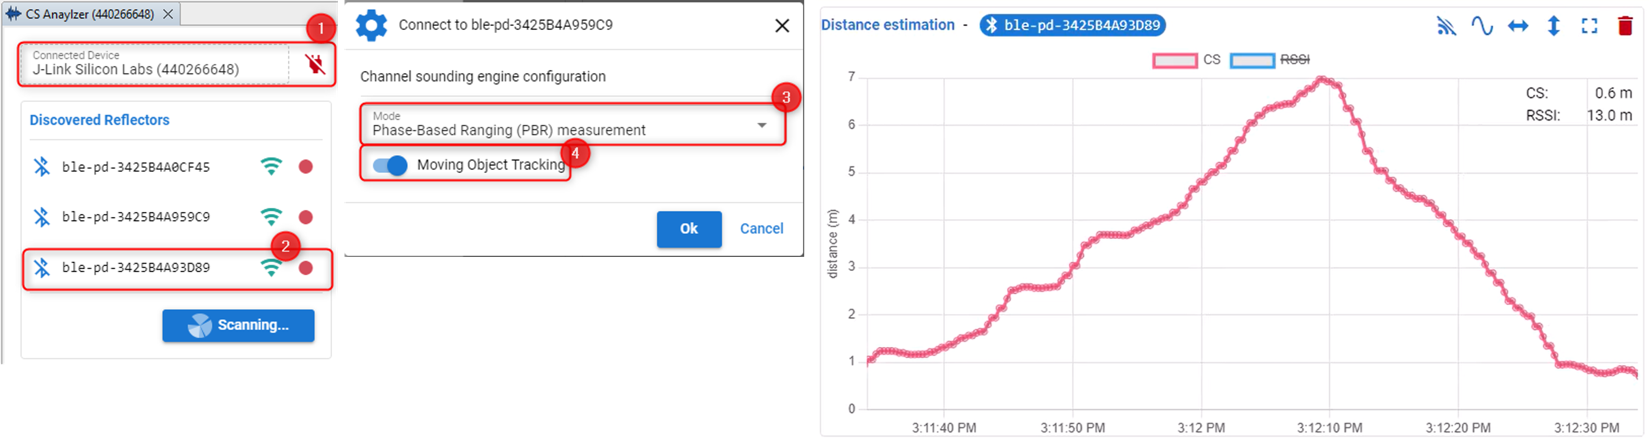
By default, CS PBR mode is selected, and Moving Object Tracking is enabled.
When Moving Object Tracking is enabled, SL_RTL_CS_ALGO_MODE_REAL_TIME_BASIC is selected automatically.
When Moving Object Tracking is disabled, SL_RTL_CS_ALGO_MODE_STATIC_HIGH_ACCURACY is selected, which is recommended for tracking stationary objects.
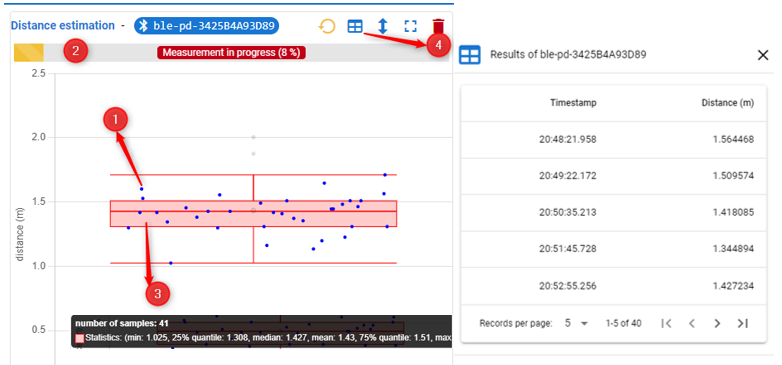
The STATIC mode results are visualized using a boxplot as follows:
Each point corresponds to a distance output from the RTL library using static mode (1).
A valid distance estimation is generated for every N CS procedure, and its progress is displayed as a percentage in the progress bar (2).
When hovering over the interquartile range (i.e., the box), you can view the statistical results of the static mode (3).
Clicking the table icon opens a table wizard that displays timestamps and corresponding distance estimations (4).
Enhanced Visualization#
Channel Sounding Analyzer provides a more advanced and adaptable chart layout for representing measurements.
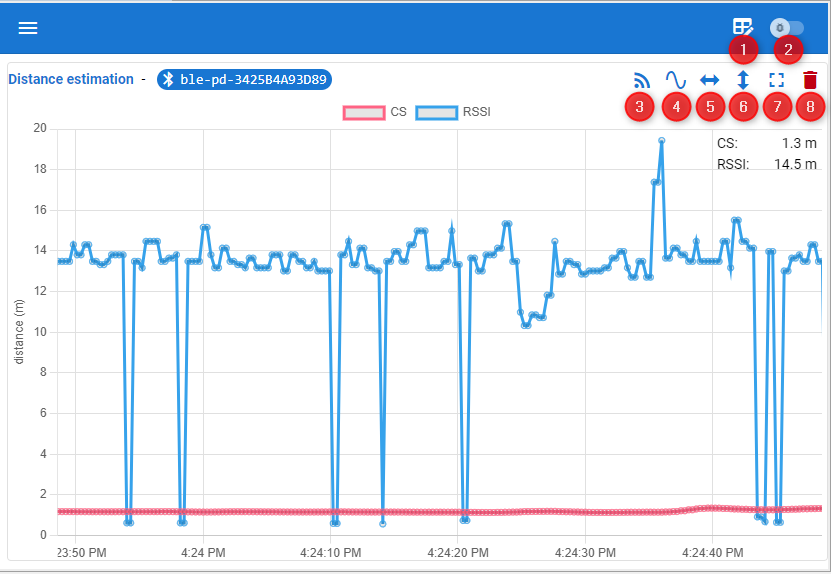
Using the menu bar in the charts you can:
Change the chart layout.
Select lighting preference.
Turn on/off the RSSI based distance measure-ment.
Set the sample rate of the visualizer.
Adjust the time window.
Set the maximum and minimum distance range.
Go to full screen.
Remove the chart.
Data Analysis and Debugging#
Channel Sounding Analyzer can also be used for analyzing different CS data and debugging purpose.
You can use the Channel Sounding Analyzer to:
Enable logging RTL logs to a JSON file. This must be enabled before connecting to the J-Link ID of the Initiator.
Enable logging distance estimations into a JSON file.
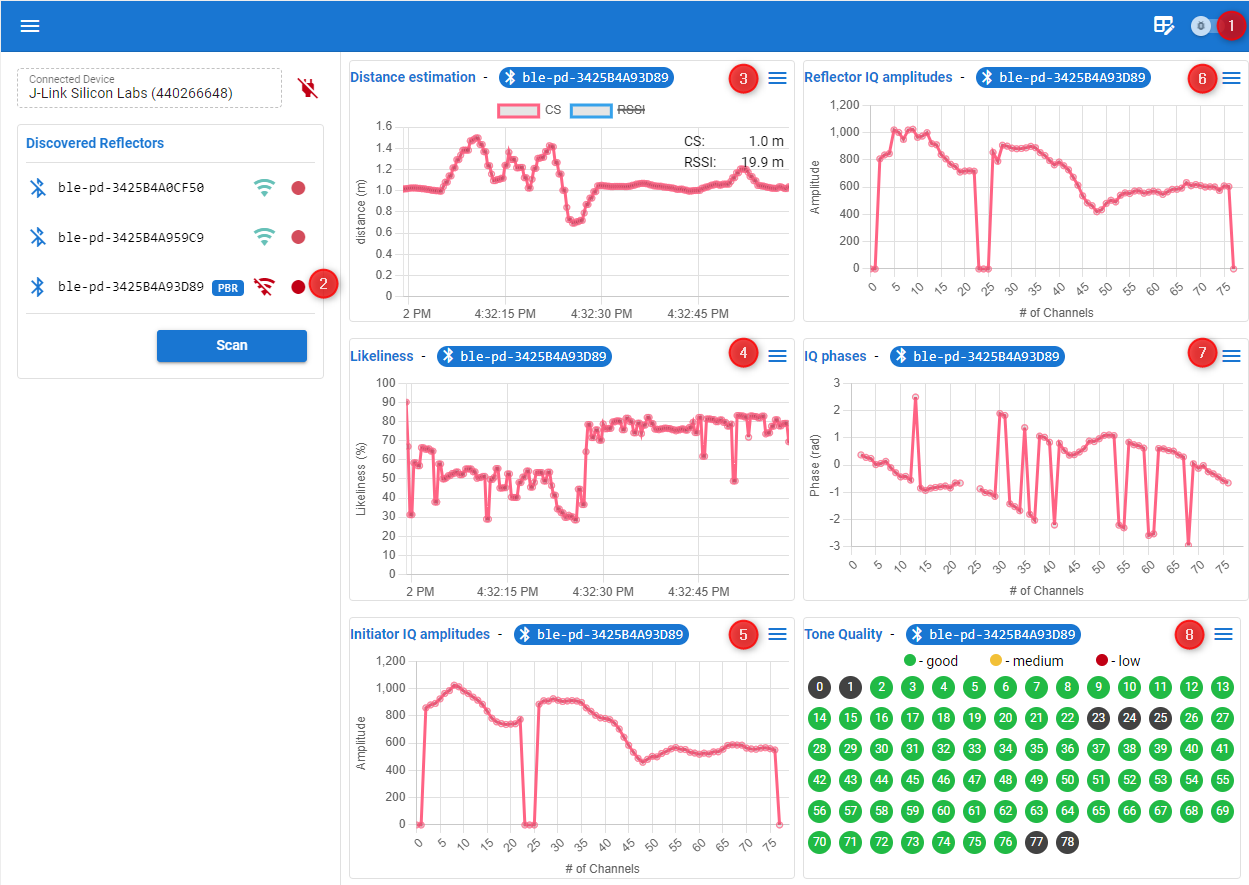
Visualize the measured distance values.
Monitor the likeliness of the measurement results.
Visualize the IQ amplitudes of the Initiator.
Visualize the IQ amplitudes of the Reflector.
Visualize the IQ phases values calculated by the Initiator.
Visualize the tone quality.