Simplicity Machine Learning Profiler#
Overview#
The Profiler is part of the Simplicity Machine Learning suite of tools. It helps you to understand how TensorFlow Lite for Microcontrollers (.tflite) models run on Silicon Labs embedded devices and optimize them before deployment.
The tool enables users to:
Correlate layer execution with clock rate, and memory pressure.
Build intuition for optimizing models to reduce stalls and improve inference latency
Identify performance bottlenecks during inference
Understand trade-offs between execution on the ARM Cortex-M CPU and the Matrix Vector Processor (MVP).
View and analyze your model layer by layer.
Convert PyTorch (
.pt,.pth) and ONNX (.onnx) to.tflitemodels. The process is detailed in the Silicon Labs sml Converter page.
The tool is available as:
A graphical interface - Simplicity Machine Learning (GUI) or
smlA command-line interface - Simplicity Machine Learning (CLI) or
sml-cli
It can also be launched directly from Simplicity Studio v6.
Who This Tool Is For#
This documentation is written primarily for embedded and ML engineers.
Product managers, data scientists, and sales engineers are expected to be sufficiently familiar with machine learning concepts to interpret the results.
The profiler focuses exclusively on execution performance, not model accuracy or output quality.
Key Concepts and Terminology#
Term | Meaning |
|---|---|
Inference | One complete execution of a model |
Layer | A neural network layer |
Operator | A logical operation within a layer |
Kernel | The concrete implementation that executes an operator |
CPU | ARM Cortex-M core |
MVP | Matrix Vector Processor hardware accelerator |
Stall / Wait | Time spent idle due to memory or resource contention |
Tensor Arena | Memory allocated for TFLM state |
Quantization | Optimization technique to reduce model size |
Perfetto | The trace visualization tool used |
Running a Profiling Session from the GUI#
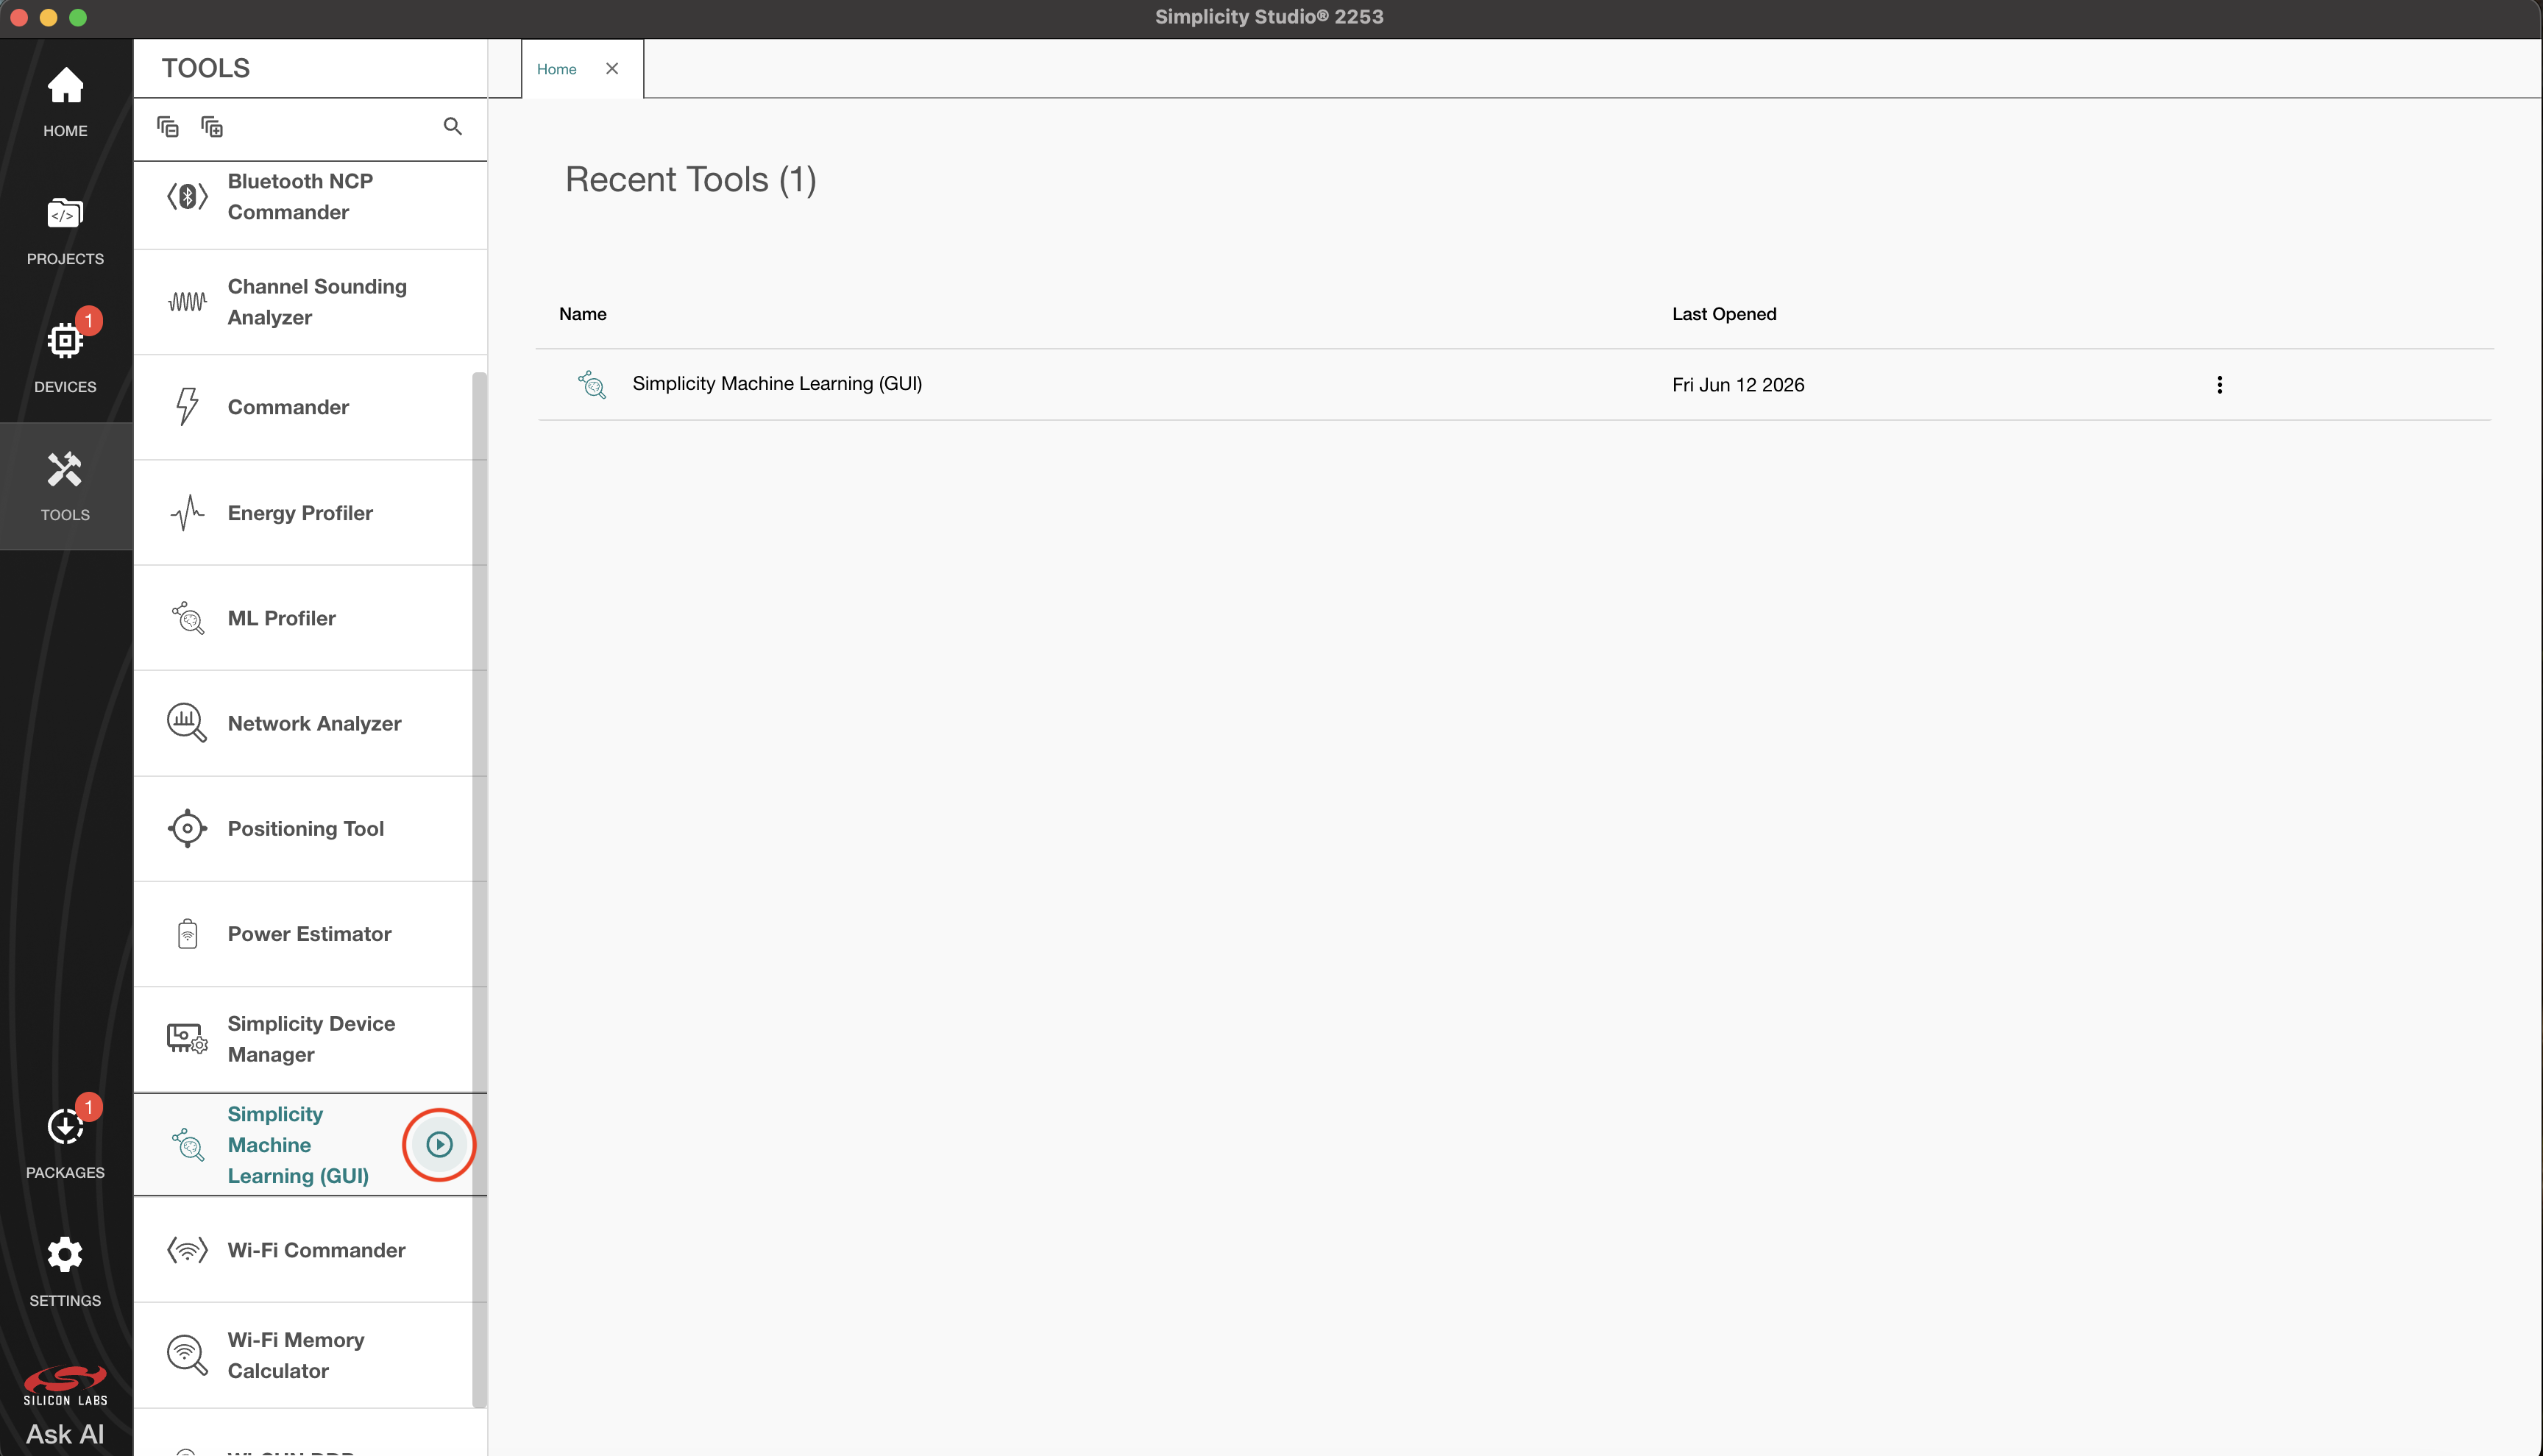
Launch the Simplicity Machine Learning tool from Simplicity Studio v6
Open Simplicity Studio and navigate to the Tools tab on the left panel.
Either click on the Simplicity Machine Learning(GUI) button to check the overview and launch the tool or point to Simplicity Machine Learning(GUI) and click the play icon.
Or, Launch the Simplicity Machine Learning from the command line:
slt launch smlStep 1 or 2 should launch the Simplicity Machine Learning. It is recommended to keep the window of Simplicity Machine Learning maximized or in full-screen for the best user experience.
Connect the board you on which you want to profile your model. The board will be detected automatically.
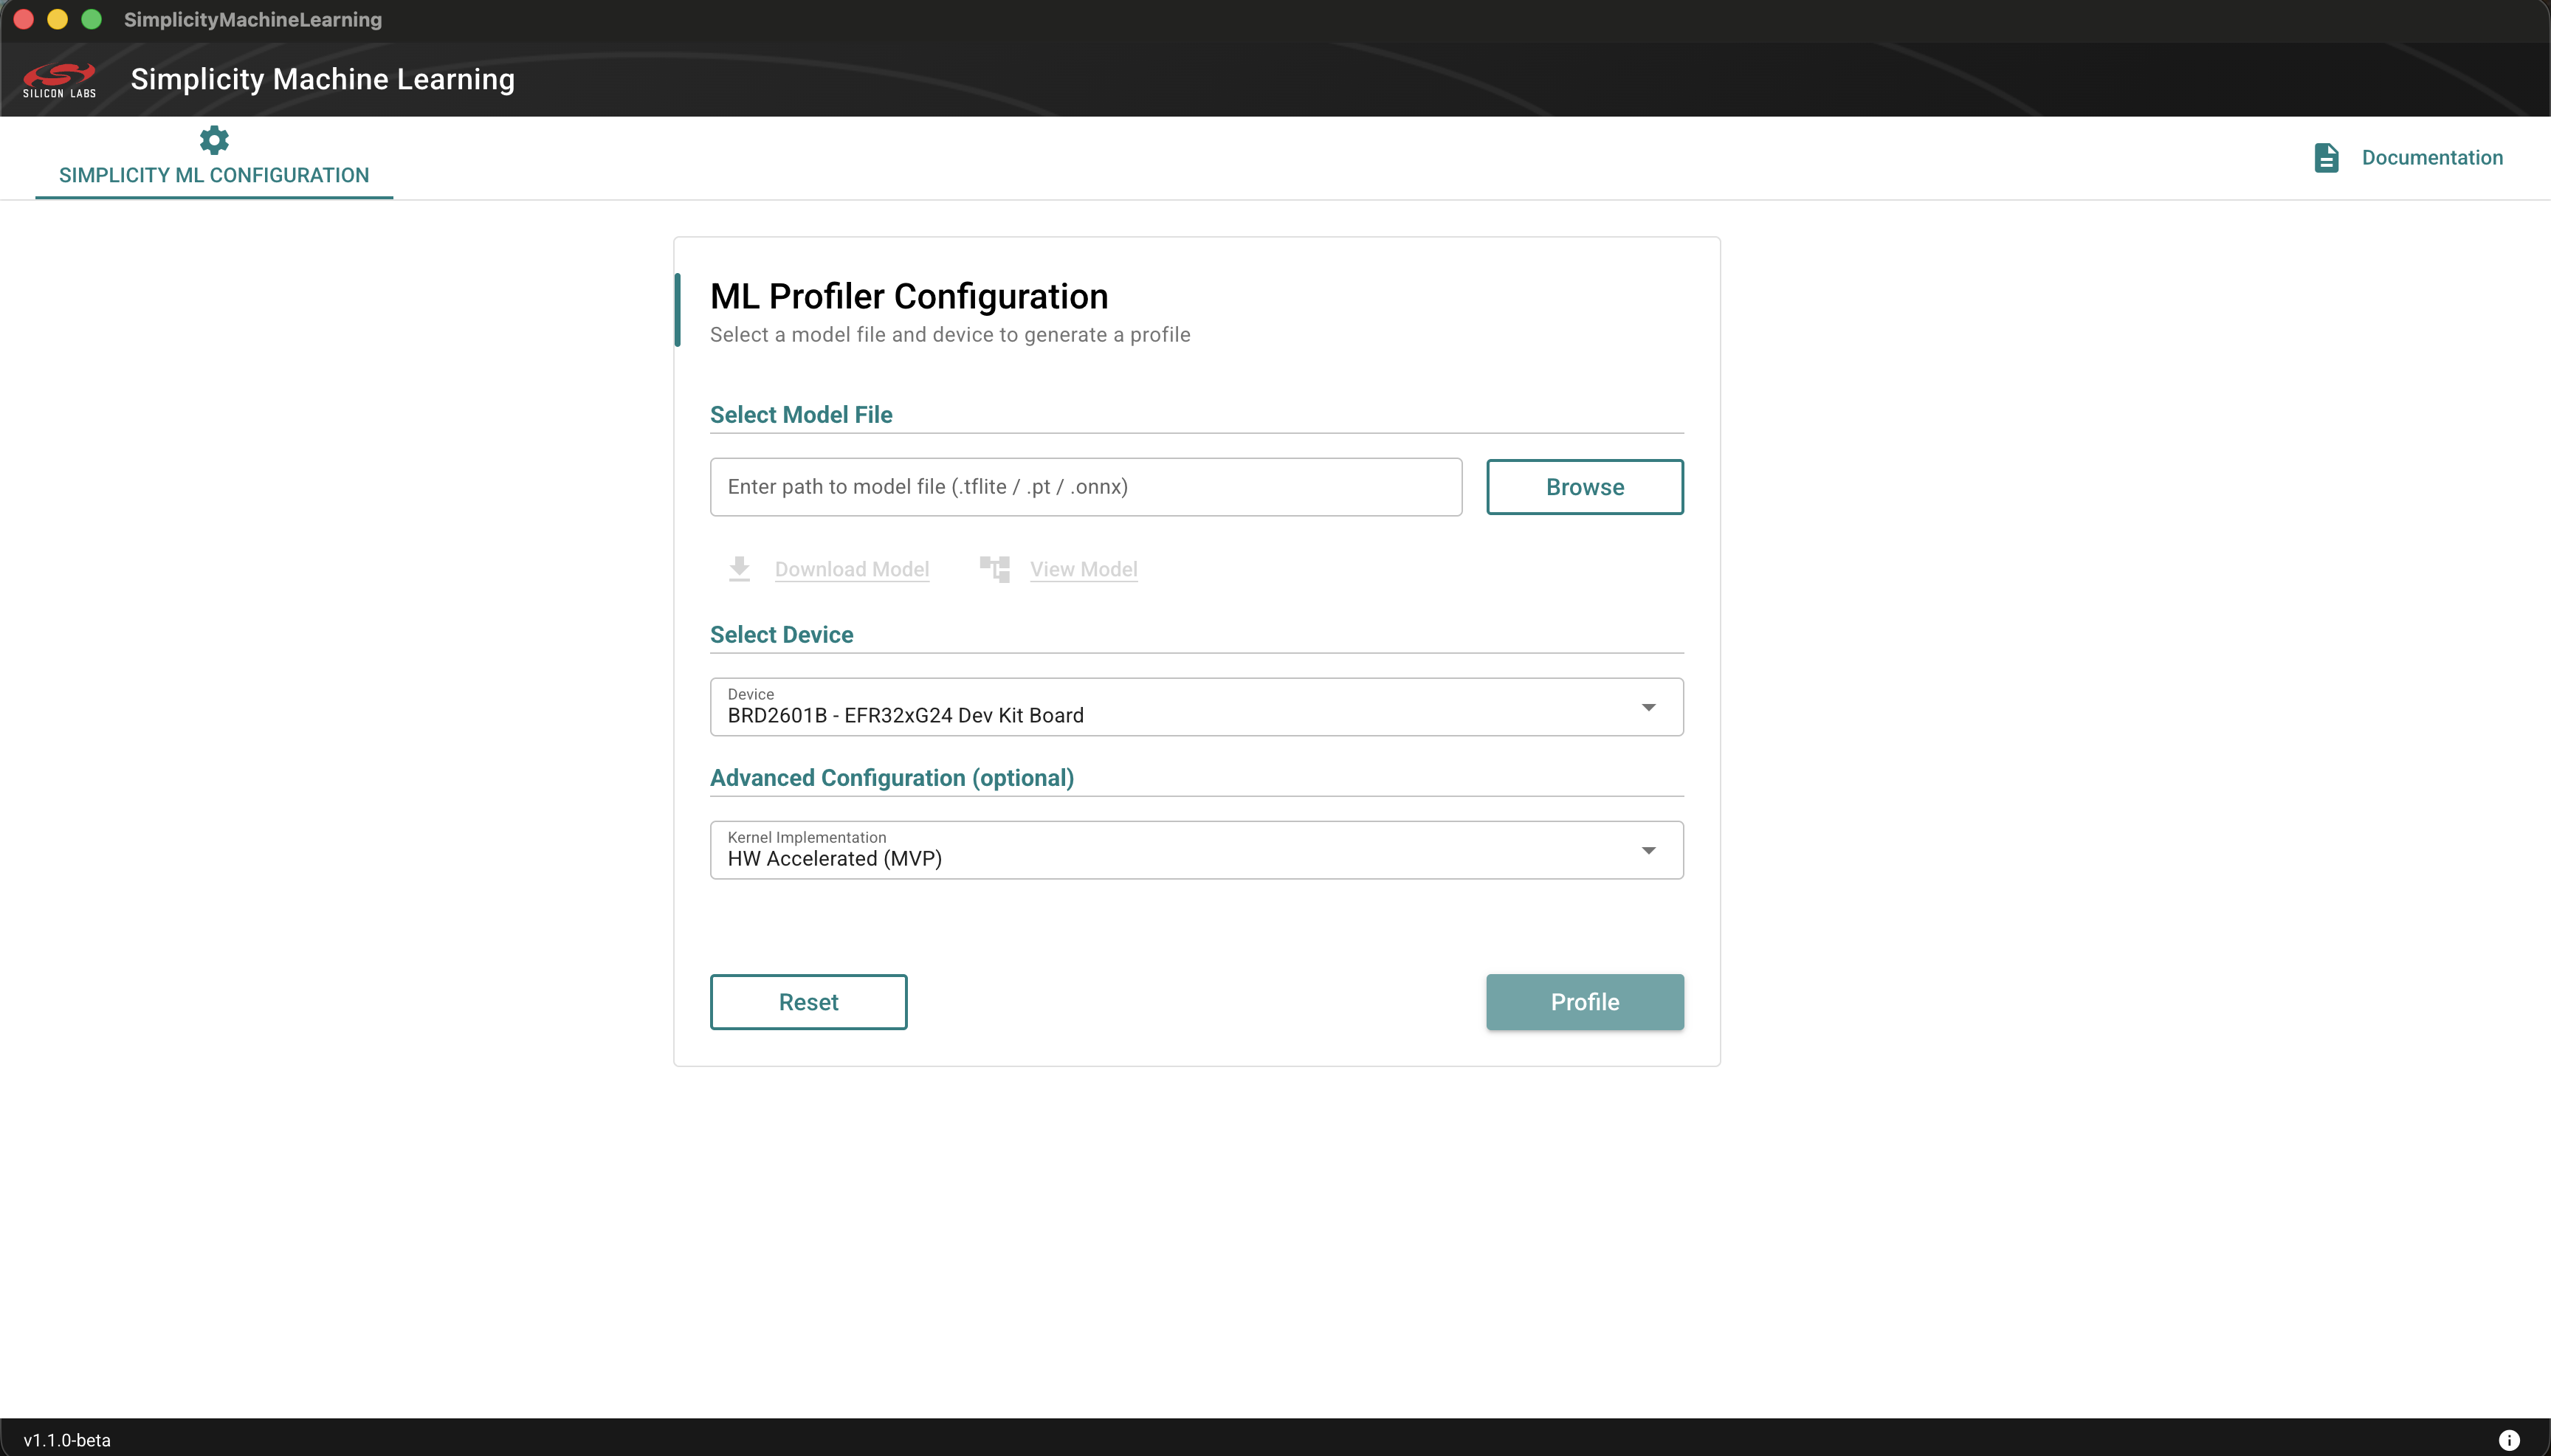
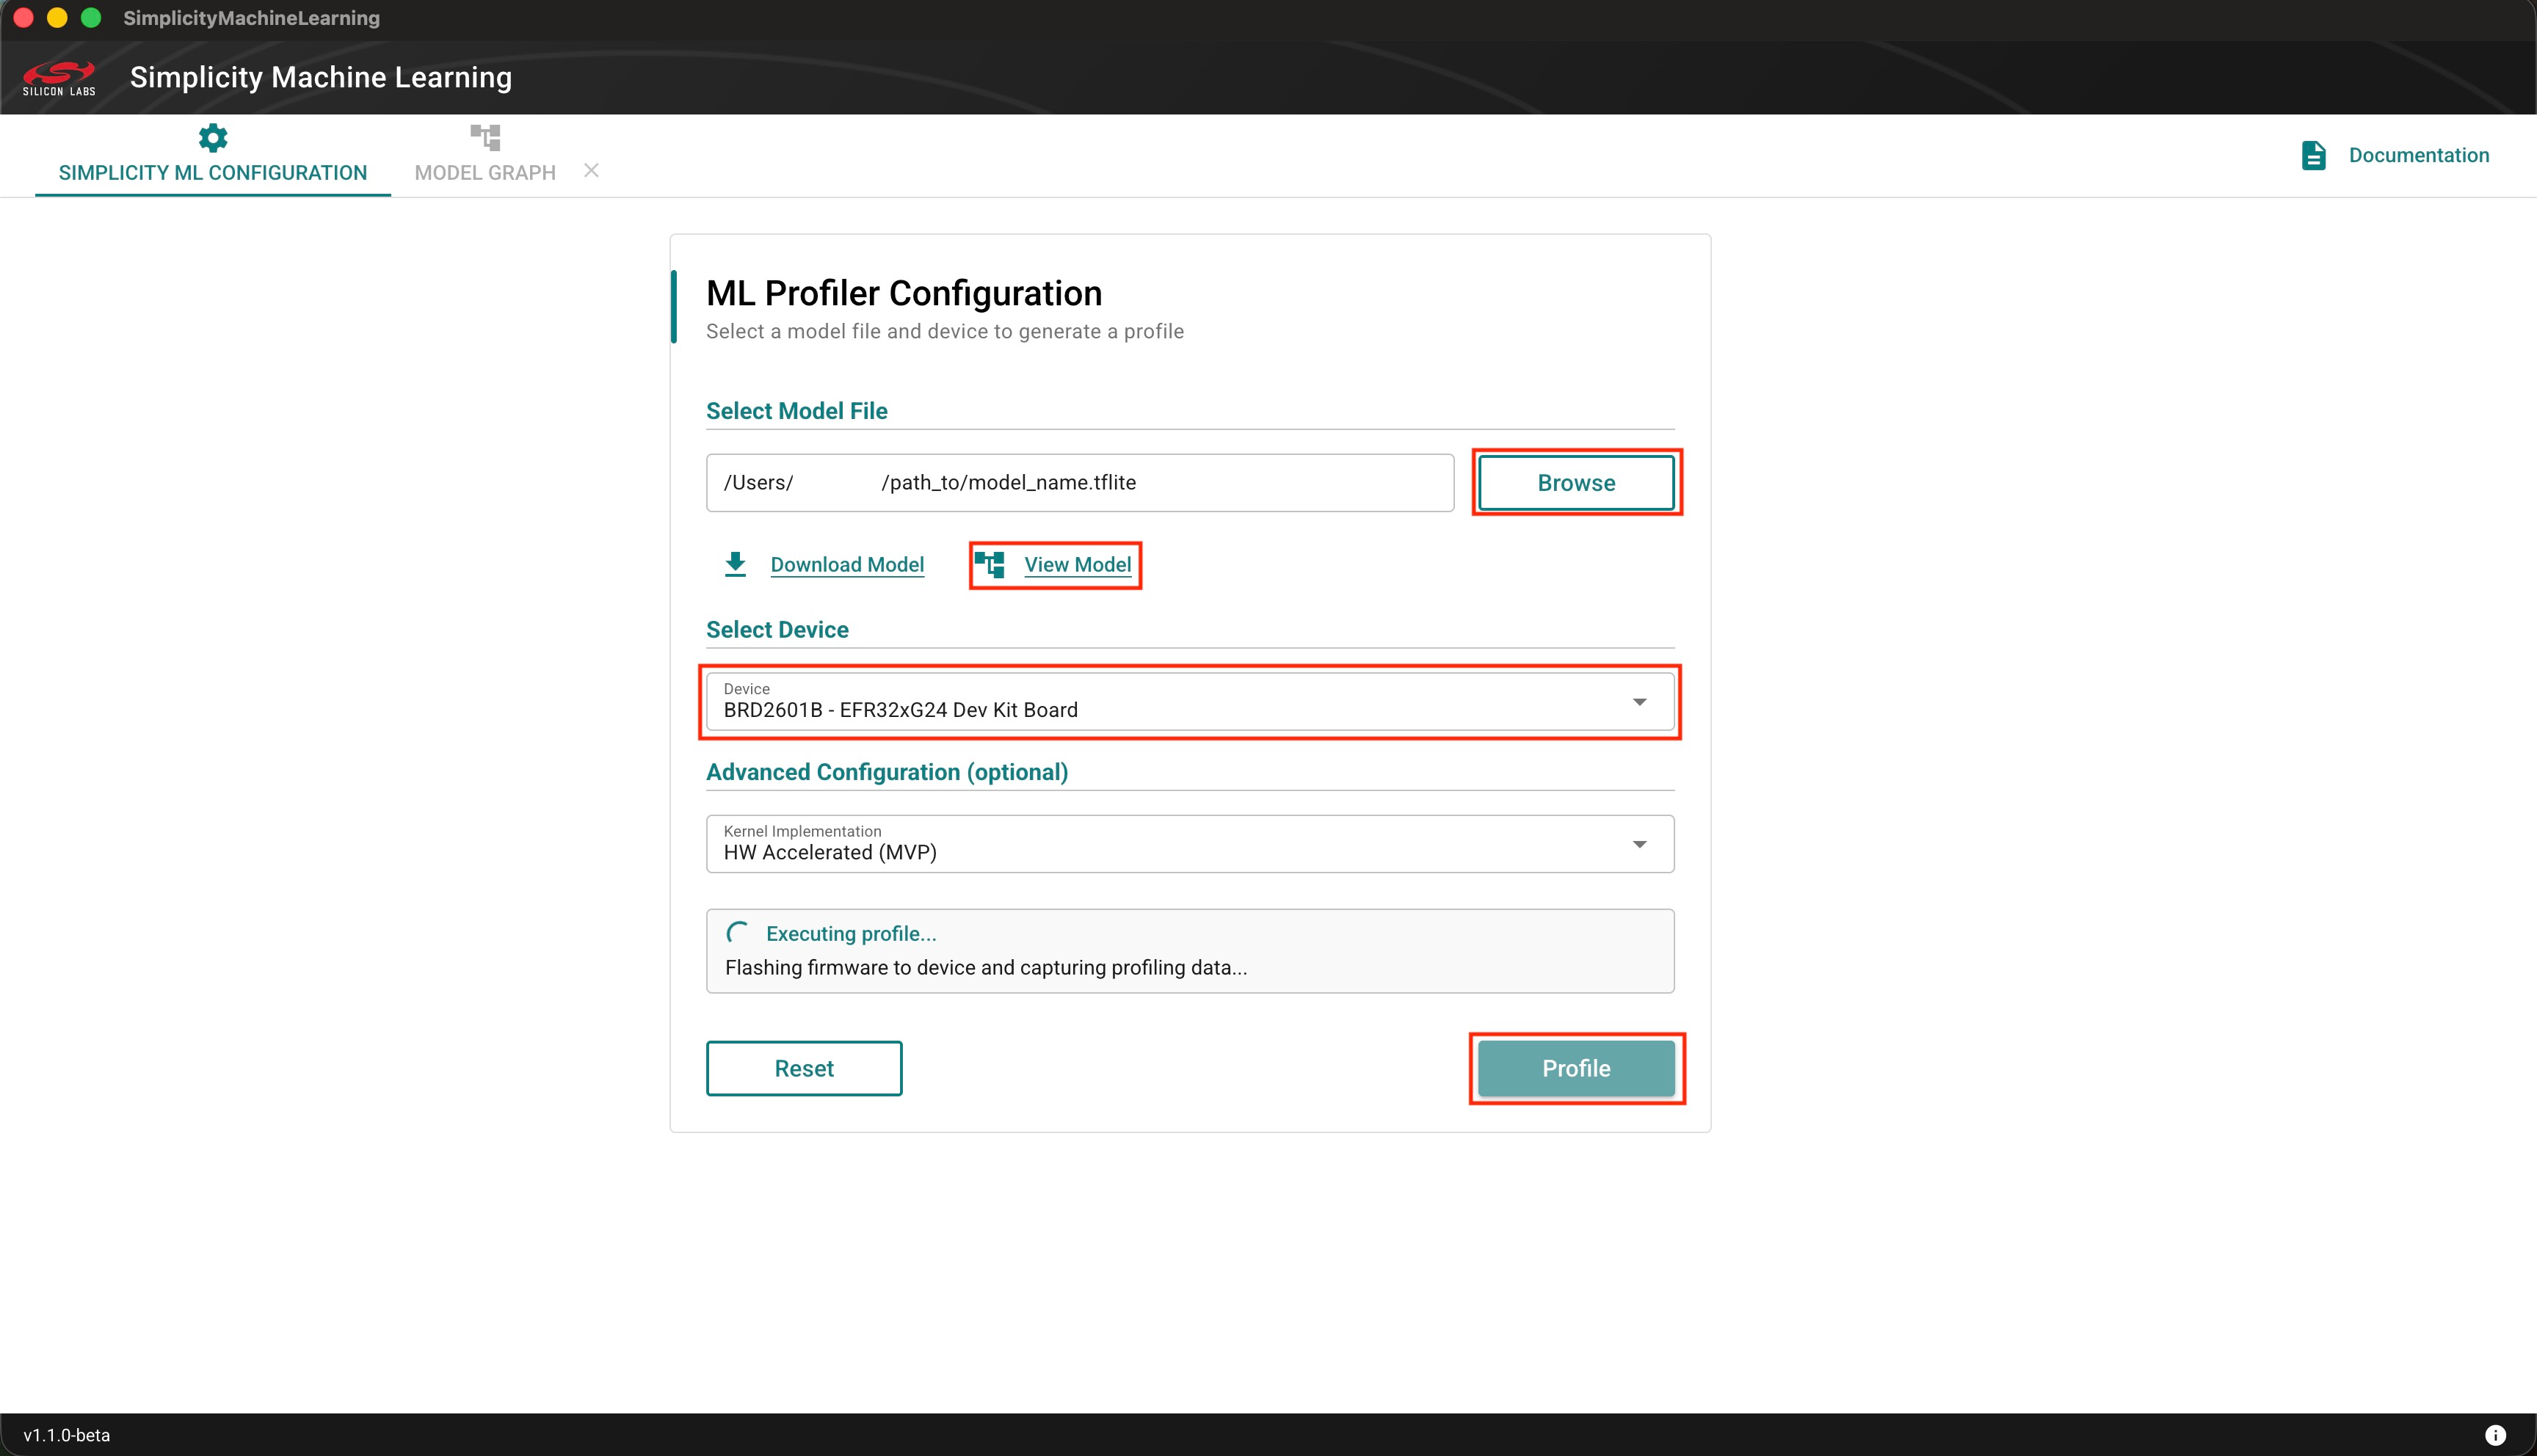
Click the Browse button, navigate to the folder that contains the model file, and then select the .tflite model to profile.
Optional. If your model is not available in the right format, you can convert PyTorch (
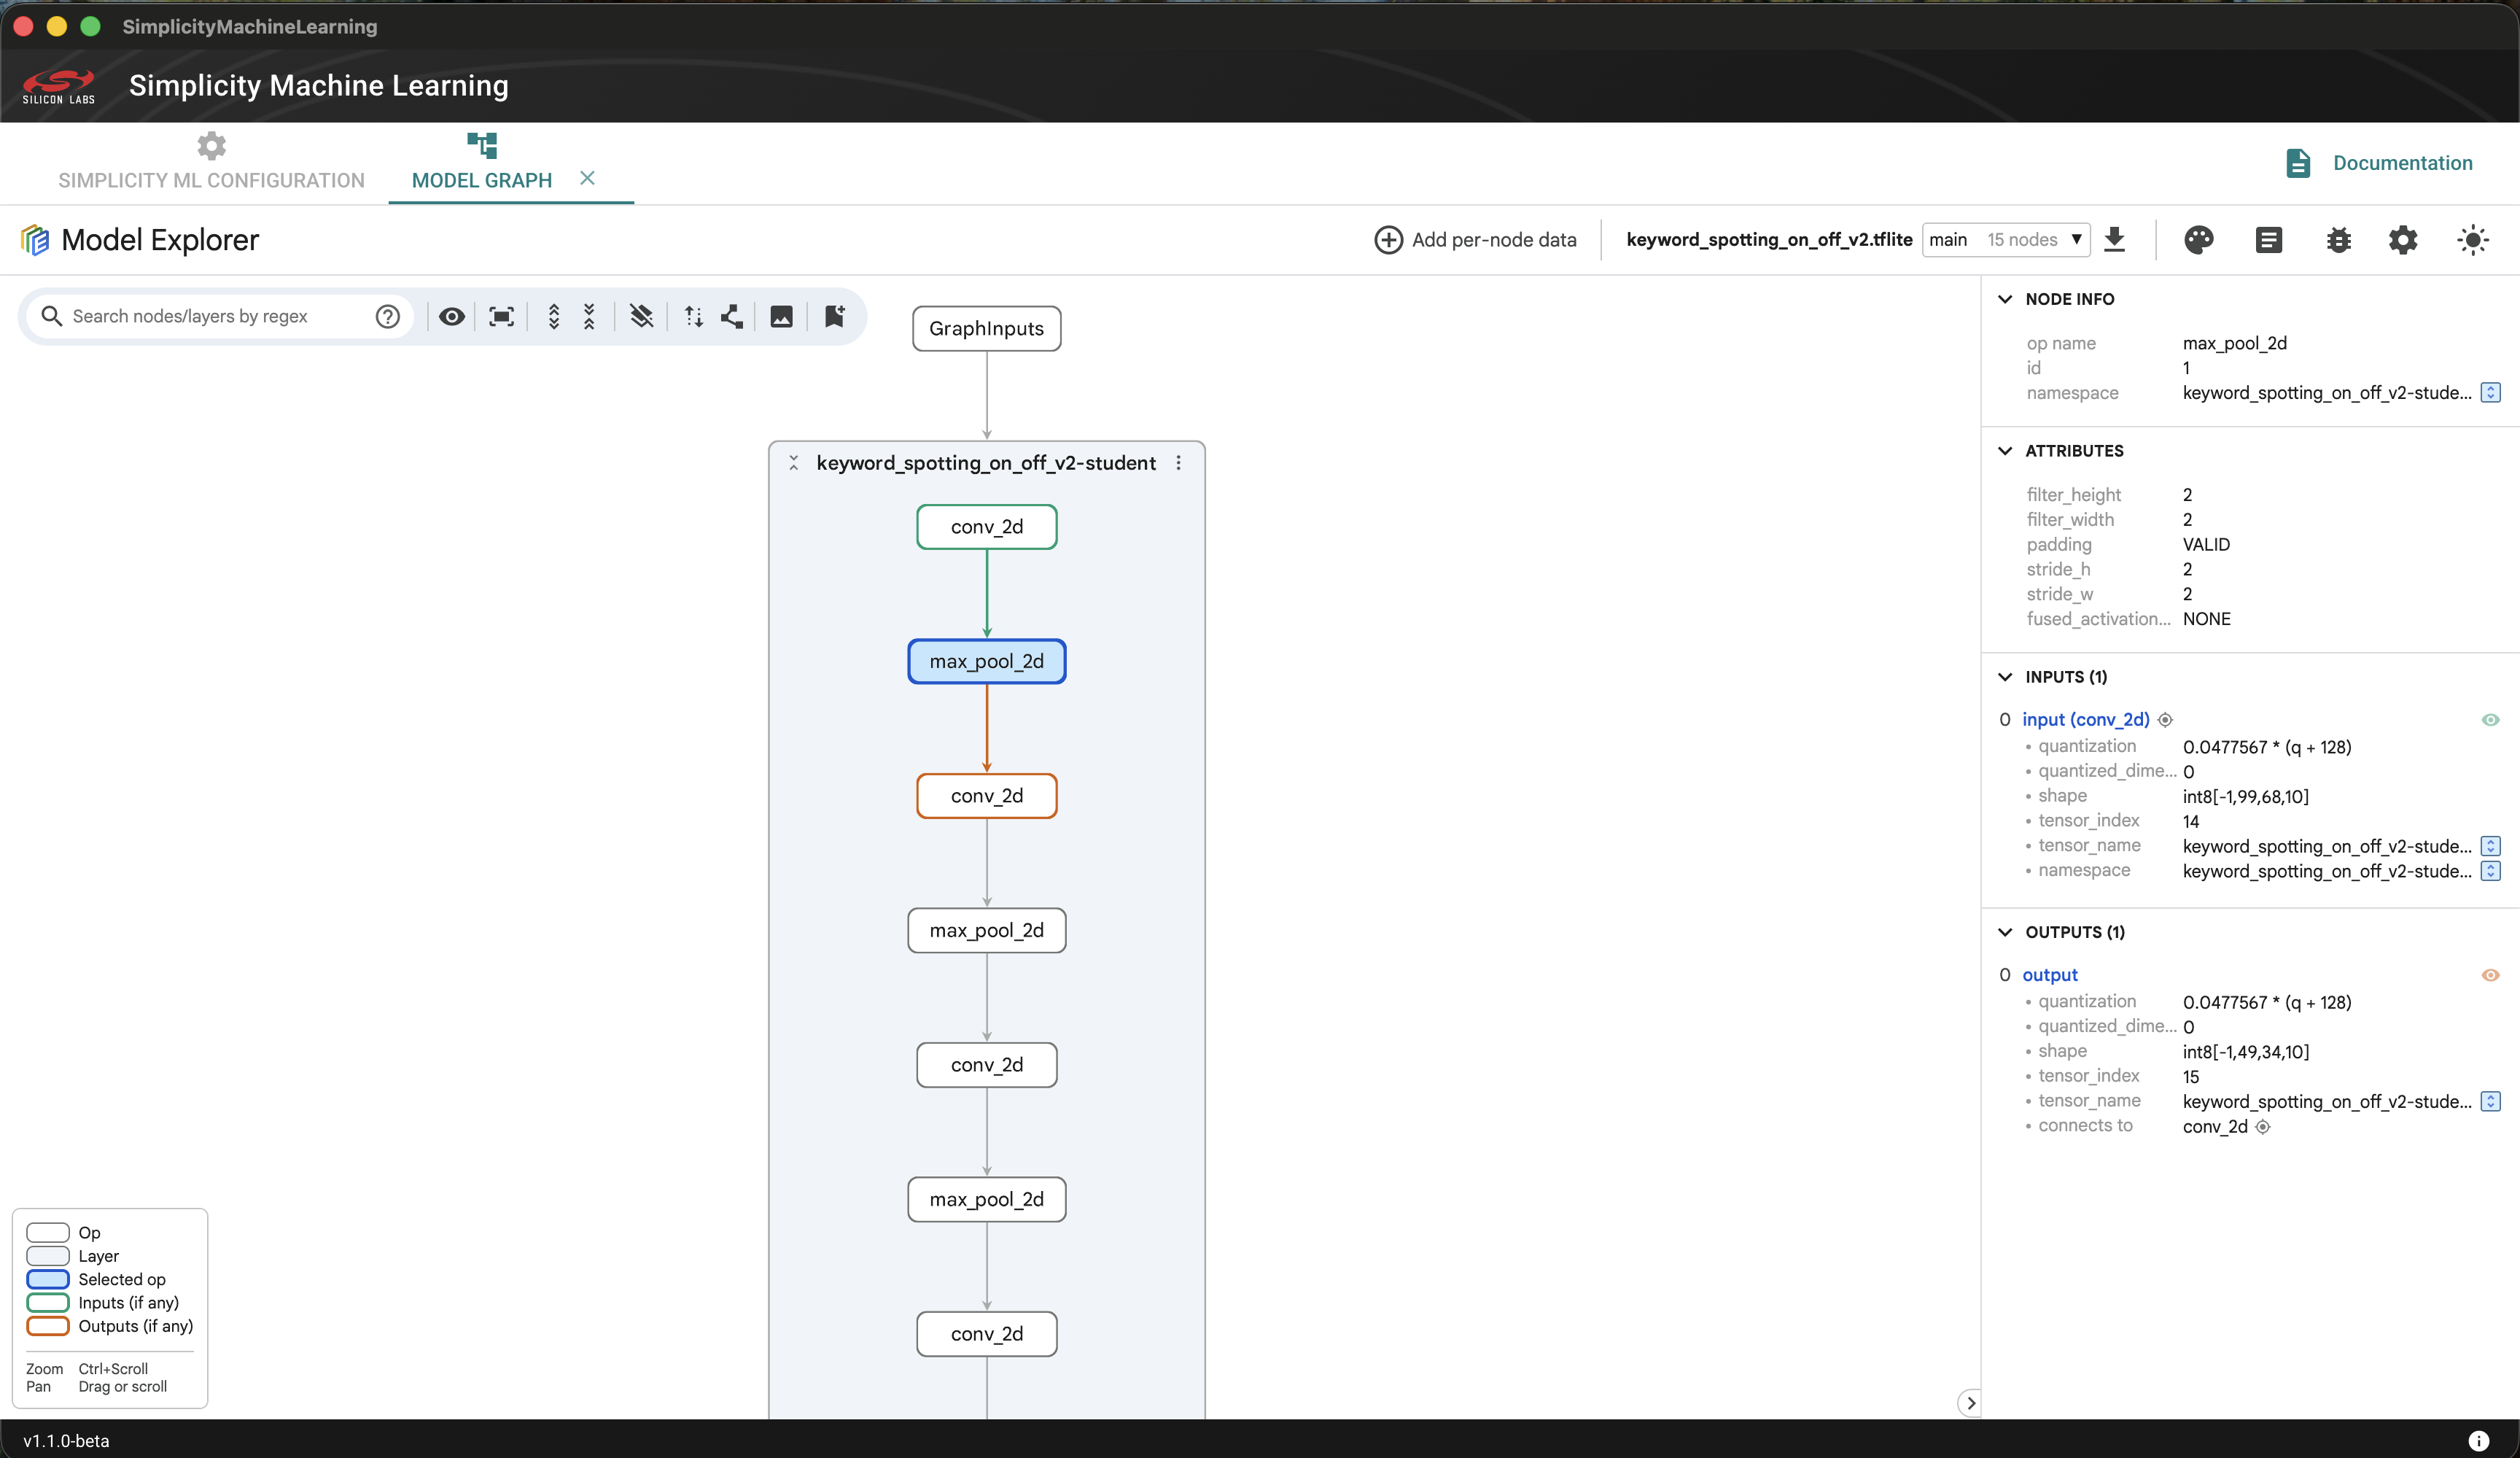
.pt,.pth) and ONNX (.onnx) to.tflitemodels. The process is detailed in the Silicon Labs sml Converter page.Optional. After you select the model, click View Model to view and analyze the model in detail.
Optional. Select the kernel implementation that you want to run. By default, the HW Accelerated kernels are selected.
Click the Profile Button.
NOTE: See Troubleshooting section for handling any errors.
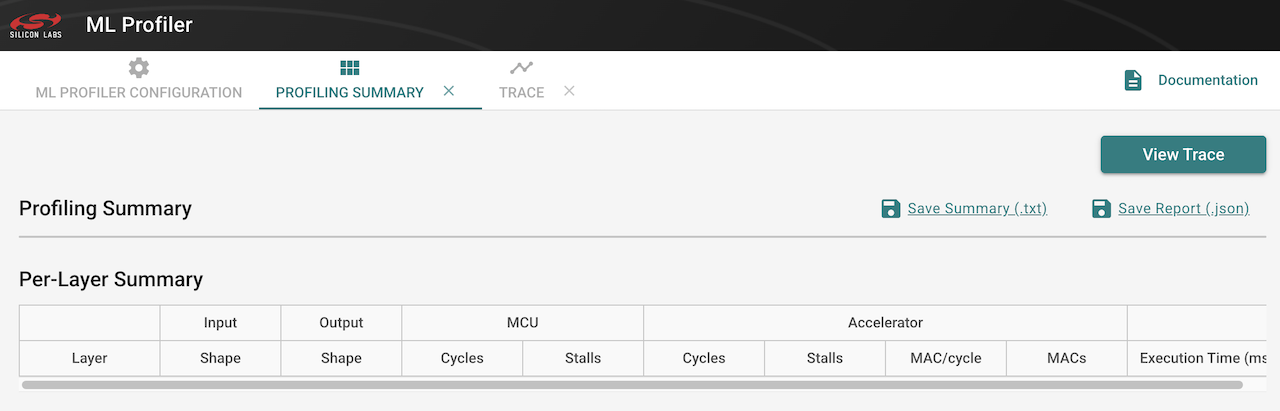
Outputs#
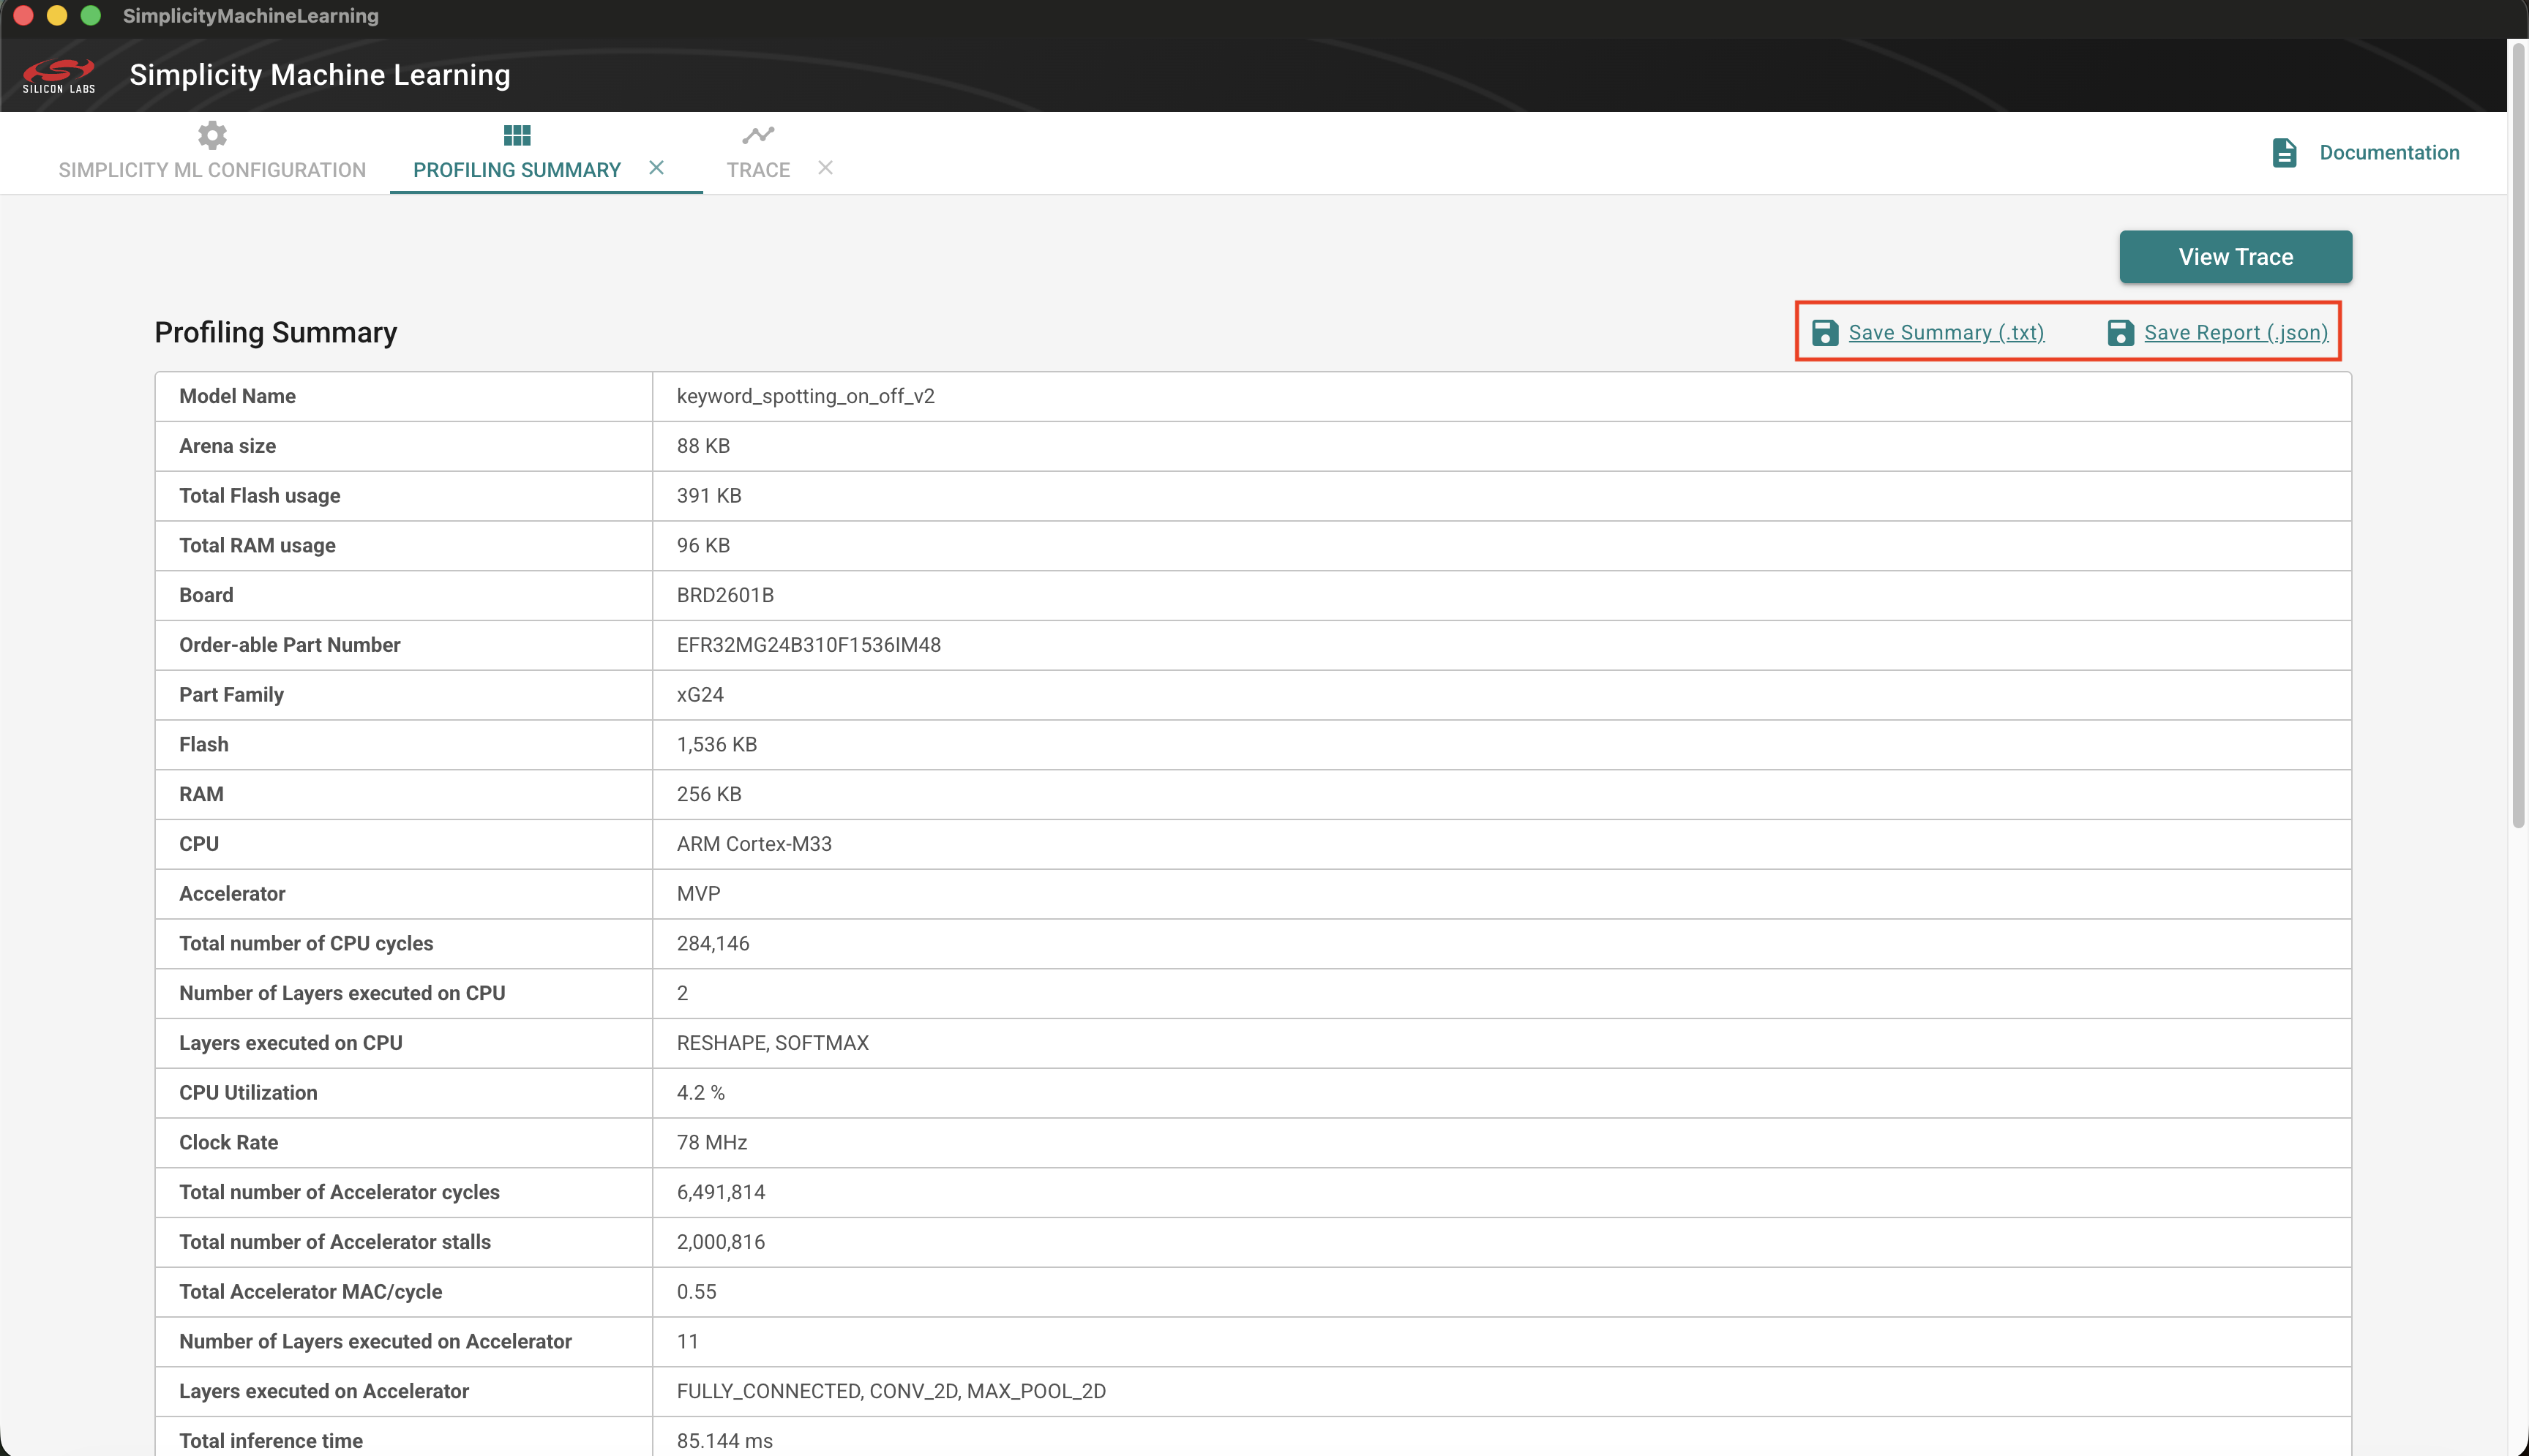
Summary tab includes:
Flash and RAM usage, CPU usage metrics, basic identification of the device
CPU and MVP accelerated cycle count, stalls, layer definitions
a way to export the data in either
.jsonor.txtformat.
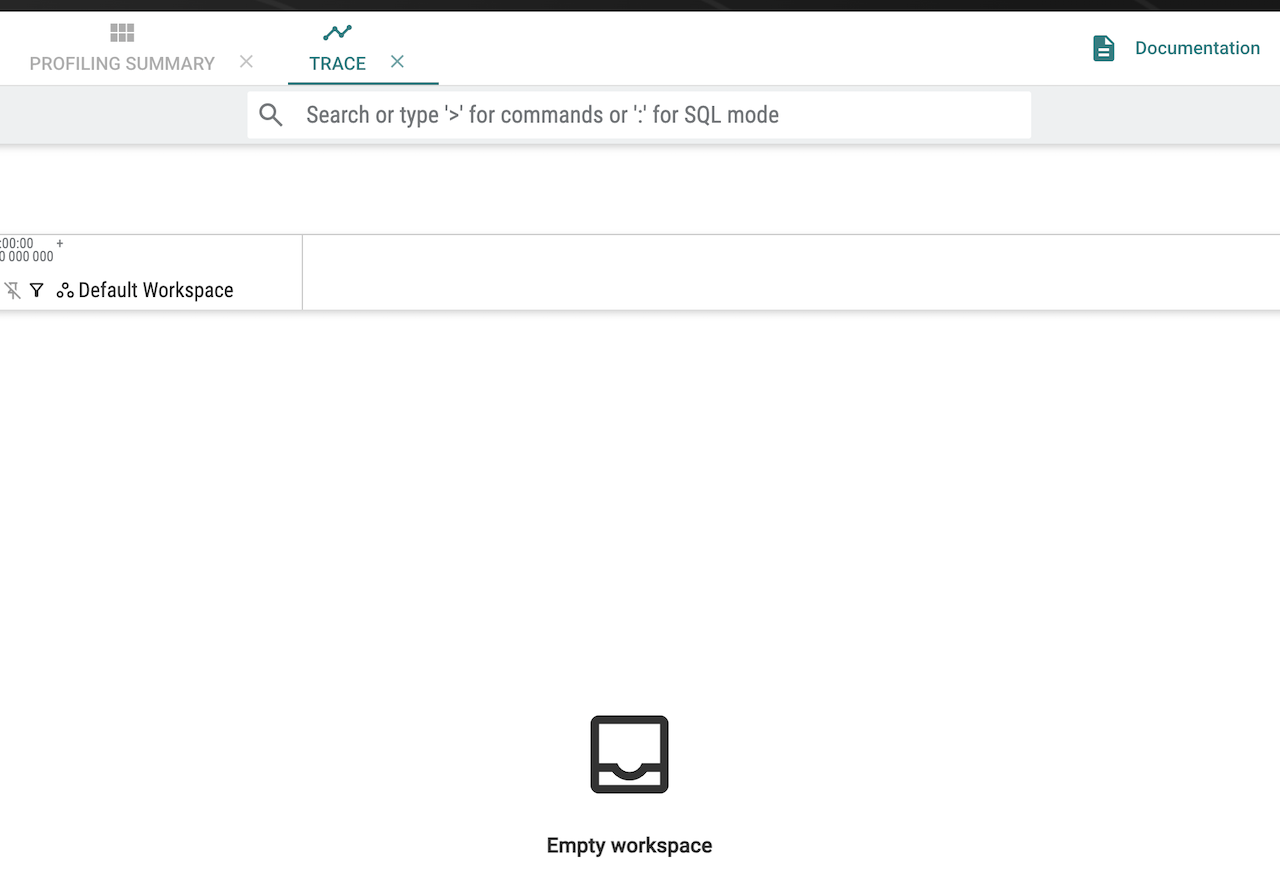
Perfetto trace tab: time-based execution and resource traces
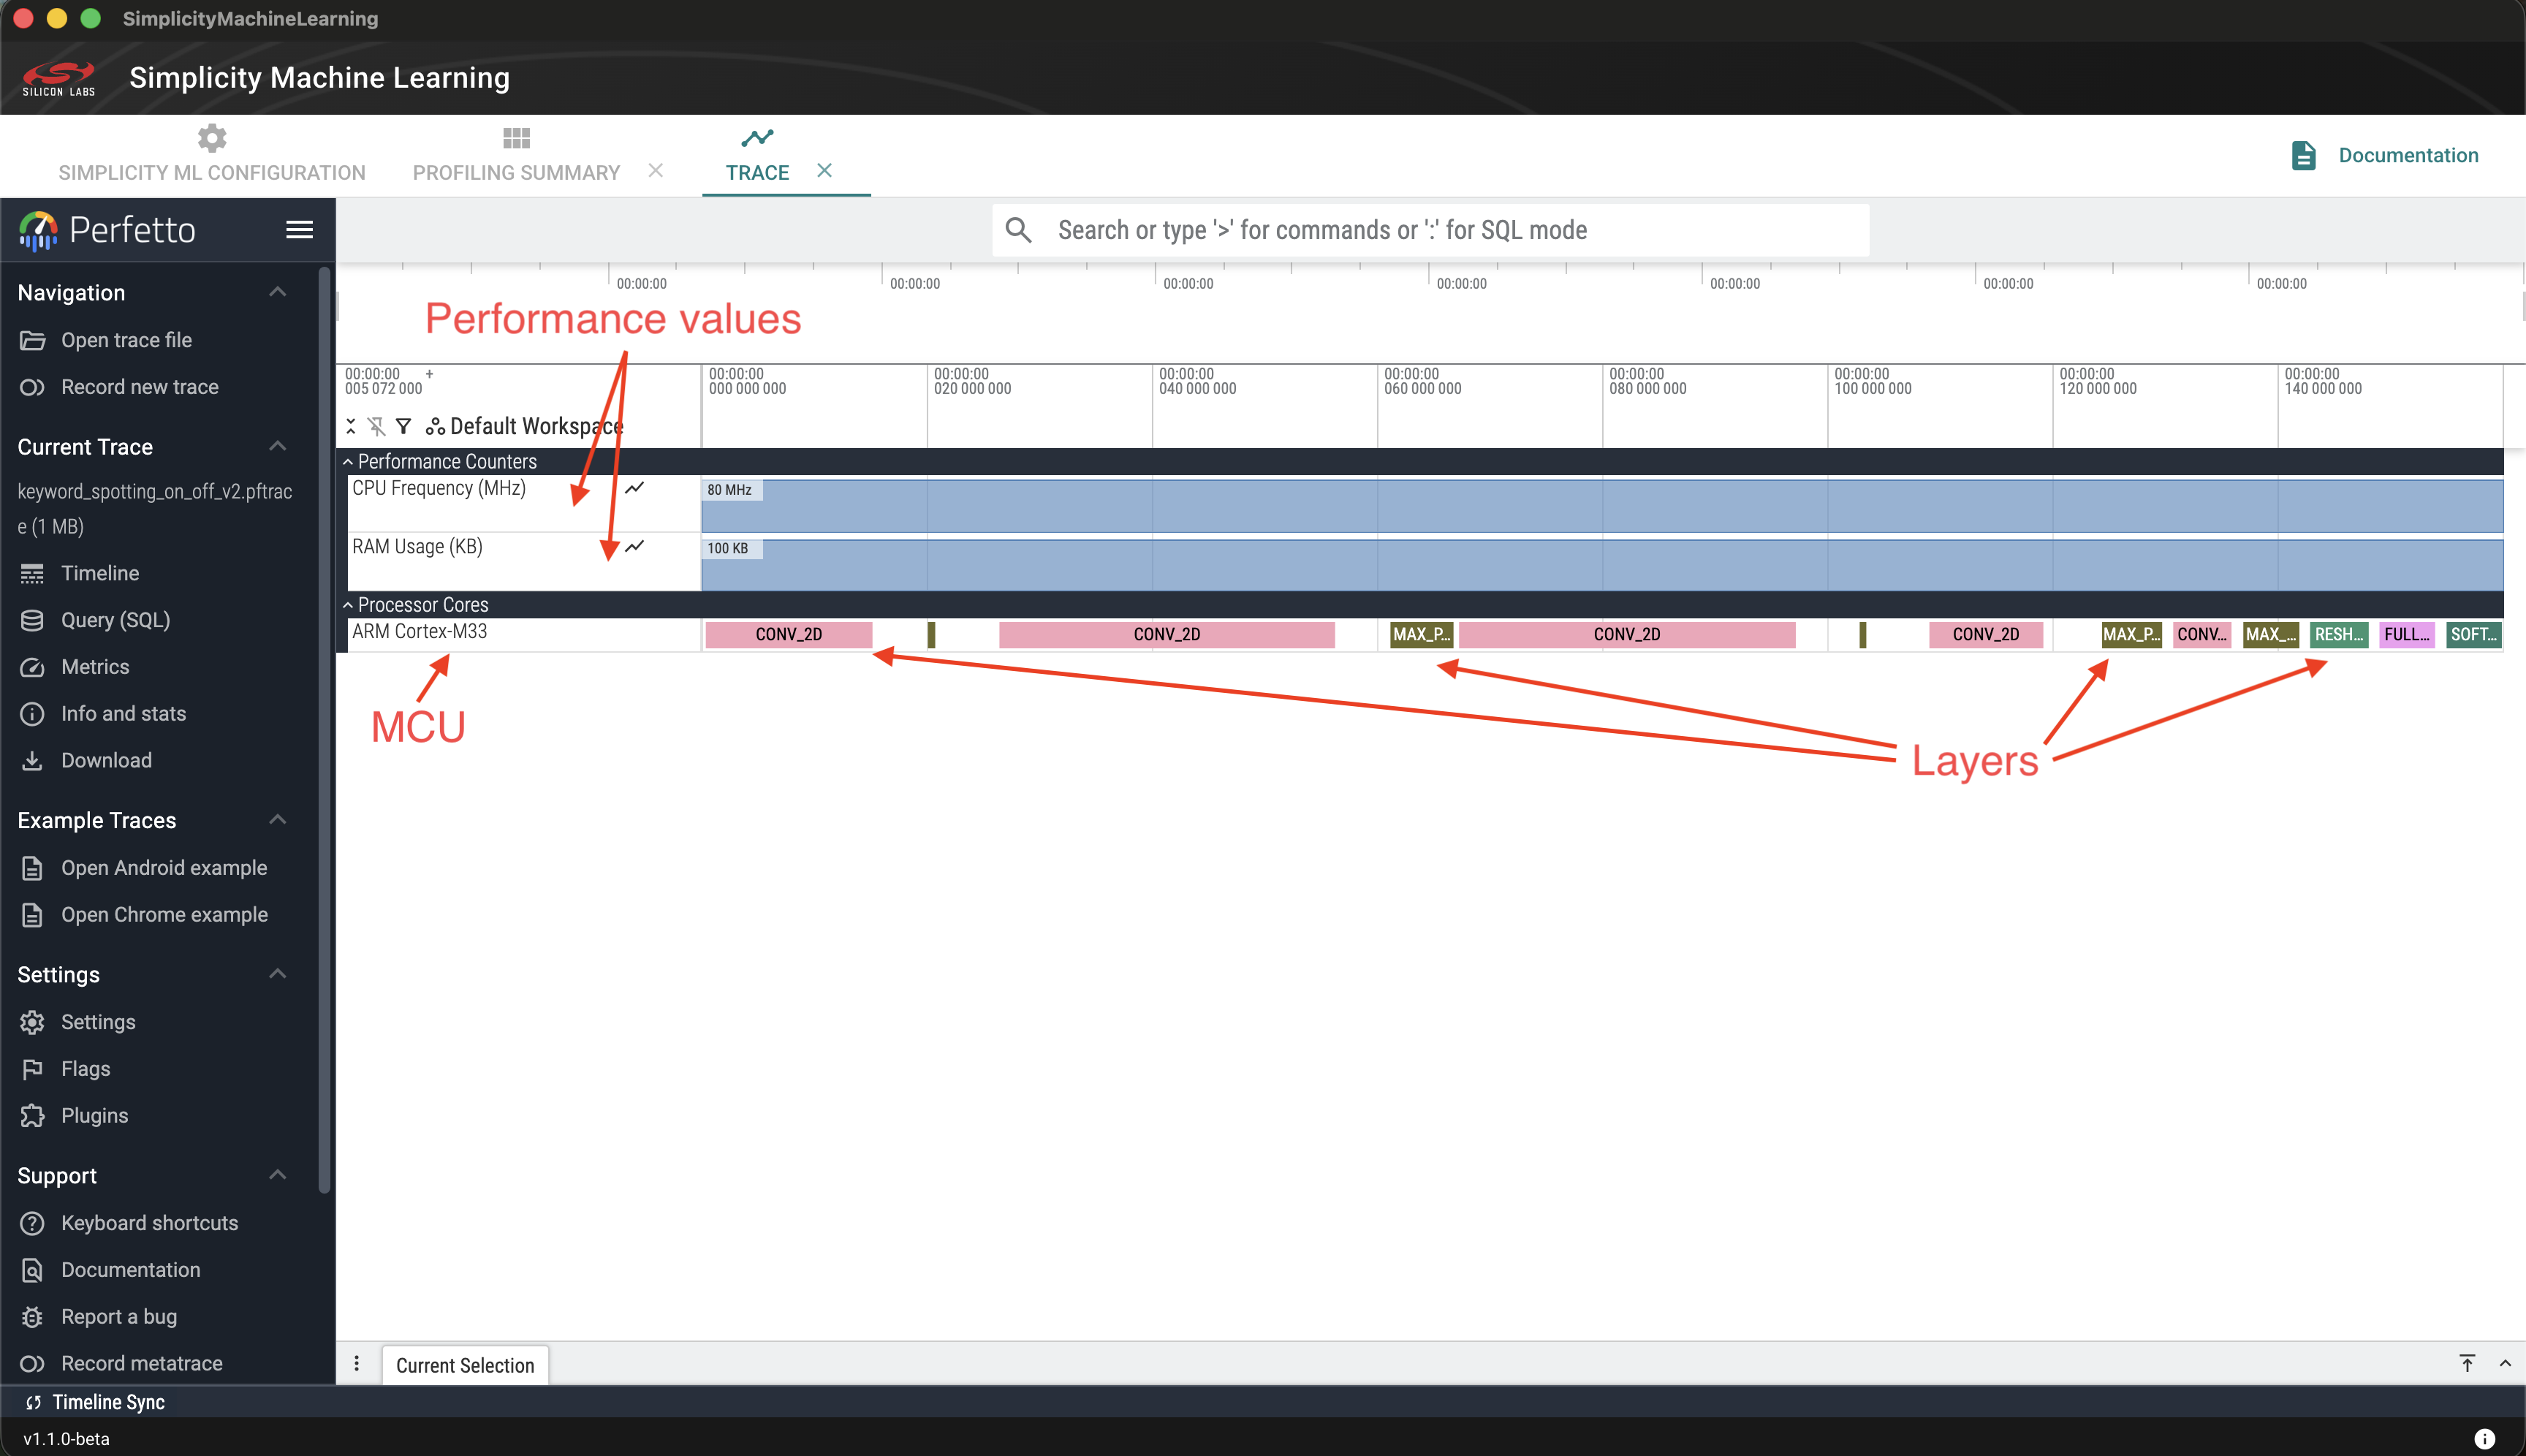
NOTE: The profiler currently tracks only the ARM Cortex‑M CPU processor timeline. Usage and cycle information for the Matrix Vector Processor (MVP) is instead provided in the summary tab.
Running a Profiling Session from the CLI#
Connect the board on which you want to profile your model. The board will be detected automatically, once connected.
Find the "device ID" of the connected board. This is optional if only one device is connected. The SDM will detect the connected device.
Linux/macOS
$ ~/.silabs/slt/installs/archive/sdm-darwin-arm64/sdm adapter list 👉 Total adapter count: 1 ↳ xxxxx [ usb wstk 440339411 xxxxx 127.0.0.1 ]Windows
PS> $HOME\.silabs\slt\installs\archive\sdm-windows-amd64\sdm.exe adapter list 👉 Total adapter count: 1 ↳ xxxxx [ usb wstk 440339411 xxxxx 127.0.0.1 ]The device ID is "440339411".
Run Profiling
sml profile /path/to/model_name.tflite 440339411NOTE: See Usage for more command line arguments. See Troubleshooting section for handling any errors.
Output#
The following is an example of the output you can expect to see on the command line terminal. Usernames and other sensitive information has been stubbed.
The log below includes:
Inference time
CPU vs MVP cycle breakdown
You can access:
text summary
detailed JSON report
🚀 Running profiling workflow...
Device: 440333937 (BRD2601B)
Model: keyword_spotting_on_off_v2
📡 Step 1: Connecting to debug channel...
⚡ Step 2: Combining model with firmware and flashing......
📦 Step 3: Capturing packets and generating trace...
╔══════════════════════════════════════════════════════════╗
║ ML PROFILER - PROFILING SUMMARY ║
╚══════════════════════════════════════════════════════════╝
SESSION SUMMARY
────────────────────────────────────────────────────────────
Model Name keyword_spotting_on_off_v2
Arena size 88.0 KB
Total Flash usage 391.0 KB
Total RAM usage 96.0 KB
Board BRD2601B
Order-able Part Number EFR32MG24B310F1536IM48
Part Family xG24
Flash 1,536 KB
RAM 256 KB
CPU ARM Cortex-M33
Accelerator MVP
Total number of CPU cycles 284,142
Number of Layers executed on CPU 2
Layers executed on CPU RESHAPE, SOFTMAX
CPU Utilization 4.2 %
Clock Rate 78.0 MHz
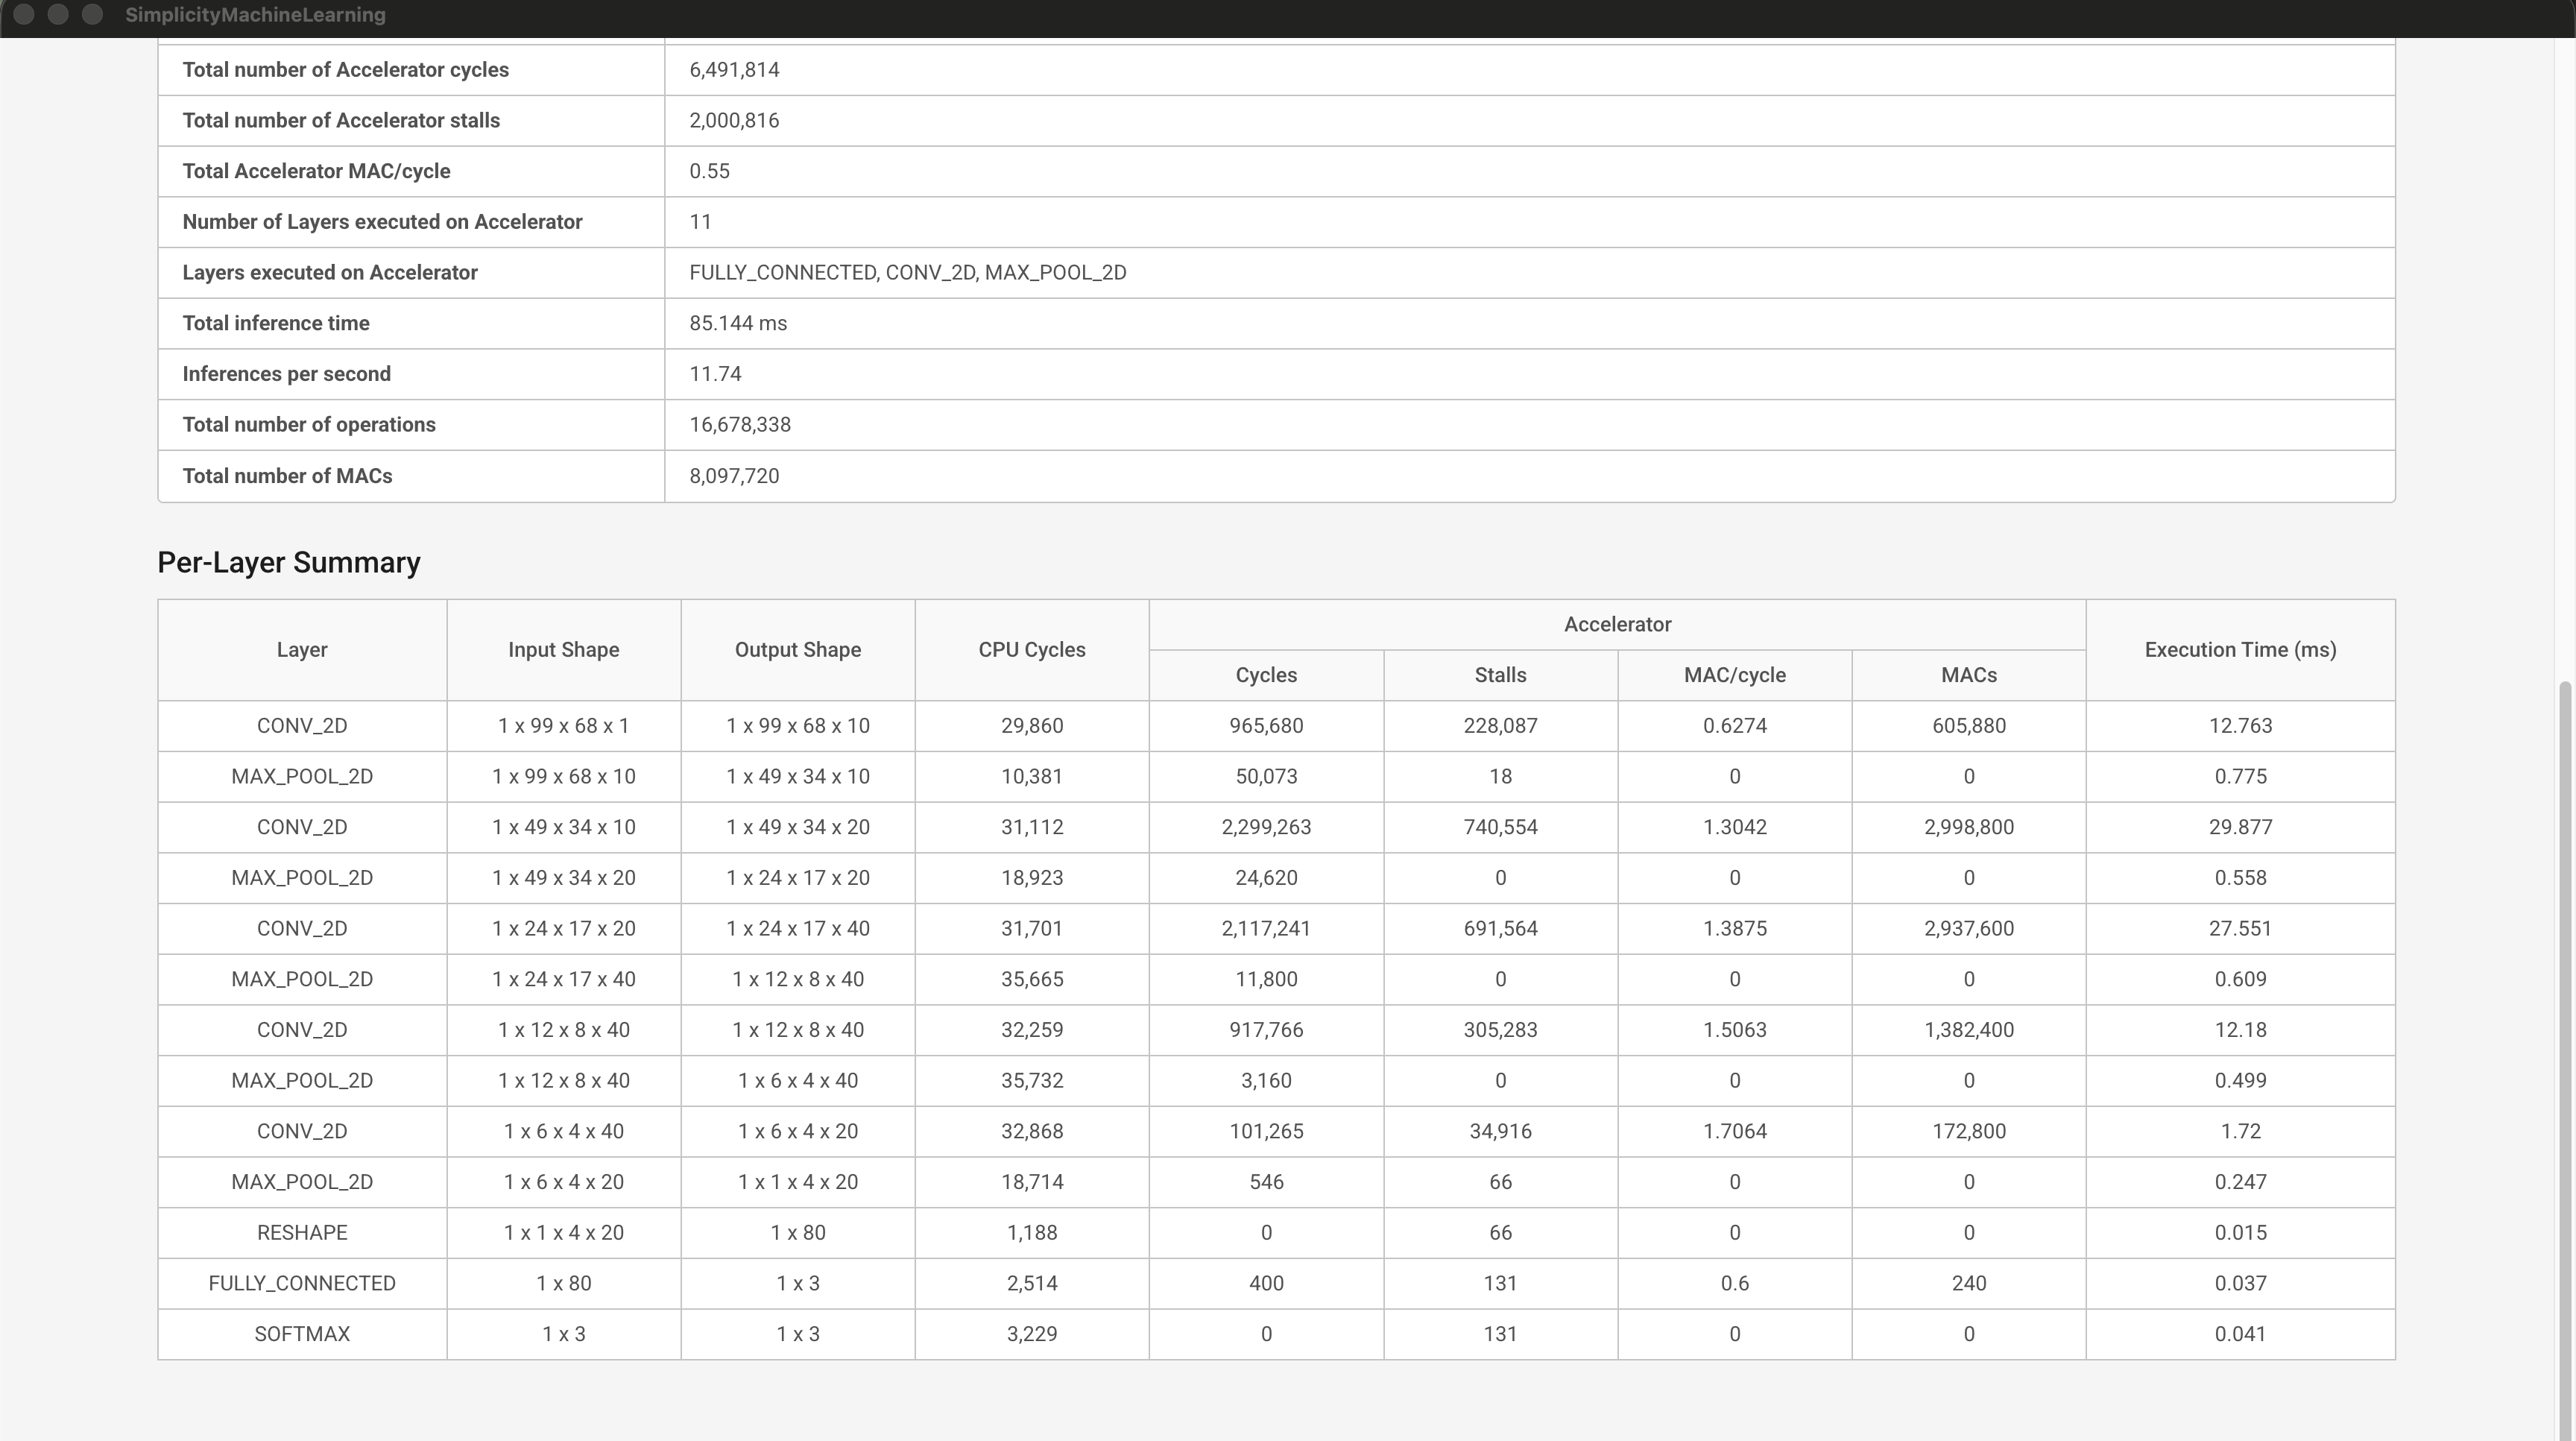
Total number of Accelerator cycles 6,491,814
Total number of Accelerator stalls 2,000,816
Total Accelerator MAC/cycle 0.55
Number of Layers executed on Accelerator 11
Layers executed on Accelerator MAX_POOL_2D, FULLY_CONNECTED, CONV_2D
Total inference time 85.144 ms
Inferences per second 11.74
Total number of operations 16,678,338
Total number of MACs 8,097,720
PER-LAYER SUMMARY
────────────────────────────────────────────────────────────────────────────────────────────────────────
| | | | Acc |
Layer | Input Shape | Output Shape | CPU Cycles | ----------------------- | Time(ms)
| | | | Cycles | Stalls |
-----------------+------------------+------------------+------------+------------+------------+---------
CONV_2D | 1 x 99 x 68 x 1 | 1 x 99 x 68 x 10 | 29,860 | 965,680 | 228,087 | 12.763
MAX_POOL_2D | 1 x 99 x 68 x 10 | 1 x 49 x 34 x 10 | 10,381 | 50,073 | 18 | 0.775
CONV_2D | 1 x 49 x 34 x 10 | 1 x 49 x 34 x 20 | 31,113 | 2,299,263 | 740,554 | 29.877
MAX_POOL_2D | 1 x 49 x 34 x 20 | 1 x 24 x 17 x 20 | 18,922 | 24,620 | 0 | 0.558
CONV_2D | 1 x 24 x 17 x 20 | 1 x 24 x 17 x 40 | 31,701 | 2,117,241 | 691,564 | 27.551
MAX_POOL_2D | 1 x 24 x 17 x 40 | 1 x 12 x 8 x 40 | 35,665 | 11,800 | 0 | 0.609
CONV_2D | 1 x 12 x 8 x 40 | 1 x 12 x 8 x 40 | 32,258 | 917,766 | 305,283 | 12.18
MAX_POOL_2D | 1 x 12 x 8 x 40 | 1 x 6 x 4 x 40 | 35,731 | 3,160 | 0 | 0.499
CONV_2D | 1 x 6 x 4 x 40 | 1 x 6 x 4 x 20 | 32,867 | 101,265 | 34,916 | 1.72
MAX_POOL_2D | 1 x 6 x 4 x 20 | 1 x 1 x 4 x 20 | 18,713 | 546 | 66 | 0.247
RESHAPE | 1 x 1 x 4 x 20 | 1 x 80 | 1,188 | 0 | 66 | 0.015
FULLY_CONNECTED | 1 x 80 | 1 x 3 | 2,514 | 400 | 131 | 0.037
SOFTMAX | 1 x 3 | 1 x 3 | 3,229 | 0 | 131 | 0.041
────────────────────────────────────────────────────────────────────────────────────────────────────────
────────────────────────────────────────────────────────────
Generated: DATE/TIMER
📁 Profile data saved to:
/$HOME/.silabs/sml/profiles/keyword_spotting_on_off_v2-2026-06-12T17-47-45Z
Includes:
• keyword_spotting_on_off_v2.pftrace (Perfetto trace)
• captured-packets.json (decoded packets)
• report.json (profiling data)
• summary.txt (readable summary)
📄 See summary.txt for the complete profiling summary.
✅ Profiling completed successfully!
📊 To view the trace, open the following file in https://ui.perfetto.dev/ , or re-run with --gui to open it automatically.
Trace file: /$HOME/.silabs/sml/profiles/keyword_spotting_on_off_v2-2026-06-12T17-47-45Z/keyword_spotting_on_off_v2.pftraceNOTE: If the --gui flag is provided the Perfetto trace will open in a window.
Usage#
sml --help Usage: sml [OPTIONS] COMMAND [ARGS]...
Silicon Labs ML tooling.
╭─ Options ─────────────────────────────────────────────────────────────────────╮
│ --gui Open GUI after command completes (if supported). │
│ --dry-run Validate and print the effective configuration, │
│ but do not execute the command. │
│ --log-level TEXT Logging verbosity. One of: error, warning, info, │
│ debug. │
│ [default: info] │
│ --version -v Show version and exit. │
│ --help Show this message and exit. │
╰───────────────────────────────────────────────────────────────────────────────╯
╭─ Commands ────────────────────────────────────────────────────────────────────╮
│ profile Profile a machine learning model on a Silicon Labs device. Emits a │
│ Perfetto-compatible trace (.pftrace) or JSON summary (.json). │
│ convert Convert a PyTorch (.pt / .pth) or ONNX (.onnx) model to TFLite. │
│ version Show the version number. │
╰───────────────────────────────────────────────────────────────────────────────╯sml profile --help Usage: sml profile [OPTIONS] MODEL [DEVICE]
Profile a machine learning model on a Silicon Labs device. Emits a
Perfetto-compatible trace (.pftrace) or JSON summary (.json).
╭─ Arguments ──────────────────────────────────────────────────────────────────╮
│ * model TEXT Path to model file (e.g. .tflite). Use '-' to │
│ read from stdin. │
│ [required] │
│ device [DEVICE] Device identifier: Device ID, serial number, │
│ nickname, or IP address (on-device profiling). If │
│ omitted, the only supported connected device is │
│ used. │
╰──────────────────────────────────────────────────────────────────────────────╯
╭─ Options ────────────────────────────────────────────────────────────────────╮
│ --output -o TEXT Output directory for all profiling results files. If │
│ omitted, outputs to │
│ ~/.silabs/sml/profiles/<model>-<timestamp>/. │
│ --kernel TEXT Kernel implementation to use. Accelerated kernels │
│ are chosen based on the value of device. │
│ [default: accelerated] │
│ --help Show this message and exit. │
╰──────────────────────────────────────────────────────────────────────────────╯Understanding Performance#
The profiler presents a hierarchical execution view:
Inference → Layer → Operator → Kernel
Time-aligned tracks allow correlation between:
CPU vs MVP execution
memory usage
clock rate
Idle time per kernel helps identify when:
accelerator overhead dominates
memory stalls occur
CPU execution may be more efficient
Limitations#
Requires real Silicon Labs hardware, currently only supports xG24, xG26, and xG28 devices, specifically BRD2601B, BRD2608A, and BRD2705A dev kits and BRD2505A, BRD2506A, BRD4186C and BRD4187C boards.
Simulator support is in development
Does not auto-compare CPU vs MVP
Does not measure model accuracy. This is not a target of this tool. It is geared exclusively towards execution performance analysis.
Summary#
The Simplicity Machine Learning Profiler helps you analyze embedded ML performance by making execution behavior visible, comparable, and intuitive.
Troubleshooting#
"SDM Service is not available" warning#
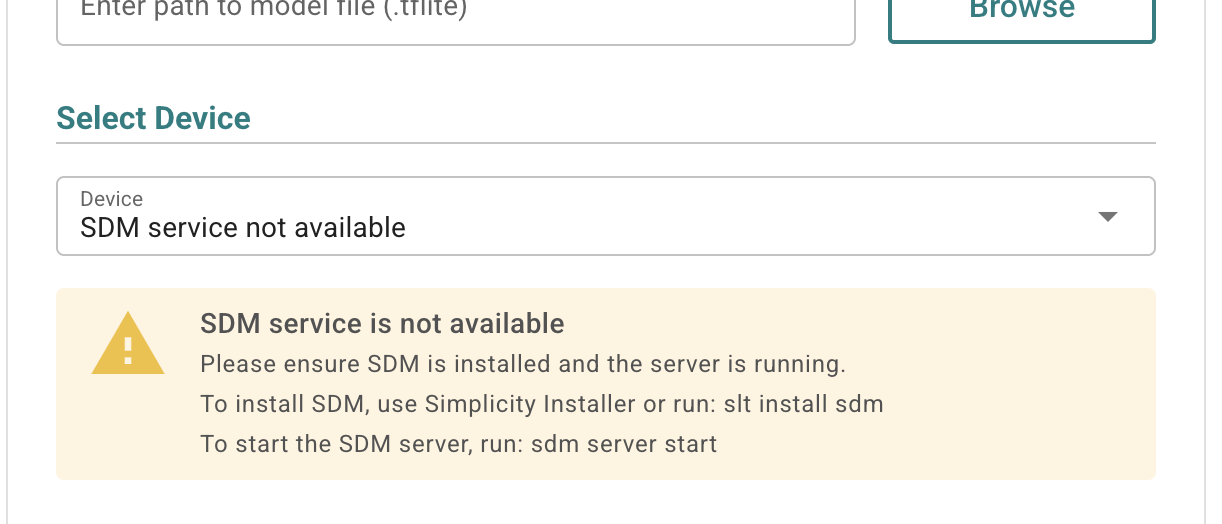
Solution#
Verify if Simplicity Device Manager (SDM) is installed using,
slt locate sdm.If you see no output on the console, install SDM using:
slt install sdmthrough the CLI, orSimplicity Installer by following the steps mentioned in the Install using Simplicity Installer section. Search for "Simplicity Device Manager" instead of "Simplicity Machine Learning".
Start SDM server.
Linux/macOS
~/.silabs/slt/installs/archive/sdm-darwin-arm64/sdm server startWindows
PS> $HOME\.silabs\slt\installs\archive\sdm-windows-amd64\sdm.exe server start
"No devices connected" message in the "Select Device" field#
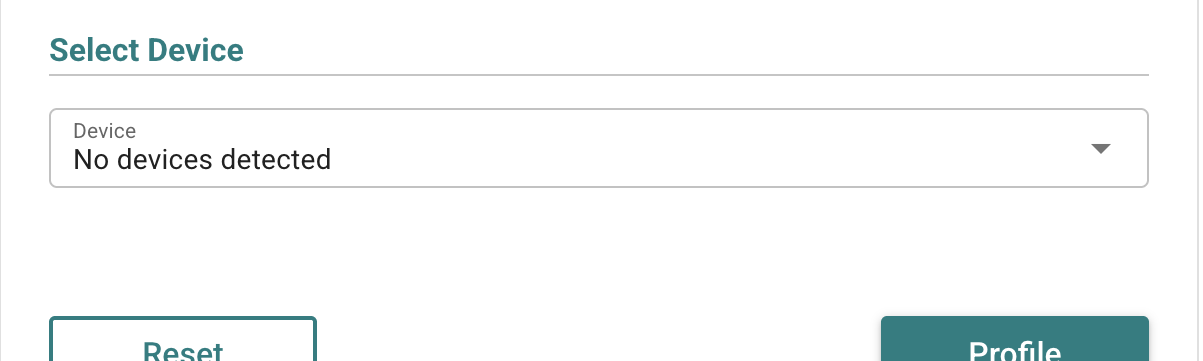
Solution#
Connect the desired board on which you want to profile your models.
Any type of "Firmware preparation/flashing failed: Failed to combine model with firmware" error#
Examples of this type of error:
Firmware preparation/flashing failed: Failed to combine model with firmware: 404 Not Found: Not Found
Firmware preparation/flashing failed: Failed to combine model with firmware: Combine binary job failed: Error: Could not find function simpleCombineConvertBinaries. It is either typed wrong, you miss an adapter pack, or you need to upgrade one.
Solution#
This issue is most commonly caused due to an older version of either Simplicity Device Manager or Simplicity Commander.
Update Simplicity Commander to v1.22+. Install using
slt install commander. Verify usingslt locate commander.Update Simplicity Device Manager to v0.101.4+. Install using
slt install sdm. Verify usingslt locate sdm.
No Profiling Output#
GUI
CLI
📦 Step 3: Capturing packets and generating trace...
Captured 43 packets, building trace...
Decoded 0 packets, generated 0 trace events
╔══════════════════════════════════════════════════════════╗
║ Simplicity Machine Learning - PROFILING SUMMARY ║
╚══════════════════════════════════════════════════════════╝
────────────────────────────────────────────────────────────Solution#
Verify Simplicity Device Manager Service is up:
sdm server status. If not, invokesdm server start.Find the device ID, see Running a Profiling Session From the CLI section.
Jump into admin console of your device:
sdm terminal -a <device_id> -c admin.Verify the debug message version:
dch message version, If the output isMessage protocol version : 3, use Step 5 below.Invoke
dch message version 2. The output must showCurrent version = 2.Execute a Profiling session again.