


Build, Flash, or Debug a Project#
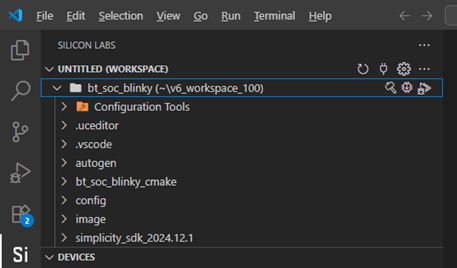
In the Si extension view, hover over your project to reveal the following action buttons:
Build: Compiles your project
Flash: Programs your target device
Debug: Launches the debugger
Use the Run and Debug View#
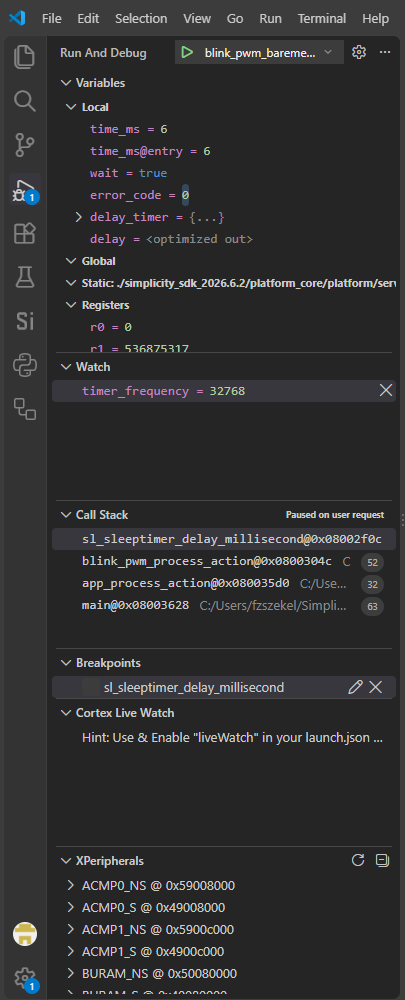
To start a debug session, select Debug in your project. VS Code opens the Run and Debug view. You can also open this view by selecting Run and Debug (the play-and-bug icon) in the Activity Bar or by using the keyboard shortcut Ctrl+Shift+D on Windows and Linux or Cmd+Shift+D on macOS.
Variables: Displays local and global variables available in the current debug session. To inspect local variables in a different stack frame, select that frame in Call Stack.
Watch: Evaluates expressions you add during debugger inspection.
Call Stack: Lists active call frames. Select a frame to view its source location and variables.
Breakpoints: Lists your breakpoints. You can enable, disable, or remove them.
Registers: Displays processor core registers, such as the program counter and stack pointer.
Cortex Live Watch: Continuously refreshes selected expressions while the application runs. Turn on this feature in the Debug Configurator, then add expressions during the debug session. See Monitor Live Expressions During Debug.
XPeripherals: Provides access to the target's memory-mapped peripheral registers also known as Special Function Registers (SFRs), as described in its System View Description (SVD) file. Expand a peripheral to inspect its registers.
Debug Startup Modes#
The Startup mode controls how the debugger starts the application:
Mode | Device and application behavior | Use it when |
|---|---|---|
Run directly (Default) | Loads the application and sets the stack pointer (SP) and program counter (PC) from the application's vector table. Execution starts at the application's reset handler. | You want to debug the application startup sequence, including applications with a nonzero boot address. |
Device Reset | Uses the device-reset startup sequence before starting the debug session. | You need to start debugging from a device reset. |
Attach to target | Attaches the debugger to an application that is already running on the device. It does not launch or restart the application or run the launch-mode reset commands | You want to inspect the target’s current runtime state. |
To set or change the mode:
Right-click the project, select Open Configurators 2.0 > Debug Configurator.
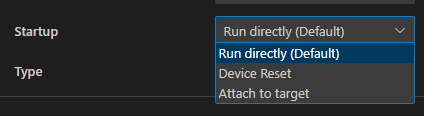
Under Startup, select the mode you want to use.
The following image shows the three startup modes:
Monitor Live Expressions During Debug#
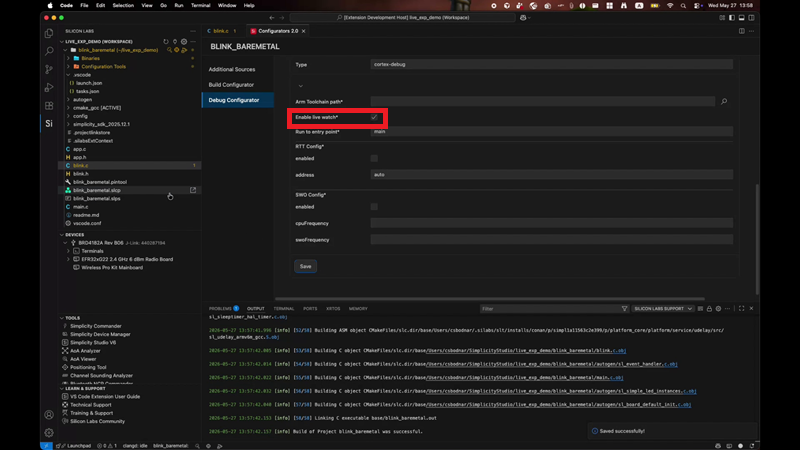
Live Expressions let you monitor variables and expressions while the target application continues to run. In the Debug Configurator, this feature is labeled Enable live watch. During a debug session, live expressions are shown in the Cortex Live Watch section of the Run and Debug view.
Use Watch to inspect expressions at breakpoints or while stepping through code. Use Cortex Live Watch to continuously monitor changing values while the application runs, without repeatedly stopping execution.
This procedure assumes that your project builds successfully and that you have a configured debug connection to a Silicon Labs target device.
Enable Live Watch#
Right-click the project folder and select Open Configurators 2.0.
Select Debug Configurator.
Select the debug configuration you want to edit.
In the optional fields, select Enable live watch.
Save the debug configuration.
Add a Live Expression#
Build the project.
Start a debug session.
In the Run and Debug view, expand Cortex Live Watch.
Select Add Expression, enter the variable or expression that you want to monitor, and press Enter.
Let the application continue running and observe the value in Cortex Live Watch.
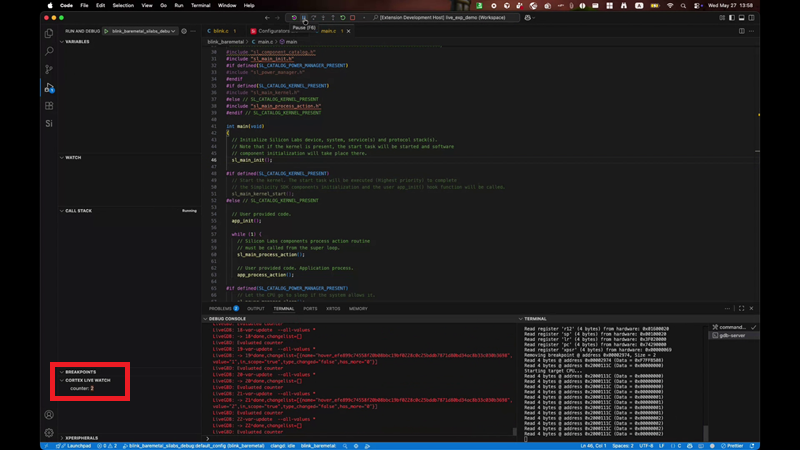
Use live expressions to monitor runtime values such as timer values, event flags, counters, state-machine variables, and application status values.