Explore the VS Code Extension#
After you install the Simplicity Studio for VS Code extension, a Welcome screen displays with getting started instructions for using the extension.
Download Simplicity Studio: Because the extension relies on projects generated and configured by Simplicity Studio, your first task is to download and install Simplicity Studio 6.
Generate a VS Code Project: Indicates a project must be generated in Simplicity Studio 6 to use the project in the extension.
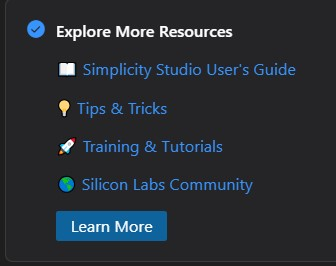
Explore More Resources: Links are provided for the online user's guide, training, and tutorials.
Ready to Start: Click the Si icon in the left navigation bar to find the heart of the extension functionality.
Mark Done: Click this link to stop the Welcome screen from displaying when you launch the Simplicity Studio VS Code extension.
Dependencies for the Simplicity Studio for VS Code Extension#
You can view the dependencies for the Simplicity Studio VS Code extension by selecting the extension in VS Code and then clicking the DEPENDENCIES tab. The current dependencies are:
Cortex-Debug
C/C++
C/C++ Themes
CMake
YAML
Settings for the Simplicity Studio for VS Code Extension#
You can explore the extension settings by:
Selecting the extension.
Clicking the Settings (gear) icon and selecting Settings from the pop-up menu.
The Settings tab displays.
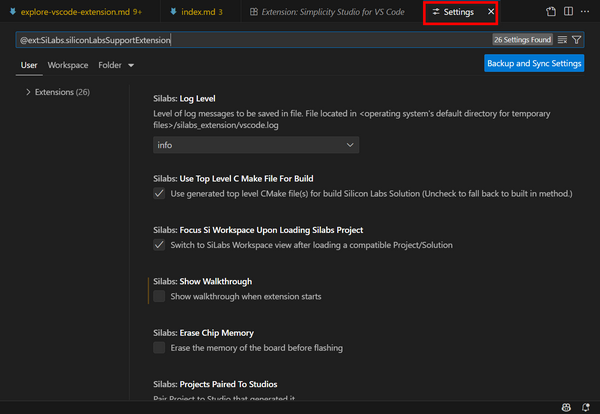
Each setting has a description on the Settings tab, but only a few important settings are listed below:
Build Before Flash: This setting controls whether a project is built before flashing the target. If you always manually build the project to check for errors before flashing, you can deselect this setting.
Device Name: A custom board setting that lets you override the target part. This is an important setting if the other device detection and configuration options are not working.
Si View#
The Si View has four possible containers:
Workspace
Devices
Tools
Learn and Support
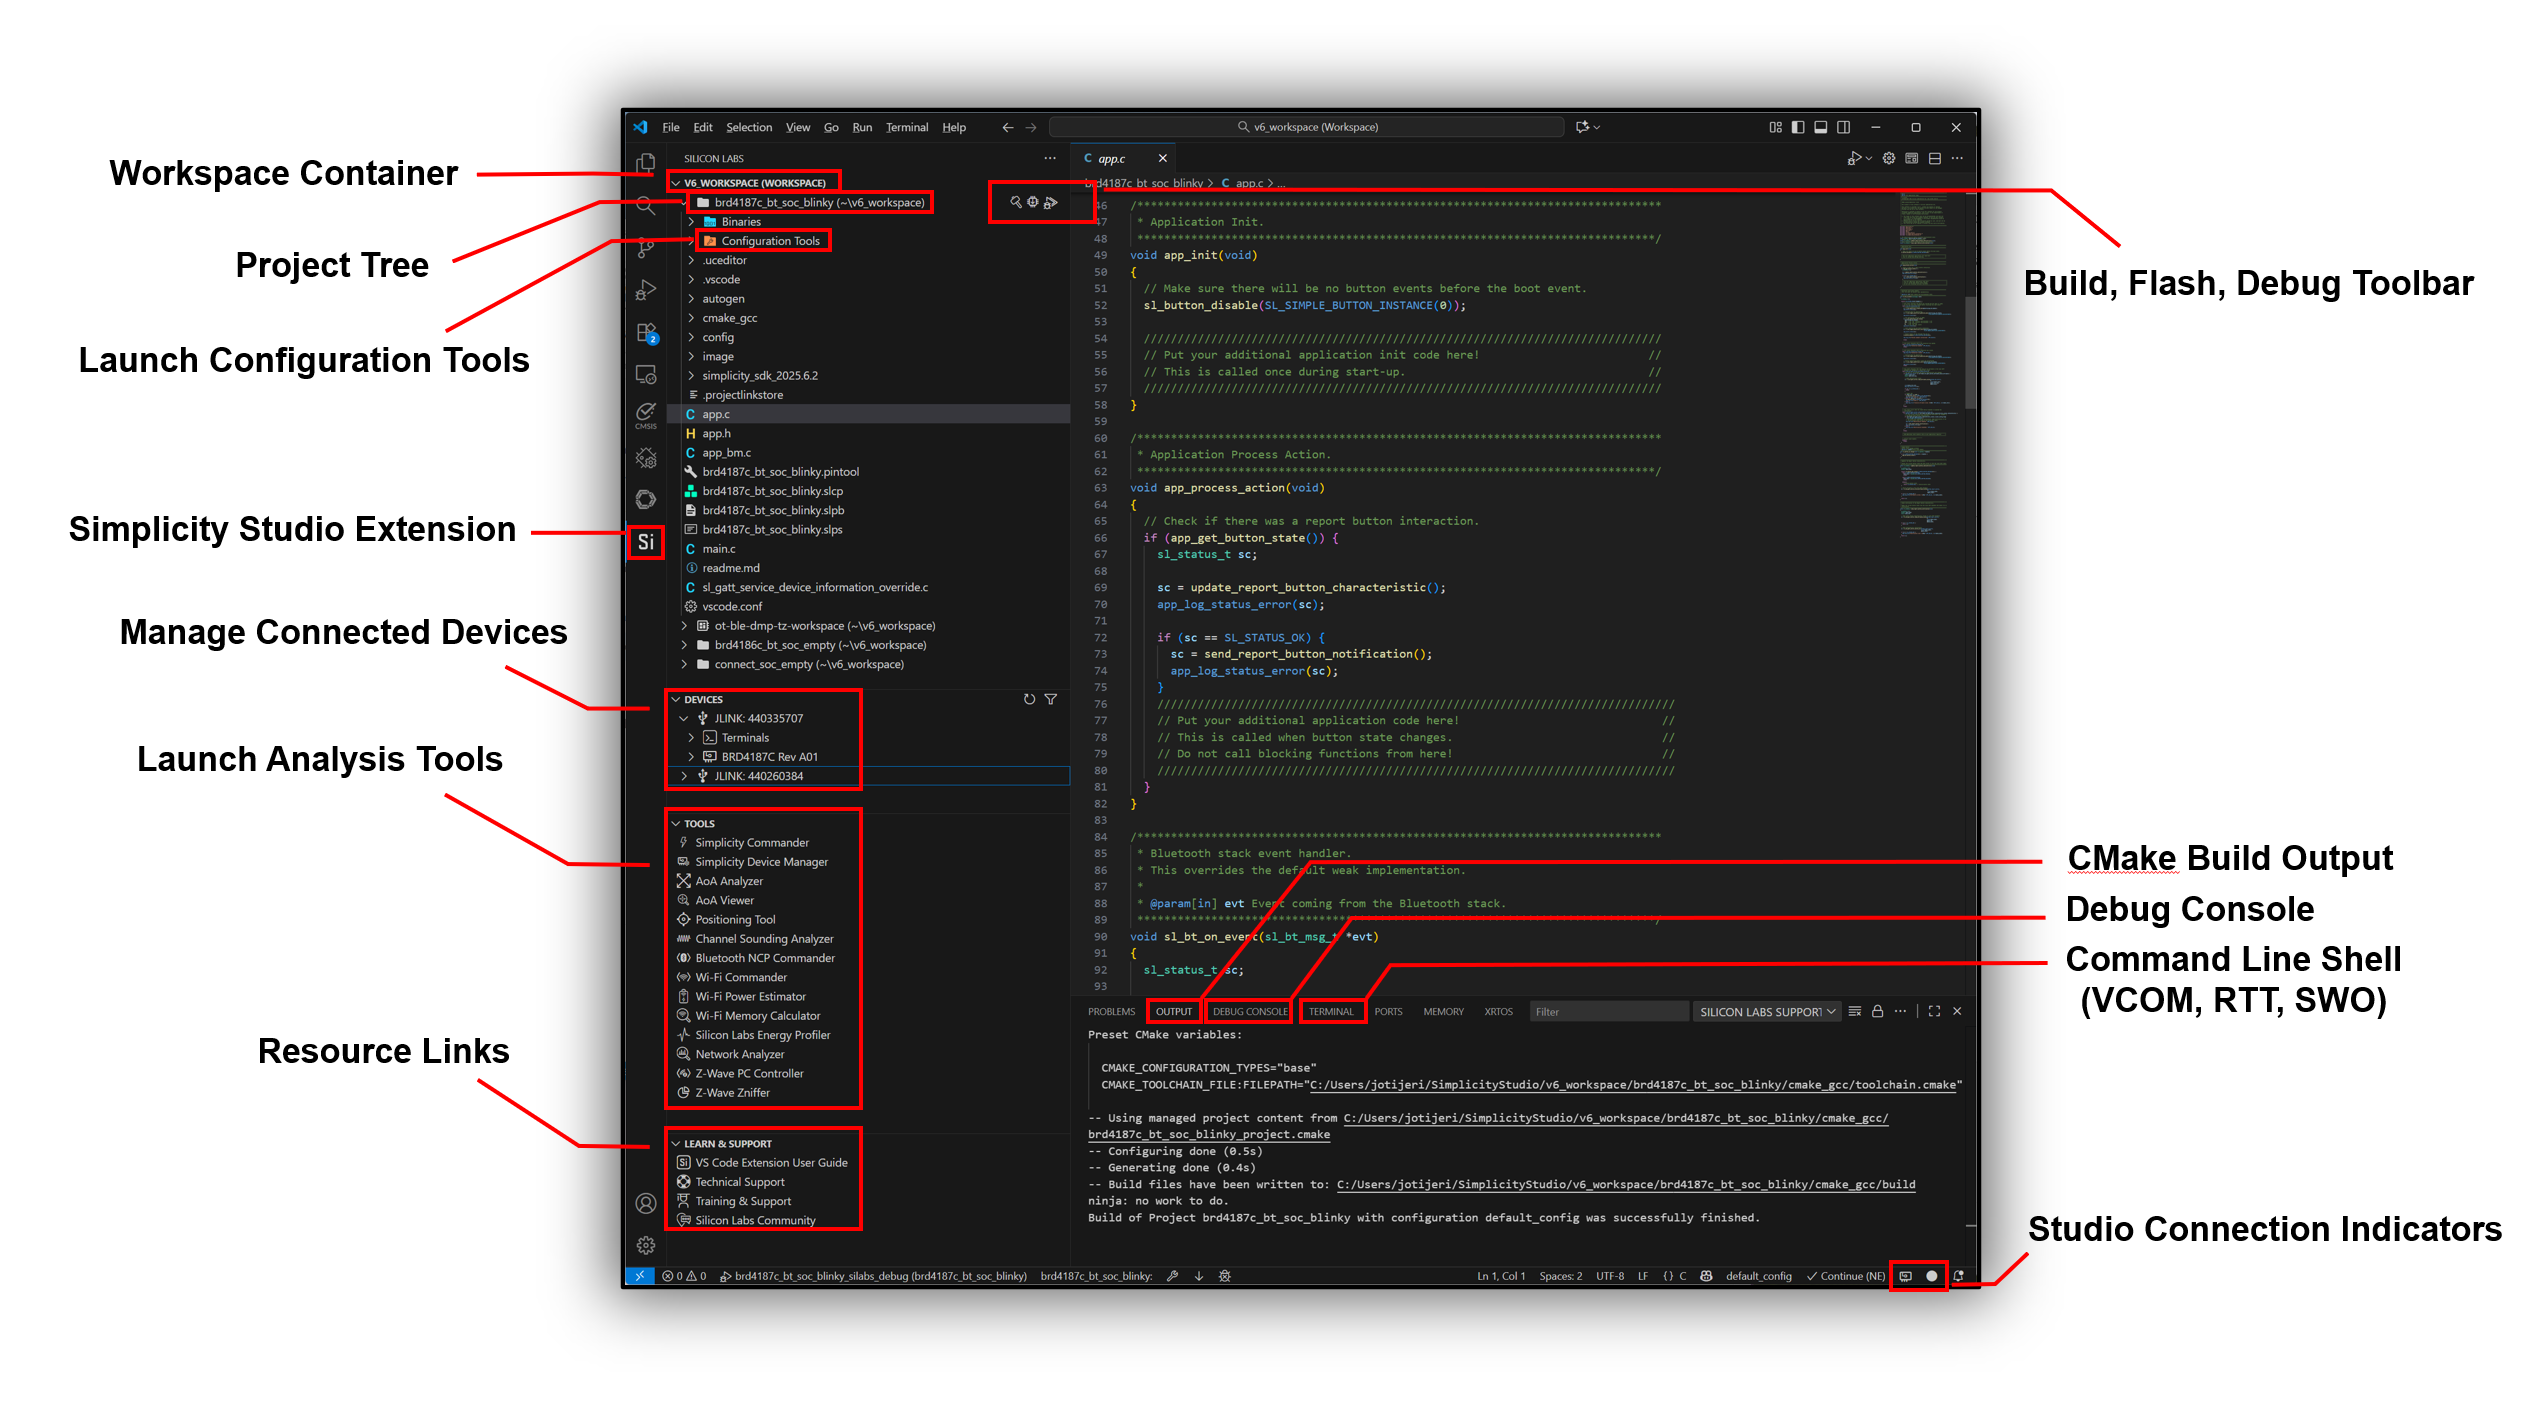
Workspace Container#
When you select Si view for the first time, no items have been added to the Workspace container, and so links display to either Open Simplicity Studio or Import Workspace. If you have not created any projects in Simplicity Studio, click Open Simplicity Studio to create one or more projects and.or solutions.
Note: In this context, the term, project, refers to projects and solutions, except when discussing explicit solution functionality.
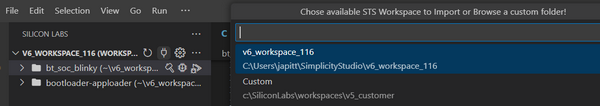
After you create one or more projects, click Import Workspace to add the project(s) to the Si Workspace container. Any recently opened workspaces are displayed in the dropdown list. If you do not see them, click Search to find your Simplicity Studio projects or workspaces. A Simplicity Studio generated project is considered compatible, if its generator list contains Visual Studio Code. This is the default for all Simplicity Studio 6 projects.
Workspace Toolbar#
The Workspace toolbar has three icons:
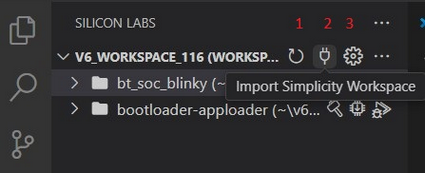
Refresh Workspace: Click to refresh your workspace when you have made changes to the workspace outside VS Code.
Import Workspace: Click to import a workspace as described above.
Settings: Click to display the settings for the Simplcity Studio VS Code extension.
Connect and Select Previous Workspaces#
Follow these steps to connect and select previous workspaces:
Import the Simplicity Studio Workspace.
Select a previously connected workspace.
Selecting a previously connected workspace automatically loads the folder content into the workspace view.
Edit the list using settings.
Important: Only projects and solution generated with Visual Studio Code generator are displayed.
Click the Browse button to browse the folders for a new workspace.
Selecting a new workspace automatically loads the folder content into the workspace view.
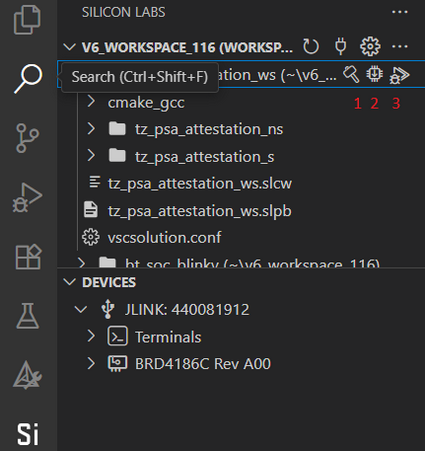
Workspace Details#
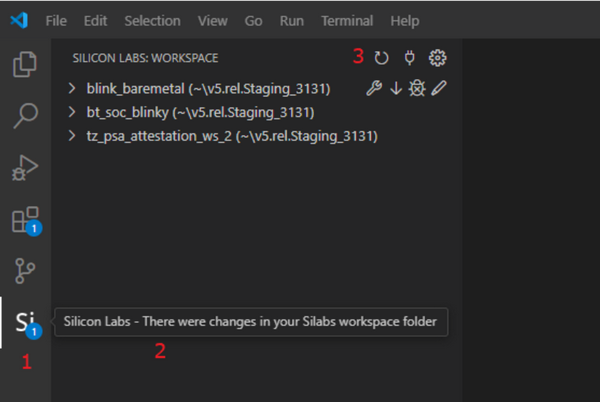
Si icon: The number in the circle at the lower right corner of this icon shows how many notifications are waiting. These are listed in the tooltip when you hover your pointer over the Si icon.
Tooltip: This displays when the workspace has changes.
Refresh icon: Click to update the content in your workspace.
Actions for a Displayed Project#
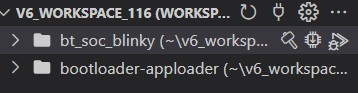
The following toolbar icons are available for a displayed project:
Build: If multiple build configurations are present for a project, you must select one build configuration before you build a project.
Flash:
Before executing a flash, you must choose a binary file to flash. Select from .hex, .bin, or .rsp. For binary files that do not contain address information, such as .bin, you should also add a starting memory address.
When multiple compatible devices are connected (see settings: Board display), choose one.
Debug:
When multiple compatible devices are connected (see settings: Board display), choose one.
When the debug section starts successfully, the Run and Debug view displays.
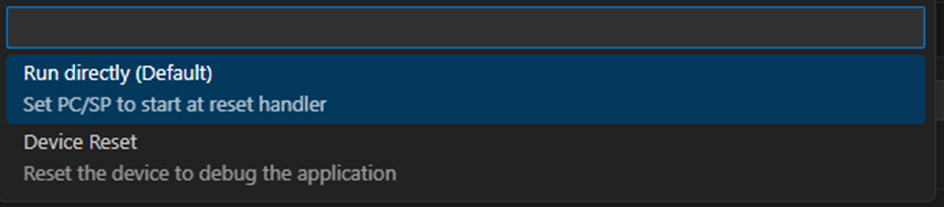
When starting a debug session for the first time, you’ll be prompted to choose one of two startup modes: Run Directly (default) or Device Reset.
Run Directly: Sarts code execution from the application’s reset handler, initializing the stack pointer (SP) and program counter (PC) directly from the application’s vector table. This mode does not perform a full hardware reset and is recommended for applications with a non-zero boot address, such as those running alongside a bootloader.
Device Reset - Performs a full hardware reset before starting the debug session, ensuring the device begins execution from its primary reset vector. This mode is appropriate for standalone applications or when a clean hardware state is required.
When Debug is launched, a
launch.jsonfile is created or updated in the.vscodefolder with information about the Silicon Labs debug session. If you have your ownlaunch.jsonfile and want to keep it, the corresponding Overwrite launch file setting should be turned off.To monitor variables and expressions while the target continues to run, see Monitor Live Expressions During Debug.
Actions for a Displayed Solution#
The following actions are available for a displayed solution:
Build: In this version only, one build configuration is available for a solution.
Flash:
Before executing a flash, you must choose a binary file to flash.
When multiple compatible devices are connected (see settings: Board display), choose one.
Debug:
When multiple compatible devices are connected (see settings: Board display), choose one.
When starting a debug session for the first time, you’ll be prompted to choose one of two startup modes:Run Directly (default) or Device Reset.
Run Directly: Sarts code execution from the application’s reset handler, initializing the stack pointer (SP) and program counter (PC) directly from the application’s vector table. This mode does not perform a full hardware reset and is recommended for applications with a non-zero boot address, such as those running alongside a bootloader.
Device Reset - Performs a full hardware reset before starting the debug session, ensuring the device begins execution from its primary reset vector. This mode is appropriate for standalone applications or when a clean hardware state is required.
When the debug section starts successfully, the Run and Debug view displays.
When Debug is launched, a
launch.jsonfile is created or updated in the.vscodefolder with information about the Silicon Labs debug session. If you have your ownlaunch.jsonfile and want to keep it, the corresponding Overwrite launch file setting should be turned off.
Context Menu for a Project Folder
Right-click a project folder to display a context menu with the following actions:
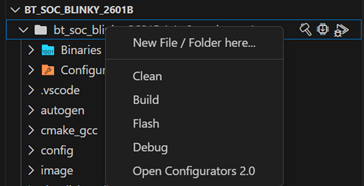
Add new file or folder to the selected folder
When you select this action, an additional input dialog displays.
If the text input contains a file extension, a file is created; otherwise, a folder is added.
You cannot add a folder or file to the top-level folder of a solution.
Clean: Does a clean build of the project.
Build: Builds the project.
Flash: Flashes the project binary to the target.
Debug: Launches the debugger for the project.
Open Configurators 2.0: Opens the configurators screen with the following sections:
Additonal Sources: Adds files and folders previously added to the project to the build configuration.
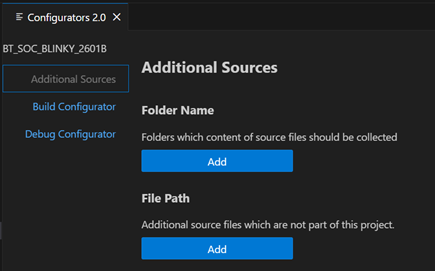
Folder Name: Adds a source file folder to the build configuration.
File Path: Adds include file paths to the build configuration. The added path is searched for header files included by source files.
Build Configurator: Adjusts the build configurations.
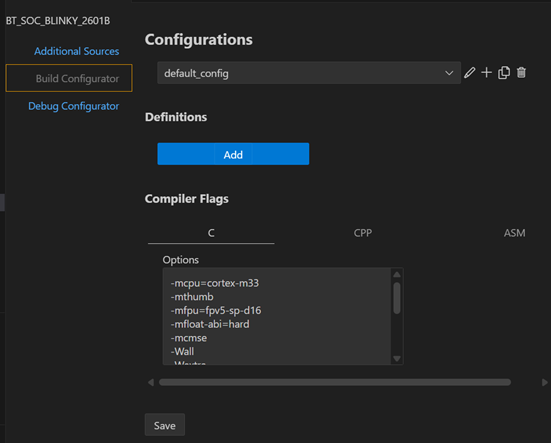
Configurations: Selects an existing build configuration to edit or rename, add, copy, or delete a configuration.
Definition (build symbols)
Edit or delete an existing definitions.
Add new definitions.
Compiler Flags: Add, edit or delete compiler flags for C, CPP, or ASM.
Save your changes.
Debug Configurator: Adjusts the debugger configuration.
The debug configuration is created automatically with default settings for the project. The Debug Configurator lets you change the settings manually.
Select from the available debug configurations to edit.
Rename, add, copy, or delete a debug configuration.
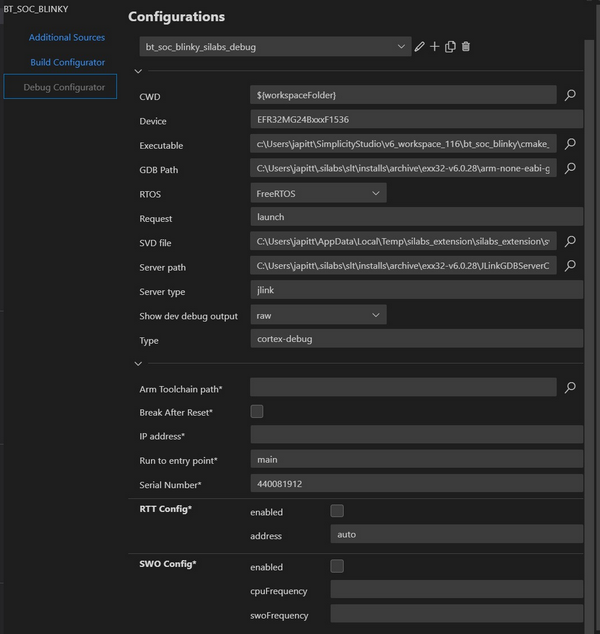
Debug Configurator Fields
CWD: The current working directory or workspace folder.
Device: The debug device name, it may be different than the actual device OPN depending on currently supported J-Link support. The default setting should be compatible with J-Link.
Executable: The debugger-compatible project binary file [i.e., a binary file with executable and linking format (ELF) debug information].
GDB Path: The path to the arm gdb client.
RTOS: The real-time operating system (RTOS) used by the project, if any. This loads the GDB RTOS plugin for the debug session.
Request: Launch
SVD File: The special function register (sfr) file for the debugger debug device (target). This file should be downloaded automatically by the extension based on the project properties.
Server path: The path to the GDB server.
Server type: J-Link, the only server type currently supported.
Show dev debug output: The format to use in the output in the Packet Trace Interface (PTI) debug console.
Type: The debug configuration type. Currently
cortex-debugis the only supported debug configuration type.Arm Toolchain path: Use to override the default toolchain path.
Enable live watch: Enables live expression updates in the CORTEX LIVE WATCH section during a debug session.
Break After Reset: If Run to entry point is blank, select this option to stop the debugger after a device is reset.
IP address: The IP address for the networked J-Link debug adapters.
Run to entry point: The initial breakpoint for the debug session. The default is run to main.
Serial Number: The serial number for the USB-connected debug adapters. This is when multiple debug adapters are connected to the computer.
Save your debug configurator changes.
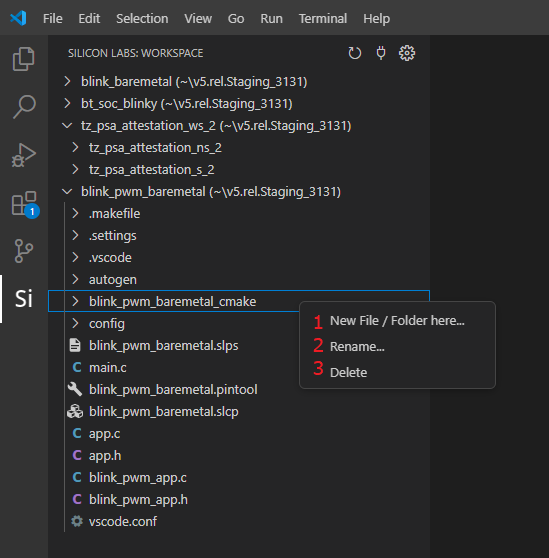
Context Menu Within a Project
When you are in a project, right-click a folder to display a context menu with the following actions:
New File / Folder here: Adds a new file or folder to the selected folder.
When you choose this, an additional input dialog displays.
If a text input contains a file extension, a file is created; otherwise, a folder is added.
You cannot add a folder or file to the top-level folder of a solution.
Rename: Changes the name of a selected folder.
You can rename projects and solutions in Simplicity Studio only.
You can rename sub-projects of a solution in Simplicity Studio only.
Renaming a folder generated in Simplicity Studio may cause the project to malfunction.
Delete: Deletes a selected folder.
You can delete projects and solutions in Simplicity Studio only.
You can delete sub-projects of a solution in Simplicity Studio only.
Deleting a folder generated in Simplicity Studio may cause the project to malfunction.
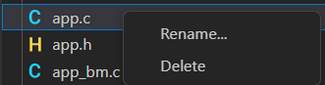
Context Menu for a Source File
Right-click a source file to open a context menu with the following actions:
Rename: Changes the name of the selected file.
Renaming a file generated in Simplicity Studio may cause the project to malfunction.
Delete: Deletes the selected file.
Deleting a file generated in Simplicity Studio may cause the project to malfunction.
File-specific Context Menu
Right-click a Simplicity Studio 6 tool or project file to open a file-specific context menu that may include opening it in Simplicity Studio 6 or in a text editor.pintool file.
Show the selected file in VSC Explorer by moving the focus to the selected file in the VSC Explorer view.
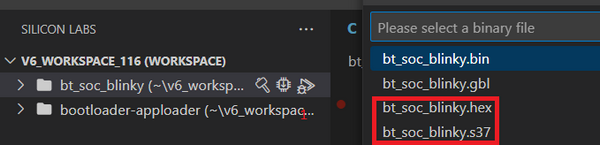
Successfully built configuration under the project
From the project folder toolbar, click the Flash icon.
Before executing a flash, you must choose a binary file to flash. Select from .hex, .bin, or .rsp. For binary files that do not contain address information, such as .bin, you should also add a starting memory address.
When multiple compatible devices are connected (see settings: Board display), choose one.
From the project folder toolbar, click the Debug icon.
When multiple compatible devices are connected (see settings: Board display), choose one.
When the debug section starts successfully, the Run and Debug view displays.
When Debug is launched, a
launch.jsonfile is created or updated in the.vscodefolder with information about the Silicon Labs debug session. If you have your ownlaunch.jsonfile and want to keep it, the corresponding Overwrite launch file setting should be turned off.
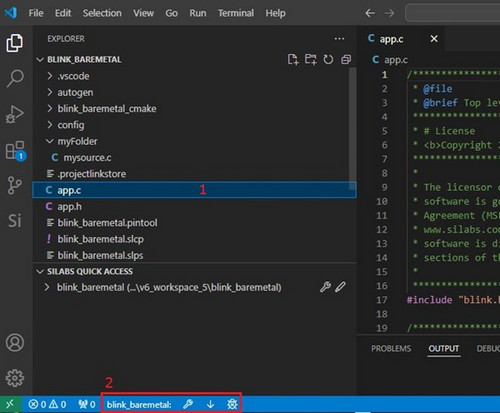
Status Bar#
When you select a file from an opened project in VS Code explorer, the shortcuts to build, flash, and debug display in the status bar with the project name that contains the file you selected.
A file selected in the EXPLORER panel of VS Code
Shortcuts to build, flash and debug
You can initiate these by one or more additional input steps, depending on the number of opened projects and the number of connected devices.