EFR32xG21 Compliance with FCC 15.247 - Bluetooth 1M +10dBm#
In the 2.4 GHz frequency band, FCC allows a transmit power level of up to 1 Watt (+30 dBm) if certain operational conditions are met. The primary intent of these restrictions is to minimize interference to other operators in the band through “spreading” of the signal energy. This spreading may be accomplished in both the frequency and time domains through use of a Frequency Hopping Spread Spectrum (FHSS) system, or only in the frequency domain through use of a Wideband Digital Transmission System (DTS).
In a DTS device, the signal energy may be spread across a wide bandwidth by use of digital modulation with a combination of a high data rate and/or high frequency deviation. The Power Spectral Density (PSD) requirement for DTS devices in FCC is max 8 dBm / 3 kHz, which is a limiting factor for TX power in most cases.
PSD testing in FCC is not required as long as FHSS is used with a minimum of 15 hopping channels.
This section demonstrates the EFR32xG21 IC-based host device compliance with the regulatory requirements of FCC Part 15.247 for DTS operating in the 2.4 GHz band using Bluetooth 1M PHY at +10 dBm TX power.
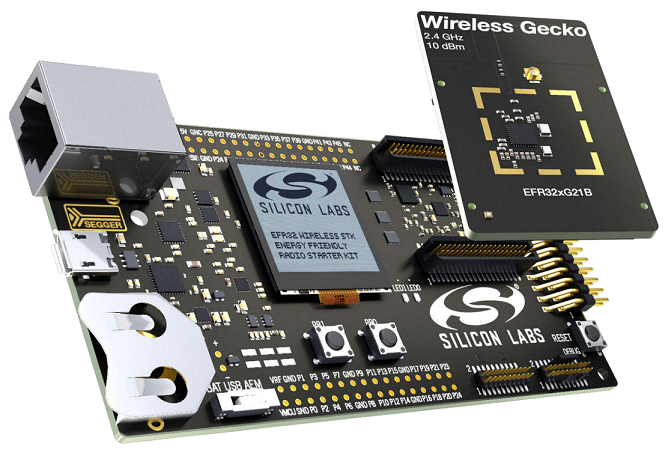
HW: BRD4181C radio board with built-in PCB IFA antenna + BRD4001A Wireless Starter Kit
FW: BT NCP sample application + NCP Commander
SDK: Simplicity SDK 2024.12.1
0) Test Items#
This article focuses on demonstrating the compliance of the EFR32xG21 device (Bluetooth 1M, +10 dBm) with 47 CFR FCC Part 15, Subpart C (Section 15.247). Due to the nature of this radio device, it is also subject to Sections 15.203, 15.205, 15.207, and 15.209.
FCC Clause | Test Item |
|---|---|
15.247 (b) | Conducted Output Power Measurement |
15.207 | AC Power Conducted Emission |
15.247 (d) | Conducted Out of Band Emission Measurement |
15.247 (a)(2) | Conducted 6 dB Bandwidth Measurement |
15.247 (e) | Conducted Power Spectral Density Measurement* |
15.205 & 15.209 | Radiated Emission |
15.247 (d) | Radiated Band Edge Measurement |
15.203 | Antenna Requirement |
* Conducted Power Spectral Density (PSD) measurement can be skipped if the device uses the frequency hopping technique (FHSS) with at least 15 hopping channels. At +10 dBm TX power, the 8 dBm / 3 kHz PSD limit can be easily met with all BLE PHYs, so there is no need to use FHSS to skip this test. However, the device can still utilize FHSS at +10 dBm if desired.
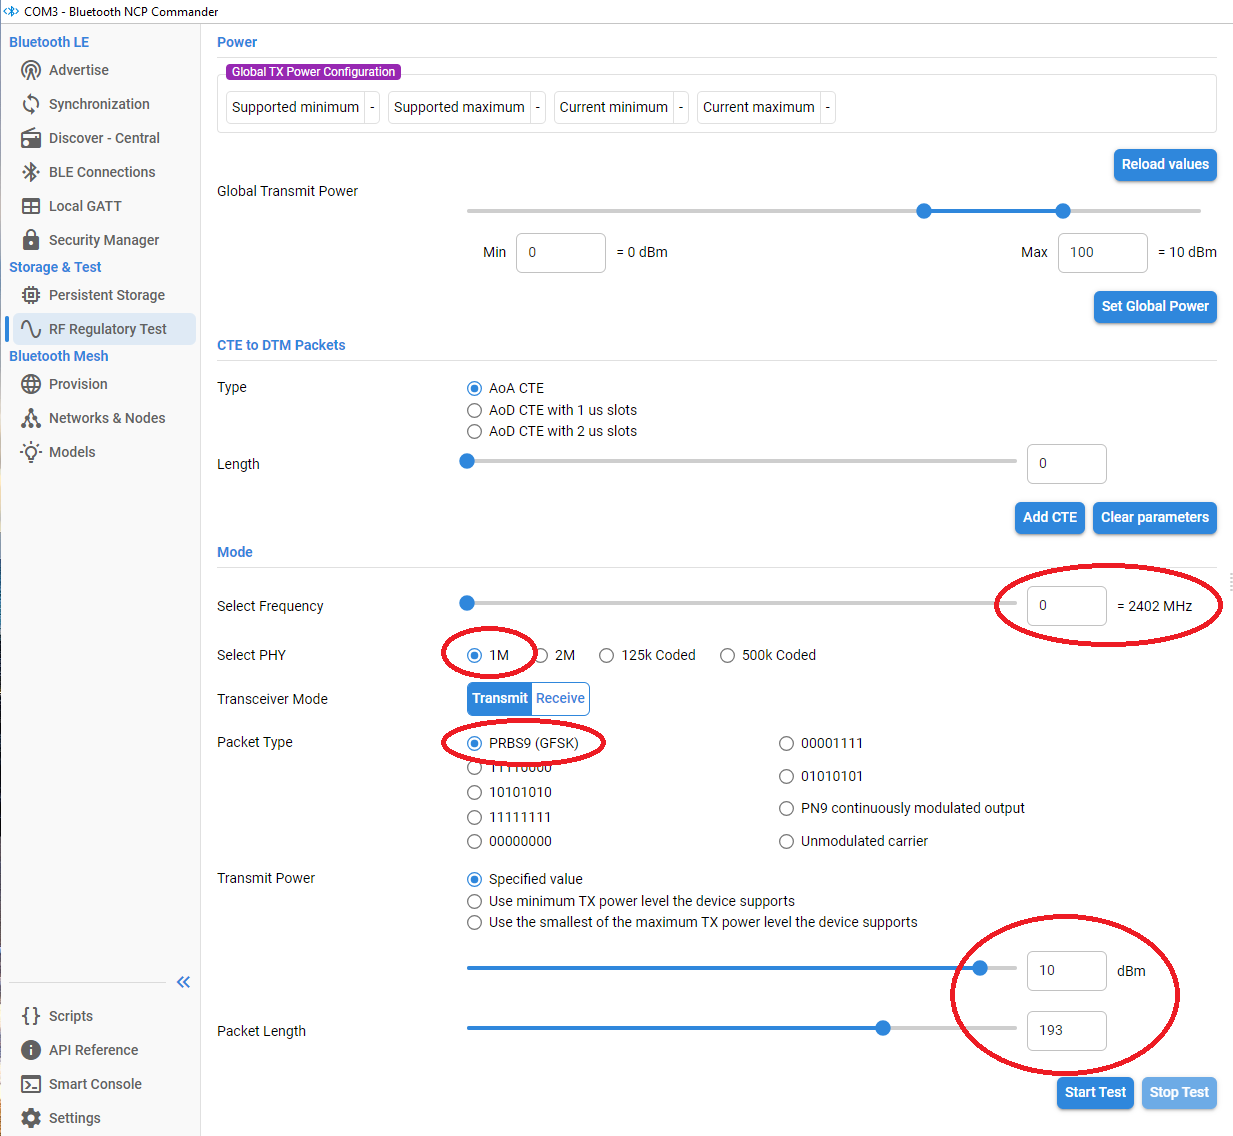
For the measurements, BLE DTM packets were used with the following parameters:
PHY: 1 Mbps
TX Power: +10 dBm
Packet type: PRBS9 (GFSK)
Packet Length: 193 byte*
* For the 1 Mbps BLE PHY, a packet length of 193 bytes results in the worst-case (highest) duty cycle of 86.6%. Using advertising packets at dedicated primary advertising channels can reduce the duty cycle at these frequencies, thereby increasing the margin when targeting average measurements.
The NCP Commander interface used for the tests is shown below:
1) Conducted Output Power Measurement (15.247 (b))#
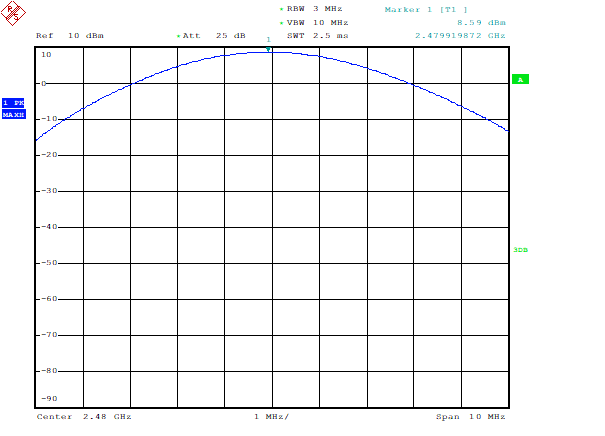
1.1) Peak Conducted Power Measurement#
Spectrum analyzer configuration:
RBW ≥ Signal Bandwidth
VBW ≥ 3 x RBW
Frequency span ≥ 3 x RBW
Sweep time = Auto couple
Detector type = Peak
Trace mode = Max Hold
Allow the resulting trace to fully stabilize
Use peak marker function to determine the peak amplitude level
Channel | Frequency (MHz) | Peak Power (dBm) | Limit (dBm) | PASS / FAIL |
|---|---|---|---|---|
0 | 2402 | 8.7 | 30 | PASS |
1 | 2404 | 8.7 | 30 | PASS |
19 | 2440 | 8.7 | 30 | PASS |
38 | 2478 | 8.6 | 30 | PASS |
39 | 2480 | 8.6 | 30 | PASS |
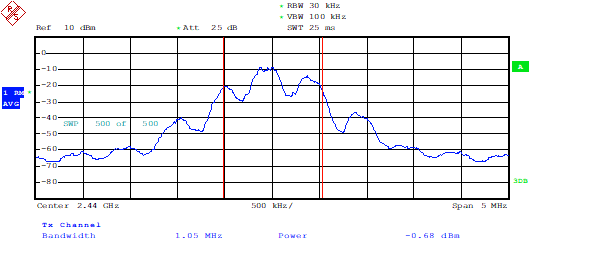
1.2) Average Conducted Power Measurement#
Spectrum analyzer configuration:
RBW ≥ (0.01 - 0.05) x OCBW (but should not exceed 1 MHz)
VBW ≥ 3 x RBW
Frequency span ≥ 1.5 x OCBW
Sweep time = Auto couple
Number of Sweep Points ≥ 2 x Frequency Span / RBW
Detector type = RMS
Trace mode = Linear Average
Allow the resulting trace to fully stabilize
Compute the power by integrating the spectrum across the OCBW using the Band Power function of the spectrum analyzer
Channel | Frequency (MHz) | Average Power (dBm) | Limit (dBm) | PASS / FAIL |
|---|---|---|---|---|
0 | 2402 | -3.4 | 30 | PASS |
1 | 2404 | -1.4 | 30 | PASS |
19 | 2440 | -0.7 | 30 | PASS |
38 | 2478 | -3.4 | 30 | PASS |
39 | 2480 | -3.5 | 30 | PASS |
2) AC Power Conducted Emission Measurement#
2.1) Limits#
Frequency (MHz) | Conducted Limit (dBµV) - Quasi-peak | Conducted Limit (dBµV) - Average |
|---|---|---|
0.15 - 0.5 | 66 - 56 | 56 - 46 |
0.5 - 5.0 | 56 | 46 |
5.0 - 30.0 | 60 | 50 |
2.2) Test Procedure#
The EUT should be placed 0.4 meters from the conducting wall of the shielded room with EUT being connected to the power mains through a line impedance stabilization network (LISN).
Other support units should be connected to the power mains through another LISN. The two LISNs should provide 50 ohm / 50 µH of coupling impedance for the measuring instrument.
Both lines of the power mains connected to the EUT should be checked for maximum conducted interference.
The frequency range from 150 kHz to 30 MHz should be searched.
Due to the lack of a shielded room that fulfills the requirements, AC Power Conducted Emission Measurement was not performed.
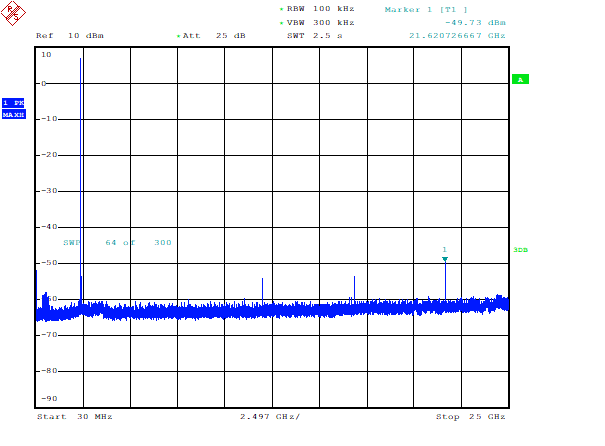
3) Conducted Out of Band Emission Measurement#
Spectrum analyzer configuration:
RBW = 100 kHz
VBW ≥ 3 x RBW
Sweep time = Auto couple
Detector type = Peak
Trace mode = Max Hold
Allow the resulting trace to fully stabilize
Use the peak marker function to determine the maximum power level in any 100 kHz band segment within the fundamental emission bandwidth
Limit of Conducted Out of Band Emission Measurement: below 20 dB of the highest emission level operating band (in 100 kHz Resolution Bandwidth). The highest emission level is 7.8 dBm, which is used as a base for the dBc calculations.
OOB Emission Frequency (MHz) | Channel | Carrier Frequency (MHz) | OOB Emission Level (dBc) | OOB Emission Limit (dBc) |
|---|---|---|---|---|
30 - 25000 | 0 | 2402 | -57.5 | -20 |
30 - 25000 | 1 | 2404 | -60.6 | -20 |
30 - 25000 | 19 | 2440 | -58.8 | -20 |
30 - 25000 | 38 | 2478 | -59.6 | -20 |
30 - 25000 | 39 | 2480 | -60.1 | -20 |
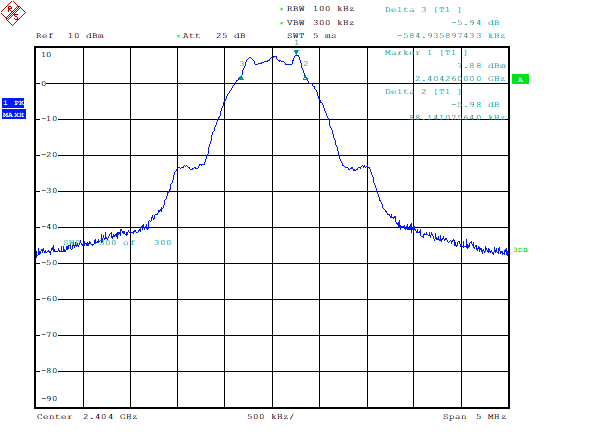
4) Conducted 6 dB Bandwidth Measurement#
Spectrum analyzer configuration:
RBW = 100 kHz
VBW ≥ 3 x RBW
Sweep time = Auto couple
Detector type = Peak
Trace mode = Max Hold
Allow the resulting trace to fully stabilize
Measure the maximum width of the emission that is constrained by the frequencies associated with the two amplitude points (upper and lower) that are attenuated by 6 dB relative to the maximum level measured in the fundamental emission.
Channel | Frequency (MHz) | 6 dB Bandwidth (kHz) | Minimum Limit (kHz) | PASS / FAIL |
|---|---|---|---|---|
0 | 2402 | 681 | 500 | PASS |
1 | 2404 | 673 | 500 | PASS |
19 | 2440 | 673 | 500 | PASS |
38 | 2478 | 677 | 500 | PASS |
39 | 2480 | 681 | 500 | PASS |
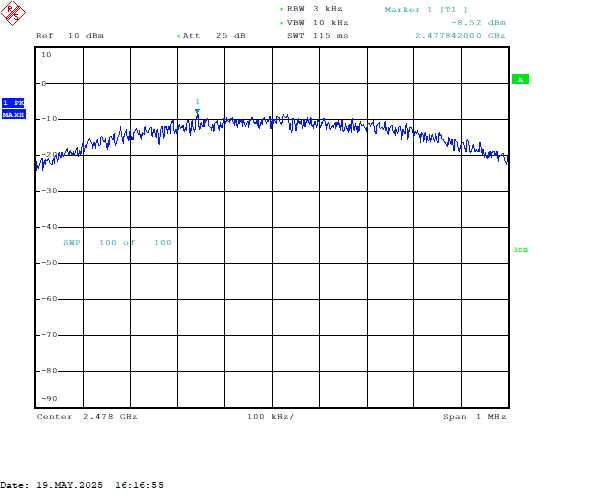
5) Conducted Power Spectral Density Measurement#
Spectrum analyzer configuration:
Frequency Span = 1.5 x DTS 6 dB bandwidth
3 kHz ≤ RBW ≤ 100 kHz
VBW ≥ 3 x RBW
Sweep time = Auto couple
Detector type = Peak
Trace mode = Max Hold
Allow the resulting trace to fully stabilize
Use the peak marker function to find the maximum amplitude level within the sweep
If the measured value exceeds the limit, reduce the RBW (to no less than 3 kHz) and repeat
Channel | Frequency (MHz) | PSD (dBm / 3 kHz ) | Limit (dBm / 3 kHz ) | PASS / FAIL |
|---|---|---|---|---|
0 | 2402 | -8.4 | 8 | PASS |
1 | 2404 | -8.4 | 8 | PASS |
19 | 2440 | -8.4 | 8 | PASS |
38 | 2478 | -8.5 | 8 | PASS |
39 | 2480 | -8.5 | 8 | PASS |
6) Radiated Emission Measurement#
6.1) Limits#
Radiated emissions that fall in the restricted bands must comply with the radiated emission limits specified in the following table. Other emissions shall be at least 20 dB below the highest level of the desired power.
For frequencies above 1000 MHz, the field strength limits are based on the average detector. However, the peak field strength of any emission shall not exceed the maximum permitted average limits specified below by more than 20 dB under any condition or modulation.
Frequency (MHz) | Limit (µV / m) | EIRP Limit (dBm) | Measurement Distance (m) |
|---|---|---|---|
0.009 - 0.490 | 2400 / F (kHz) | N/A | 300 |
0.490 - 1.705 | 24000 / F (kHz) | N/A | 30 |
1.705 - 30.0 | 30 | N/A | 30 |
30 - 88 | 100 | -55.2 | 3 |
88 - 216 | 150 | -51.7 | 3 |
216 - 960 | 200 | -49.2 | 3 |
960 - 25000 | 500 | -41.2 | 3 |
6.2) Configurations and setup#
Spectrum analyzer configuration (< 1 GHz Peak measurement):
RBW = 120 kHz (RBW = 9 kHz for frequencies < 30 MHz)
VBW = 120 kHz (VBW = 9 kHz for frequencies < 30 MHz)
Sweep time = Auto couple
Detector type = Quasi-peak
Trace mode = Max Hold
The EUT is be placed on the top of a rotating table, which is rotated 360 degrees to find the worst-case emission value
Both horizontal and vertical polarizations of the receiver antenna are set to make the measurement
Use the peak marker function to find the maximum amplitude level within the sweep
Spectrum analyzer configuration (> 1 GHz Peak measurement):
RBW = 1 MHz
VBW = 3 MHz
Sweep time = Auto couple
Detector type = Peak
Trace mode = Max Hold
The EUT is be placed on the top of a rotating table, which is rotated 360 degrees to find the worst case emission value
Both horizontal and vertical polarizations of the receiver antenna are set to make the measurement
Use the peak marker function to find the maximum amplitude level within the sweep
If the peak reading value also meets the average limit, measurement with average detector is not necessary
Spectrum analyzer configuration (> 1 GHz Average measurement):
RBW = 1 MHz
VBW ≥ 1/T (VBW = 1 kHz in this example)
Sweep time = Auto couple
Detector type = Average
Trace mode = Max Hold
Place the EUT on the top of a rotating table, which is rotated 360 degrees to find the worst-case emission value
Both horizontal and vertical polarizations of the receiver antenna are set to make the measurement
Use the peak marker function to find the maximum amplitude level within the sweep
The device was measured for radiated performance across the 216 MHz to 18 GHz frequency range. The lower frequency limit was set by the size of the anechoic chamber, while measurements above 18 GHz were constrained by receiver antenna calibration limits and high cable attenuation.
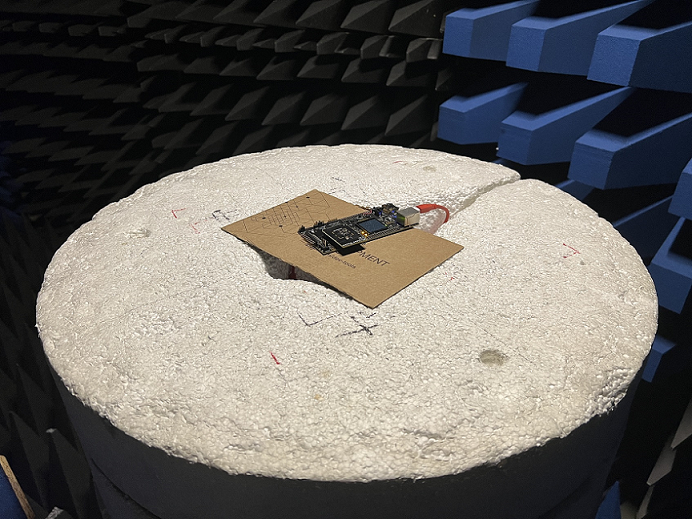
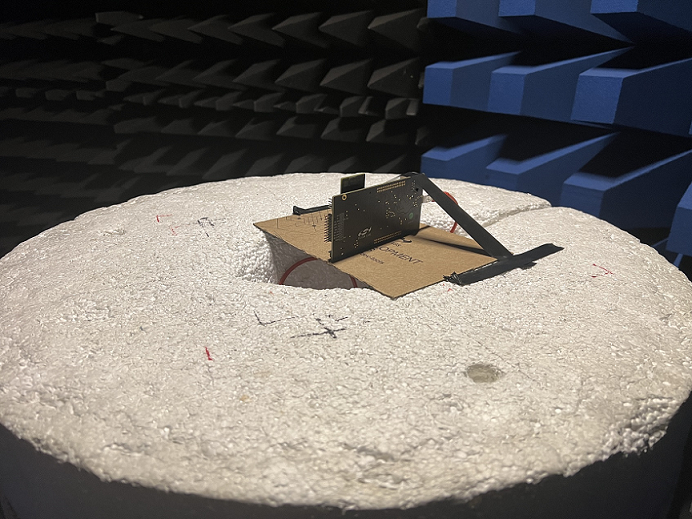
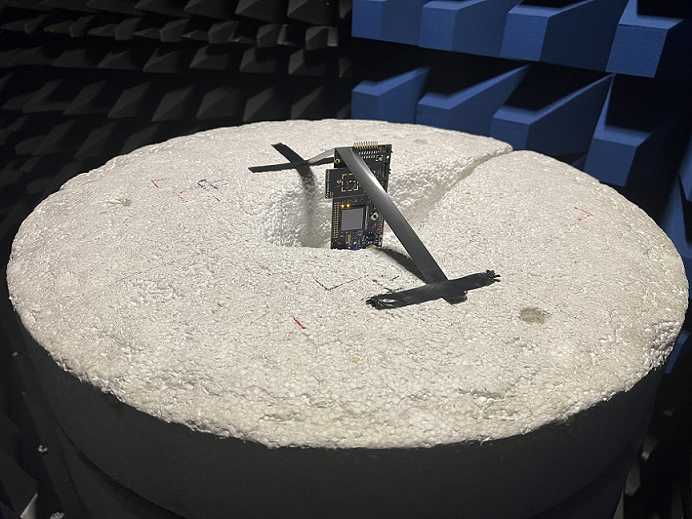
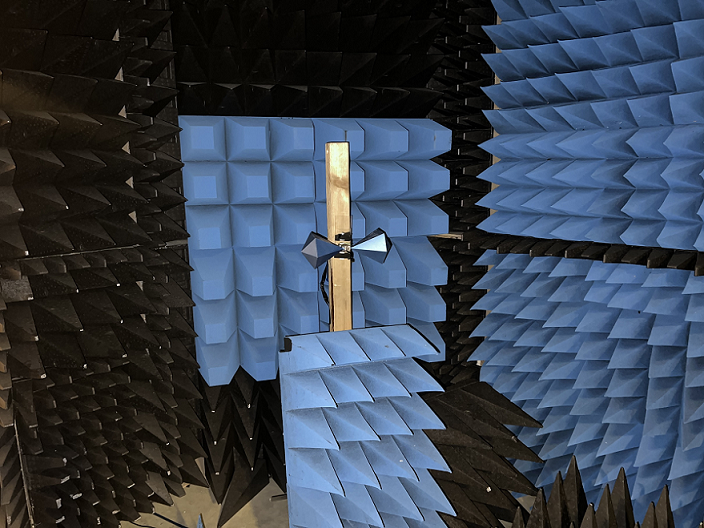
For the radiated measurements, the DUT was placed on a rotating table, and a receiver antenna was positioned 3 meters away and connected to a spectrum analyzer. The DUT was rotated through 360 degrees, and the maximum values were captured. The measurements were repeated in XY, XZ, and YZ DUT cuts combined with horizontal and vertical receiver antenna polarization, resulting in six total measurement configurations.
The following figures demonstrate the XY, YZ, and XZ DUT cuts, respectively.
The following figures show the biconical receiver antenna (used for < 1 GHz measurements) and the horn receiver antenna (used for > 1 GHz measurements), respectively.
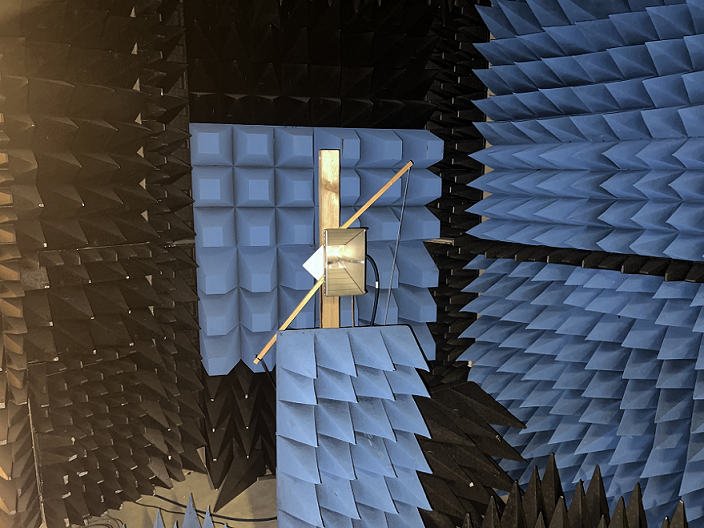
For the measurements above 1 GHz, an external LNA was connected to the spectrum analyzer to allow for measuring low signal levels.
The following sections present the worst-case radiated emission results.
6.3) Measurement results - Fundamental and harmonics#
Frequency (MHz) | Cut | EIRP Emission (dBm) | EIRP Limit (dBm) | PASS / FAIL |
|---|---|---|---|---|
2402 | XY H | 11.1 PK | PASS | |
2402 | YZ V | 9.1 AVG | PASS | |
4804 | YZ H | -46.4 PK | -21.2 | PASS |
4804 | YZ H | -57.3 AVG | -41.2 | PASS |
7206 | XZ H | -39.0 PK | 9.1 | PASS |
7206 | XZ H | -45.7 AVG | -10.9 | PASS |
9608 | XY H | -39.5 PK | 9.1 | PASS |
9608 | XY V | -52.6 AVG | -10.9 | PASS |
12010 | YZ V | -33.6 PK | -21.2 | PASS |
12010 | YZ H | -45.0 AVG | -41.2 | PASS |
Frequency (MHz) | Cut | EIRP Emission (dBm) | EIRP Limit (dBm) | PASS / FAIL |
|---|---|---|---|---|
2404 | YZ V | 10.6 PK | PASS | |
2404 | YZ V | 9.7 AVG | PASS | |
4808 | YZ H | -45.5 PK | -21.2 | PASS |
4808 | YZ H | -57.1 AVG | -41.2 | PASS |
7212 | XZ H | -38.9 PK | 9.7 | PASS |
7212 | XZ H | -46.1 AVG | -10.3 | PASS |
9616 | XZ V | -39.7 PK | 9.7 | PASS |
9616 | YZ H | -52.8 AVG | -10.3 | PASS |
12020 | YZ H | -34.3 PK | -21.2 | PASS |
12020 | YZ H | -44.4 AVG | -41.2 | PASS |
Frequency (MHz) | Cut | EIRP Emission (dBm) | EIRP Limit (dBm) | PASS / FAIL |
|---|---|---|---|---|
2440 | YZ V | 11.0 PK | PASS | |
2440 | YZ V | 10.1 AVG | PASS | |
4880 | YZ H | -47.1 PK | -21.2 | PASS |
4880 | YZ H | -57.0 AVG | -41.2 | PASS |
7320 | XZ H | -38.7 PK | -21.2 | PASS |
7320 | XZ H | -46.1 AVG | -41.2 | PASS |
9760 | XY H | -41.0 PK | 10.1 | PASS |
9760 | XY V | -53.9 AVG | -9.9 | PASS |
12200 | YZ H | -35.2 PK | -21.2 | PASS |
12200 | YZ H | -46.1 AVG | -41.2 | PASS |
Frequency (MHz) | Cut | EIRP Emission (dBm) | EIRP Limit (dBm) | PASS / FAIL |
|---|---|---|---|---|
2478 | XY H | 10.8 PK | PASS | |
2478 | XY H | 9.9 AVG | PASS | |
4956 | YZ H | -47.5 PK | -21.2 | PASS |
4956 | YZ H | -56.6 AVG | -41.2 | PASS |
7434 | XZ H | -40.5 PK | -21.2 | PASS |
7434 | XZ H | -48.2 AVG | -41.2 | PASS |
9912 | XY V | -41.2 PK | 9.9 | PASS |
9912 | XY H | -54.6 AVG | -10.1 | PASS |
12390 | YZ H | -34.5 PK | -21.2 | PASS |
12390 | YZ H | -46.5 AVG | -41.2 | PASS |
Frequency (MHz) | Cut | EIRP Emission (dBm) | EIRP Limit (dBm) | PASS / FAIL |
|---|---|---|---|---|
2480 | XY H | 10.8 PK | PASS | |
2480 | XY H | 9.8 AVG | PASS | |
4960 | YZ H | -47.0 PK | -21.2 | PASS |
4960 | YZ H | -56.8 AVG | -41.2 | PASS |
7440 | XZ H | -41.0 PK | -21.2 | PASS |
7440 | XZ H | -48.4 AVG | -41.2 | PASS |
9920 | XY H | -41.4 PK | 9.8 | PASS |
9920 | YZ V | -54.6 AVG | -10.2 | PASS |
12400 | YZ H | -35.5 PK | -21.2 | PASS |
12400 | YZ H | -46.8 AVG | -41.2 | PASS |
6.4) Measurement results - Spurious emissions 216 MHz - 1000 MHz#
The 216 MHz - 1000 MHz frequency band includes the following restricted bands:
240 - 285 MHz
322 - 335.4 MHz
399.9 - 410 MHz
608 - 614 MHz
960 - 1000 MHz (the actual upper edge is 1240 MHz)
The EIRP values are measured for the restricted band edges to demonstrate compliance. The worst-case values are presented out of the 5 carrier frequencies (2402, 2404, 2440, 2478, 2480 MHz) and out of the 6 different cuts (XY, XZ, YZ combined with H and V polarizations).
Spur Frequency (MHz) | Carrier Frequency (MHz) | Cut | EIRP Emission (dBm) | EIRP Limit (dBm) | PASS / FAIL |
|---|---|---|---|---|---|
240 | 2480 | XZ V | -63.2 | -49.2 | PASS |
285 | 2480 | XZ V | -63.9 | -49.2 | PASS |
322 | 2480 | XZ V | -63.7 | -49.2 | PASS |
335.4 | 2480 | XZ V | -63.5 | -49.2 | PASS |
399.9 | 2480 | XZ V | -63.3 | -49.2 | PASS |
410 | 2480 | XZ V | -63.2 | -49.2 | PASS |
608 | 2480 | XZ V | -58.6 | -49.2 | PASS |
614 | 2480 | XZ V | -58.8 | -49.2 | PASS |
960 | 2480 | XZ V | -59.0 | -41.2 | PASS |
1000 | 2480 | XZ V | -60.7 | -41.2 | PASS |
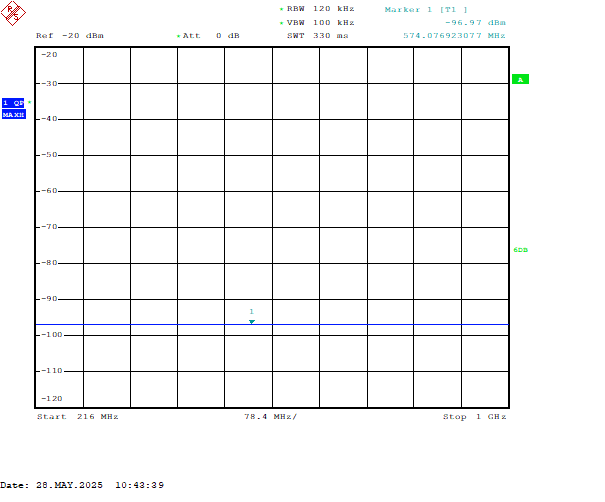
The following figure demonstrates compliance with the spurious emission limits between 216 MHz and 1000 MHz. Note that the emission values shown on the spectrum plot are not the actual EIRP values; these are the raw spectrum analyzer readings only, which need to be compensated with the cable loss, receiver antenna gain, and free space attenuation at 3 meters to get the actual EIRP values of the DUT.
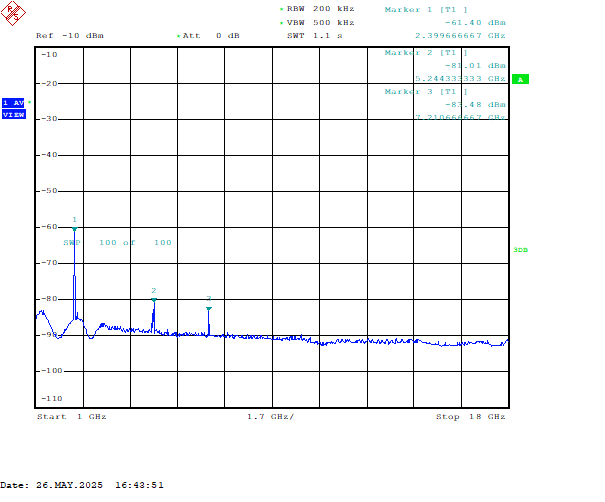
6.5) Measurement results - Spurious emissions 1 GHz - 18 GHz#
The 1 GHz - 18 GHz frequency band was also scanned for spurious emissions. Due to the high number of restricted bands within this frequency range, detailed EIRP results are not presented for each restricted band edges.
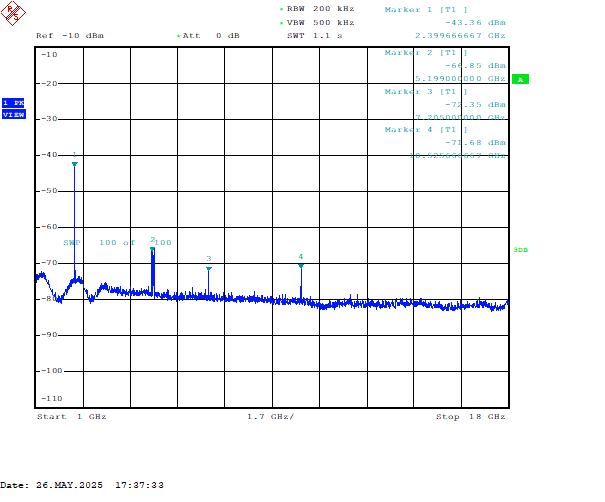
The following two figures demonstrate compliance with peak and average limits. Note that the emission values shown on the spectrum plot are not the actual EIRP values; these are the raw spectrum analyzer readings only, which need to be compensated with the cable loss, receiver antenna gain, and free space attenuation at 3 meters to get the actual EIRP values of the DUT.
The spectrum analyzer settings were selected to ensure that the spectrum analyzer noise level is below the spurious emission limit at all frequencies. The spectrum plots below show that there is no spurious emission present besides the fundamental and its harmonics. The spurious content near 5.2 GHz turned out to be an external noise picked up by the LNA connected to the spectrum analyzer.
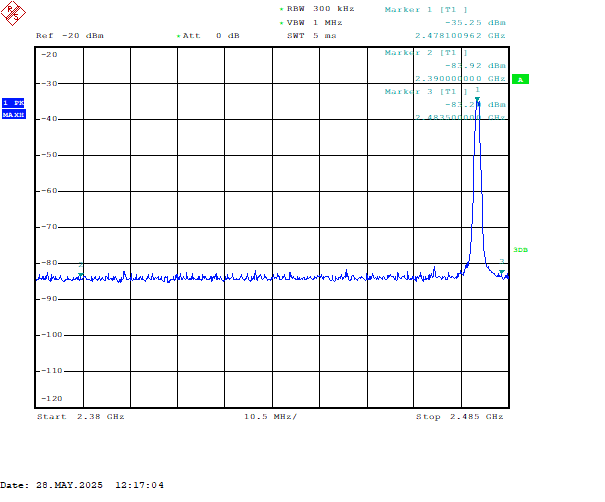
7) Radiated Band-edge Measurement#
Bandedge measurement should be performed at the restricted band edge frequencies closest to the 2.4 GHz operating band. The closest frequencies which fall into the restricted band are 2390 MHz and 2483.5 MHz.
The limits for band edges are the same as for radiated emissions that fall into restricted bands, therefore the field strength limit which needs to be met is 500µV / m at 3 m, which is equal to -41.2 dBm EIRP. The field strength limits are based on an average detector, however, the peak field strength of any emission shall not exceed the maximum permitted average limits by more than 20 dB under any condition or modulation.
The 1 MHz resolution bandwidth setting on the spectrum analyzer would increase the band-edge at 2483.5 MHz due to the filter characteristic being measured instead of the actual signal. Therefore, the following spectrum analyzer settings were used for the peak and average measurements.
PEAK
RBW = 300 kHz
VBW = 1 MHz
Sweep time = Auto couple
Detector type = Peak
Trace mode = Max Hold
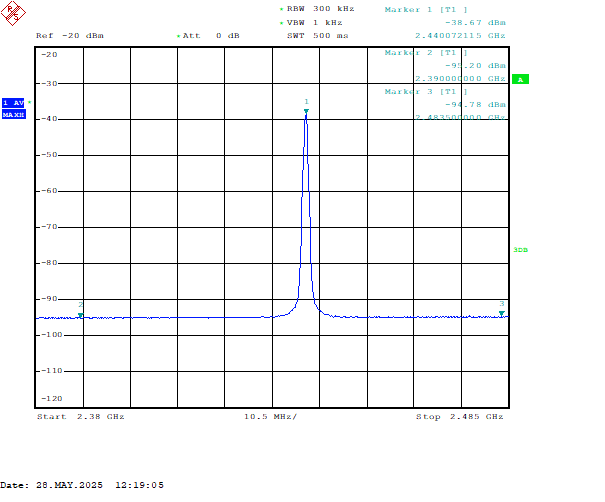
AVERAGE
RBW = 300 kHz
VBW = 1 kHz
Sweep time = Auto couple
Detector type = Average
Trace mode = Max Hold
7.1) Measurement results#
Band-edge Frequency (MHz) | Carrier Frequency (MHz) | Cut | EIRP Emission (dBm) | EIRP Limit (dBm) | PASS / FAIL |
|---|---|---|---|---|---|
2390 | 2404 | XY V | -39.9 | -21.2 | PASS |
2390 | 2478 | YZ V | -51.7 | -41.2 | PASS |
2483.5 | 2480 | XY H | -38.3 | -21.2 | PASS |
2483.5 | 2480 | YZ V | -49.5 | -41.2 | PASS |
The following figures demonstrate compliance with the band-edge limits. Note that the emission values shown on the spectrum plot are not the actual EIRP values; these are the raw spectrum analyzer readings only, which need to be compensated with the cable loss, receiver antenna gain, and free space attenuation at 3 meters to get the actual EIRP values of the DUT.