


Performance Results#
This page summarizes Wi-SUN network performance measured on a real physical setup with up to 1000 nodes. It focuses on the questions that usually matter first in a deployment.
How quickly does the network form or reconnect?
How stable is application traffic over time in terms of metering report success rate?
What about network latency? What factors drive CoAP response latency?
How long does firmware update over the air (FUOTA) take?
Test Setup#
Hardware#
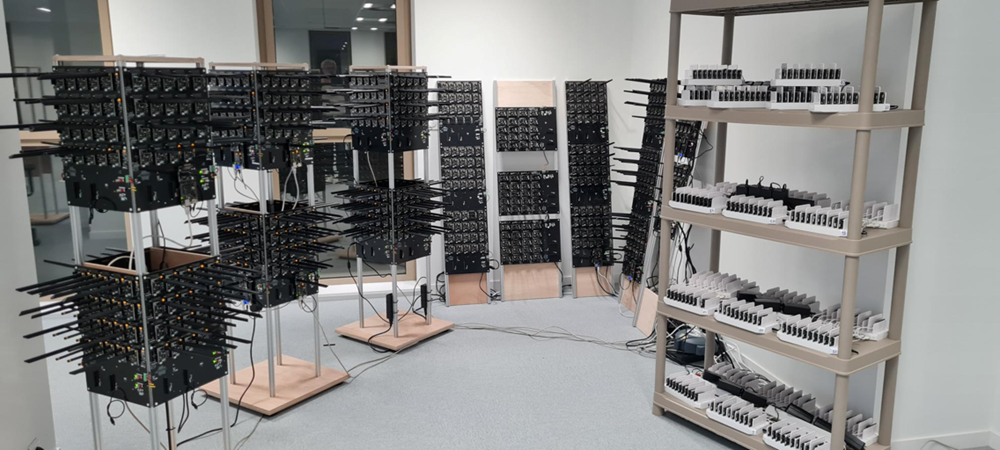
Linux Border Router (wsbrd) = Raspberry Pi 4B + RCP BRD4271A
750 EFR32FG25 radio boards BRD4271A
250 EFR32FG28 radio boards BRD2705A
Software#
wsbrd tag v2.9
FFN: Si-SDK 2025.12.2 Node monitoring application
RCP: Si-SDK 2025.12.2 Wi-SUN - RCP application sample
Configuration#
PHY: Europe, Chan_planID 33, Phy_ModeID 1/3/5 (50 kbps / 100 kbps / 150 kbps)
Network_size: SMALL, MEDIUM, LARGE
Nodes traffic: Once connected, each node sends a ~500 B UDP packet to the BR every 15 minutes
Network formation#
Network formation was measured in two scenarios:
Connection: Occurs when a node has not saved the key or when there is a key mismatch with the Border Router. This typically happens during initial network formation or Border Router replacement.
Test process: all nodes and the Border Router are powered down, caches are cleared, the Border Router restarts with a new PAN ID, then all nodes are powered up.
Reconnection: Occurs when a node has already connected to the network and authenticated. This typically happens in case of device reboots after a power shutdown.
Test process: all nodes are power cycled while the Border Router remains active.
The reconnection case is expected to be faster since join state 2 authentication is skipped.
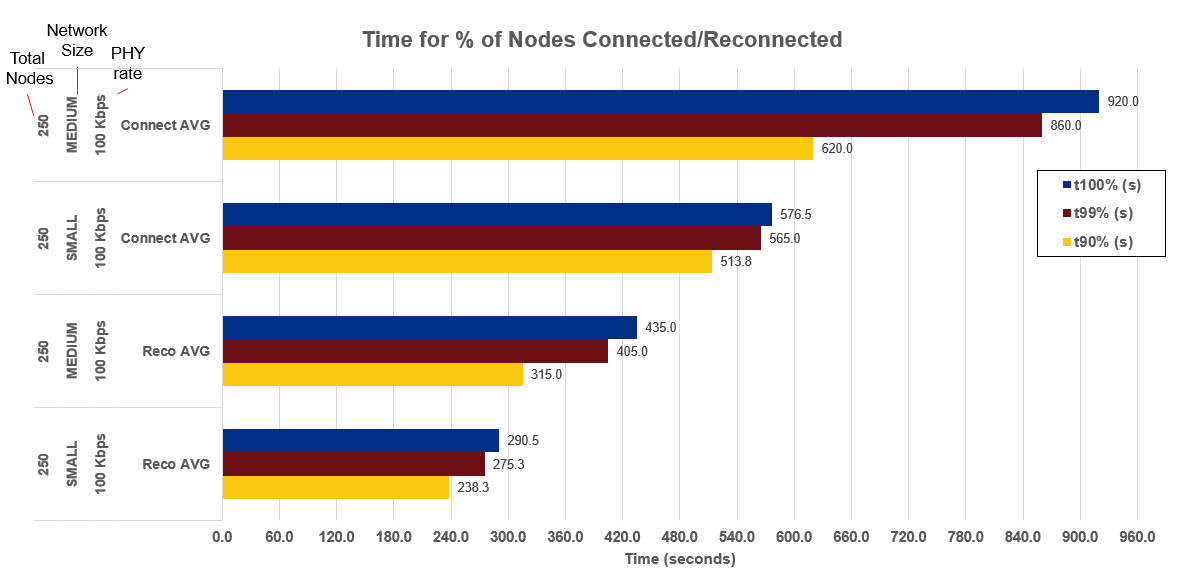
Connection/Reconnection 1000 Nodes MEDIUM 100 kbps#
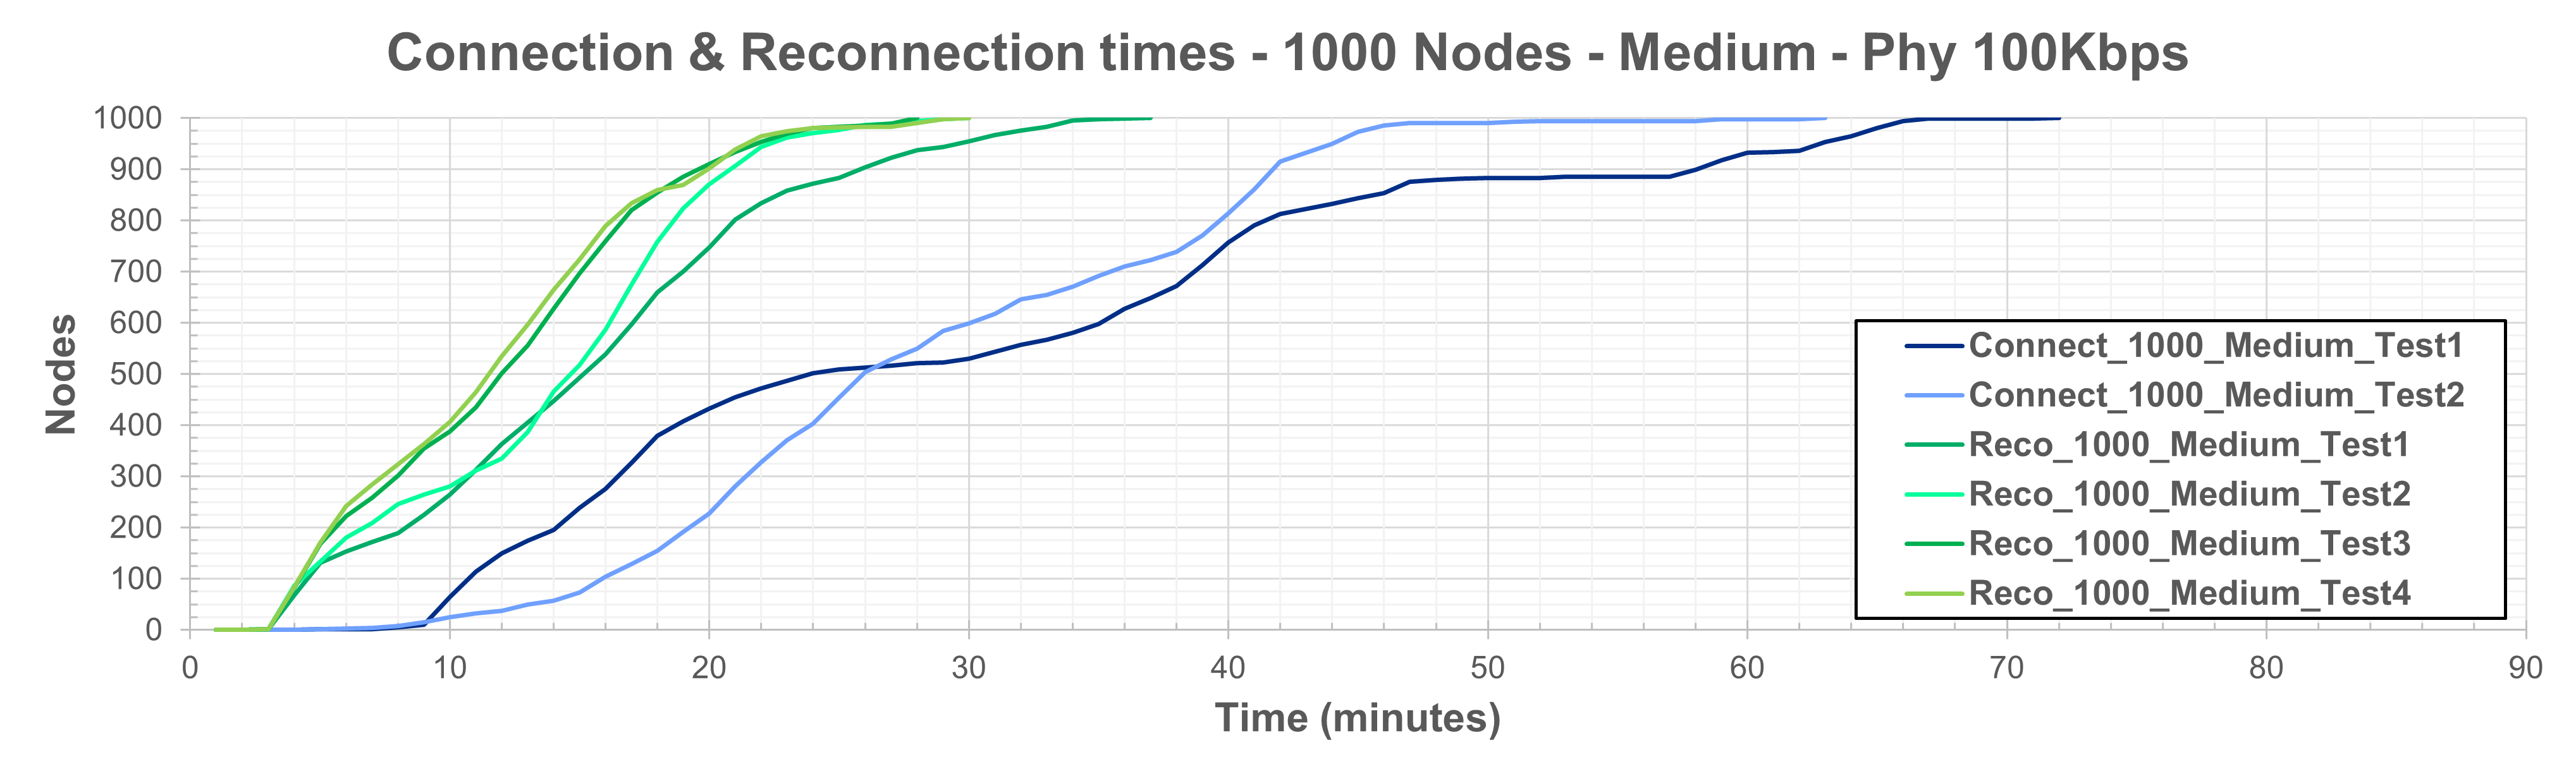
With network size MEDIUM:
First device to connect takes approximately 4 minutes
First device to reconnect takes approximately 2 minutes
Network size defines connection parameters. The larger the network, the more connection timing parameters must be increased to avoid congestion.
Example:
SMALL: Imin_PA = 15 s, Imax_PA = 60 s (same for PAS, PC, PCS)
MEDIUM: Imin_PA = 60 s, Imax_PA = 960 s (same for PAS, PC, PCS)
This means that in MEDIUM, fewer PAS, PA, PCS, and PC messages are sent per node across the network. It reduces load on the air but adds latency in detecting PA/PC messages and initiating the join or rejoin process.
Connection/Reconnection 250 Nodes MEDIUM/SMALL 100 kbps#
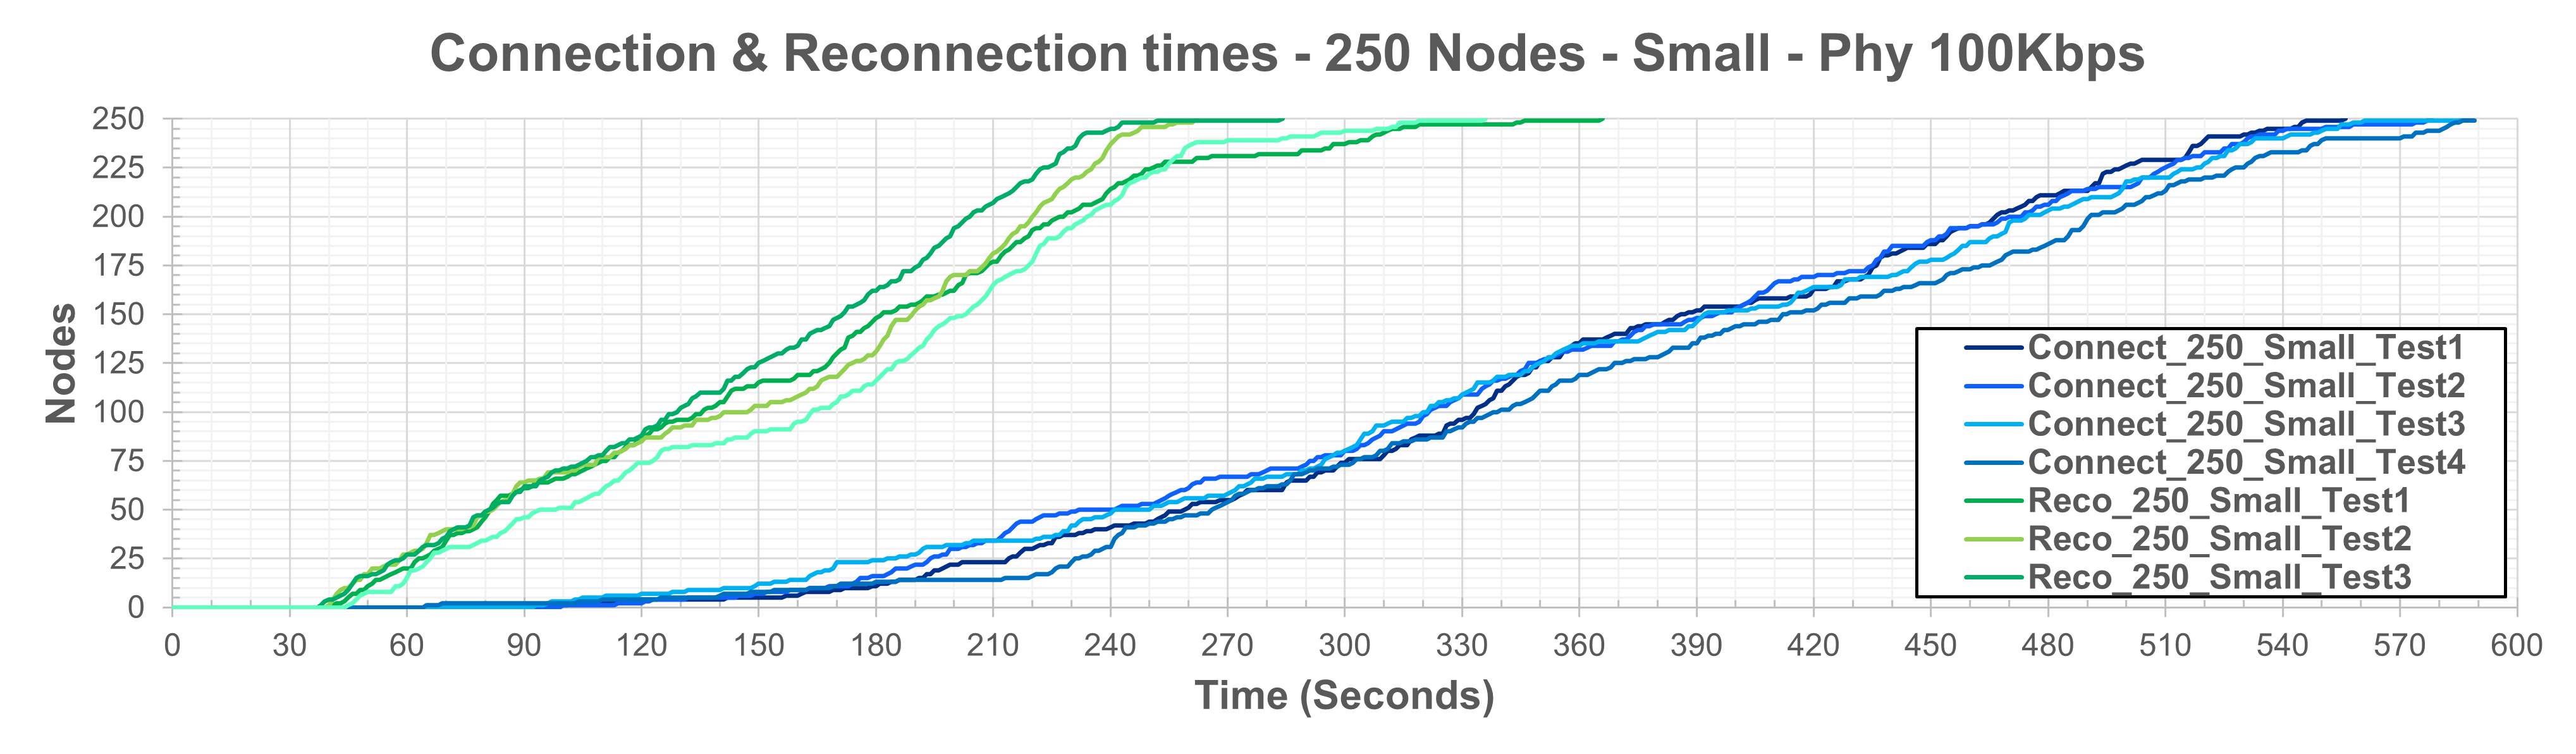
With network size SMALL:
First device to connect takes approximately 1 minute
First device to reconnect takes approximately 40 seconds
Connection 500 Nodes MEDIUM vs PHY rate#
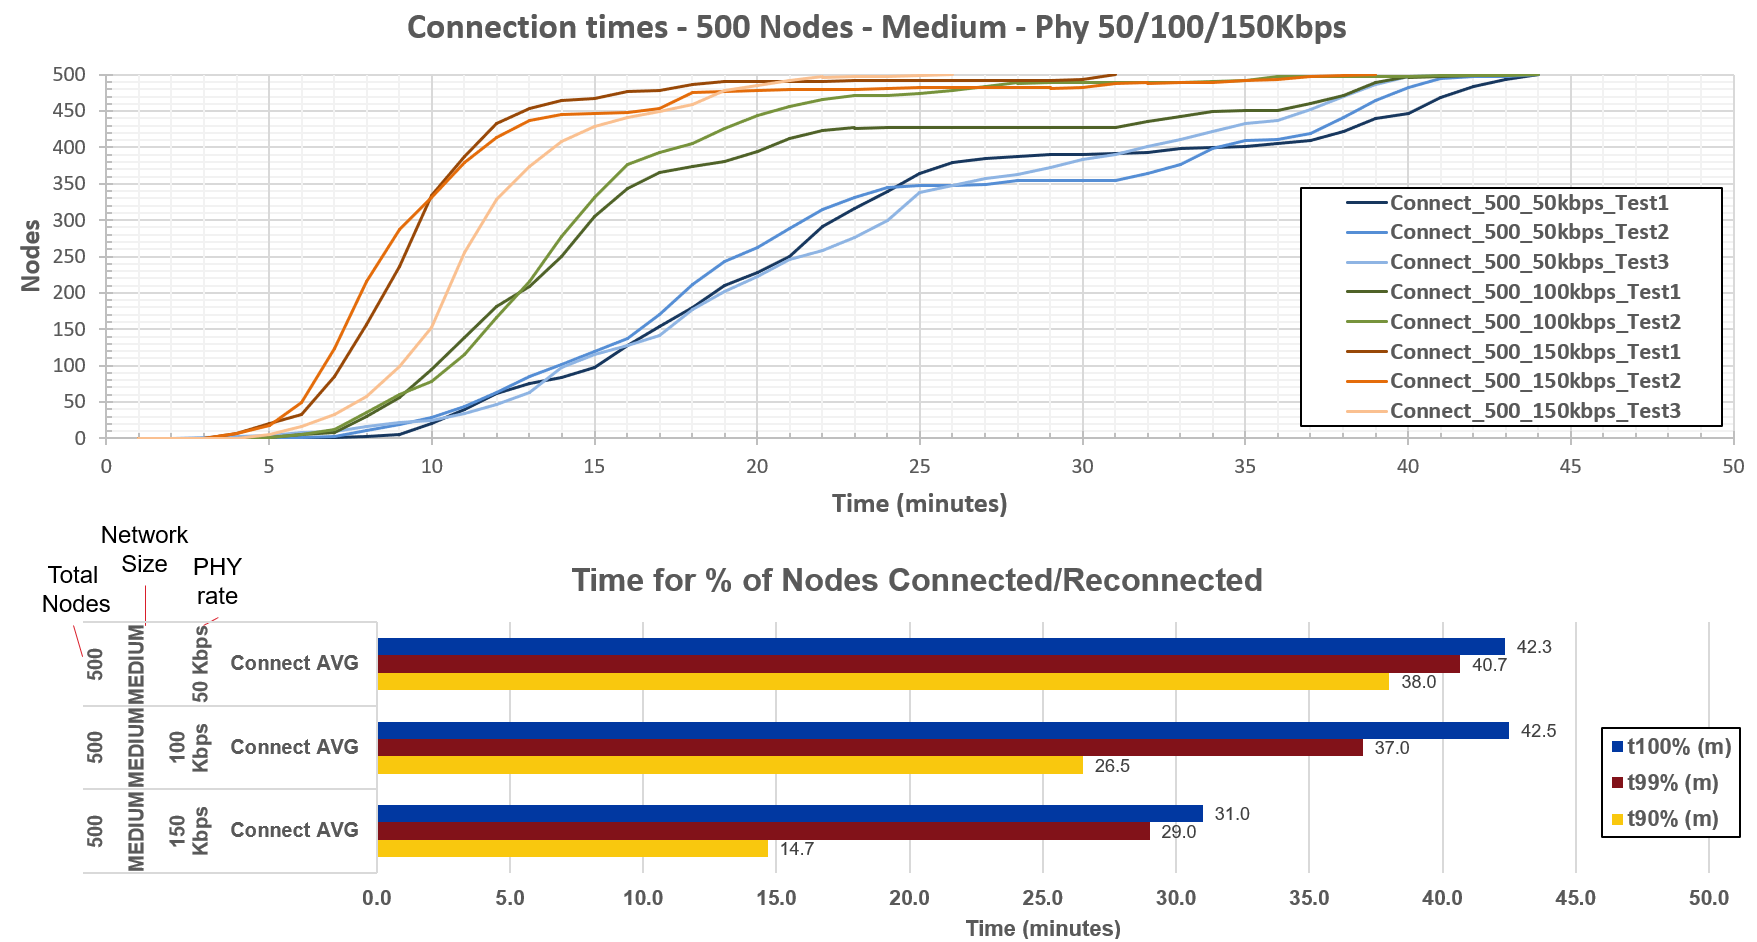
With the same connection parameters (network size), PHY rate has a significant impact on connection and reconnection timing. A higher bit rate reduces the time required to propagate the same information. The Border Router is highly solicited during network formation; increasing the PHY bit rate helps reduce its load.
Summary Matrix Result#
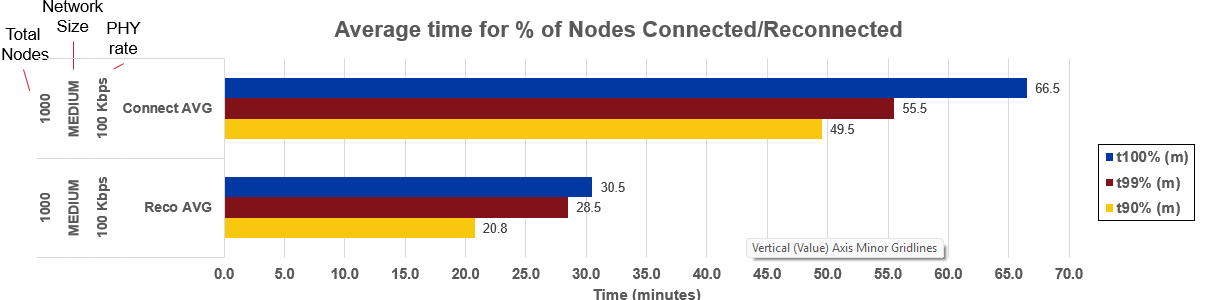
The matrix below presents the average connection and reconnection times (based on four tests for each network configuration).
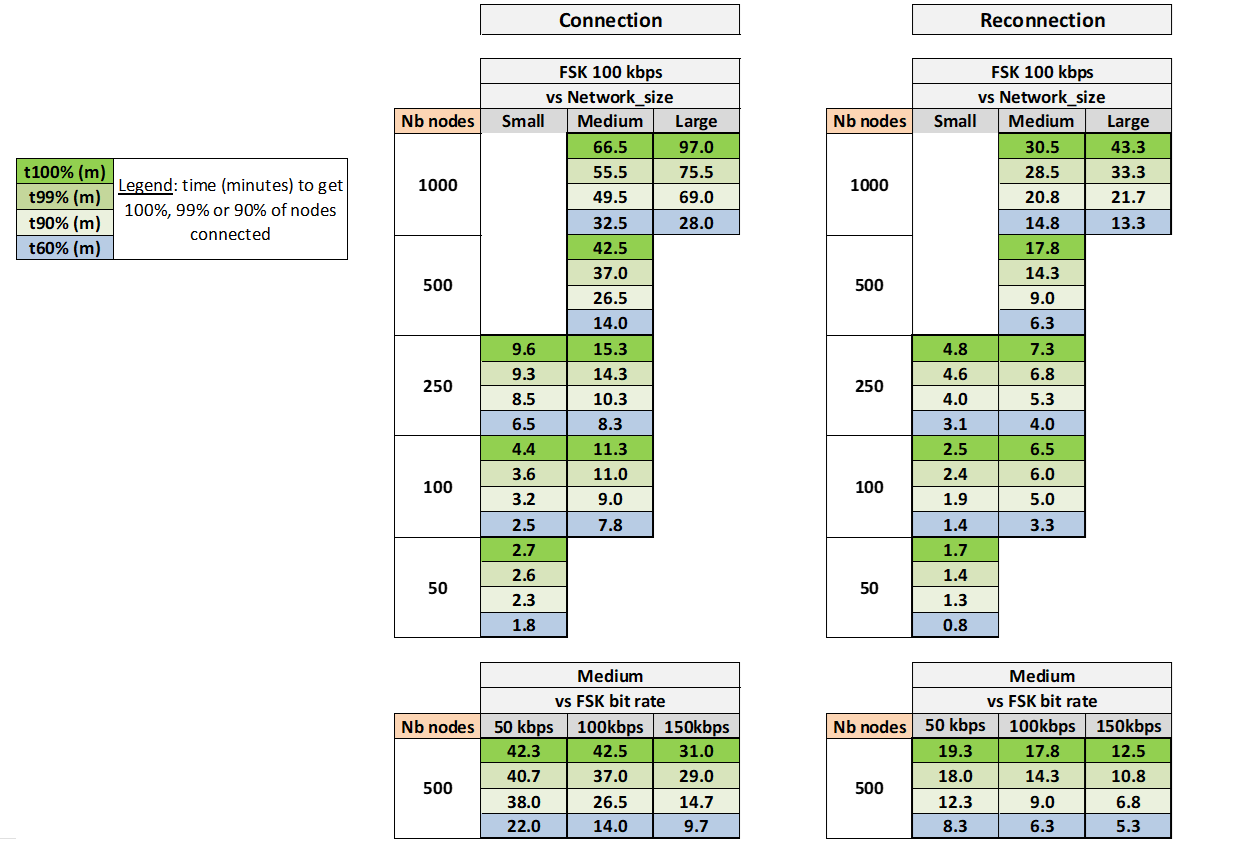
Network formation timing depends on the following factors:
Number of nodes in the network and topology
Network size (connection parameters), which significantly impacts timing
PHY bit rate
Note: Network size SMALL provides better network formation timing for networks ≤ 250 nodes. For larger networks (e.g., 500 nodes), connection parameters become too aggressive relative to the number of nodes, leading to congestion and degraded performance.
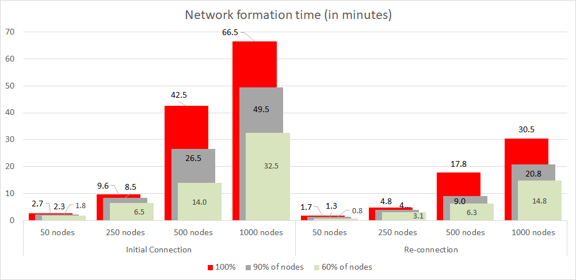
The following summary graph shows results for different network node counts with a PHY rate of 100 kbps and the optimal network size configuration selected:
Network stability#
The following table represents a metering report use case for a test performed on a 1000-node network over more than 10 days:
Running Time | Total Nodes | UDP packet RX | UDP packet lost | Success rate % | Parent Changes |
|---|---|---|---|---|---|
10d 19:05:52 | 1000 | 1035398 | 555 | 99.947% | 1063 |
Once connected, each node sent a ~500 B UDP packet to the BR every 15 minutes.
The measured application packet success rate was 99.946% over a period of more than 10 days.
Network latency#
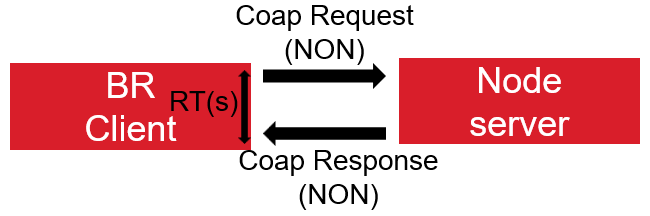
The objective is to evaluate the end-to-end latency of a CoAP transaction, from the moment a command is sent by the Border Router to a node until the corresponding response is successfully received.
CoAP requests are sent individually to each node from the BR
If a response is not received within a 4-second timeout, a new request is sent
Node responds with a 322 B CoAP payload message
All response time values presented are averages over 10 tests
The Response Time (RT) corresponds to the total elapsed time from the first transmission attempt (including the time required to send the CoAP request) to the successful reception of the response. This measurement includes any retransmissions due to timeouts, as well as network propagation and node processing delays.
Below are response time results as a function of five different networks with 50 / 100 / 250 / 500 / 1000 nodes and hop count:
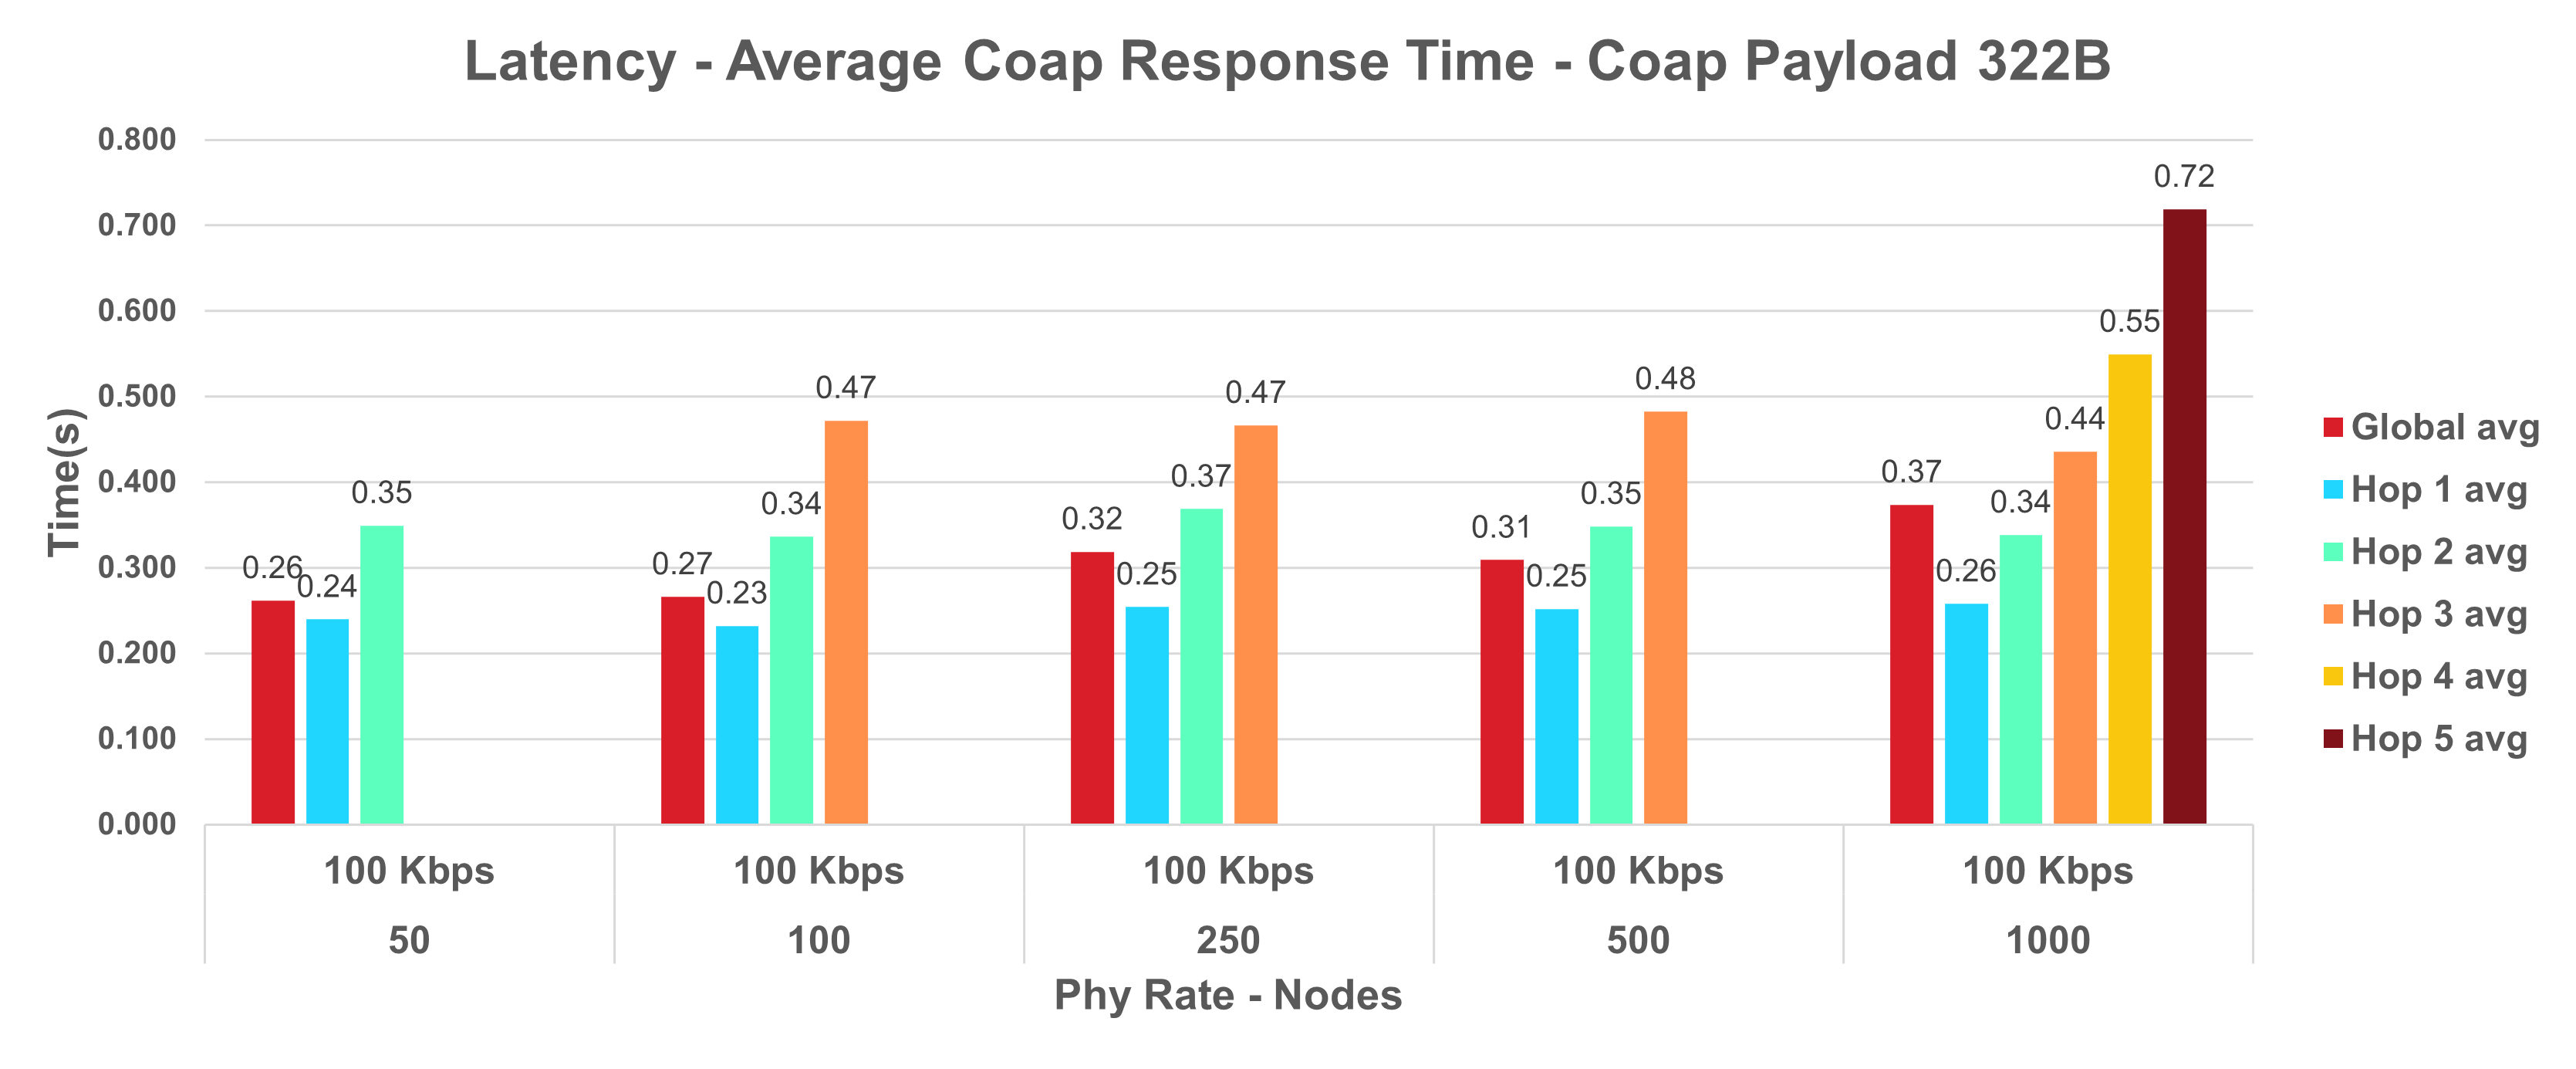
Latency is independent of node count
Latency depends on hop count
Another parameter to consider is the PHY bit rate:
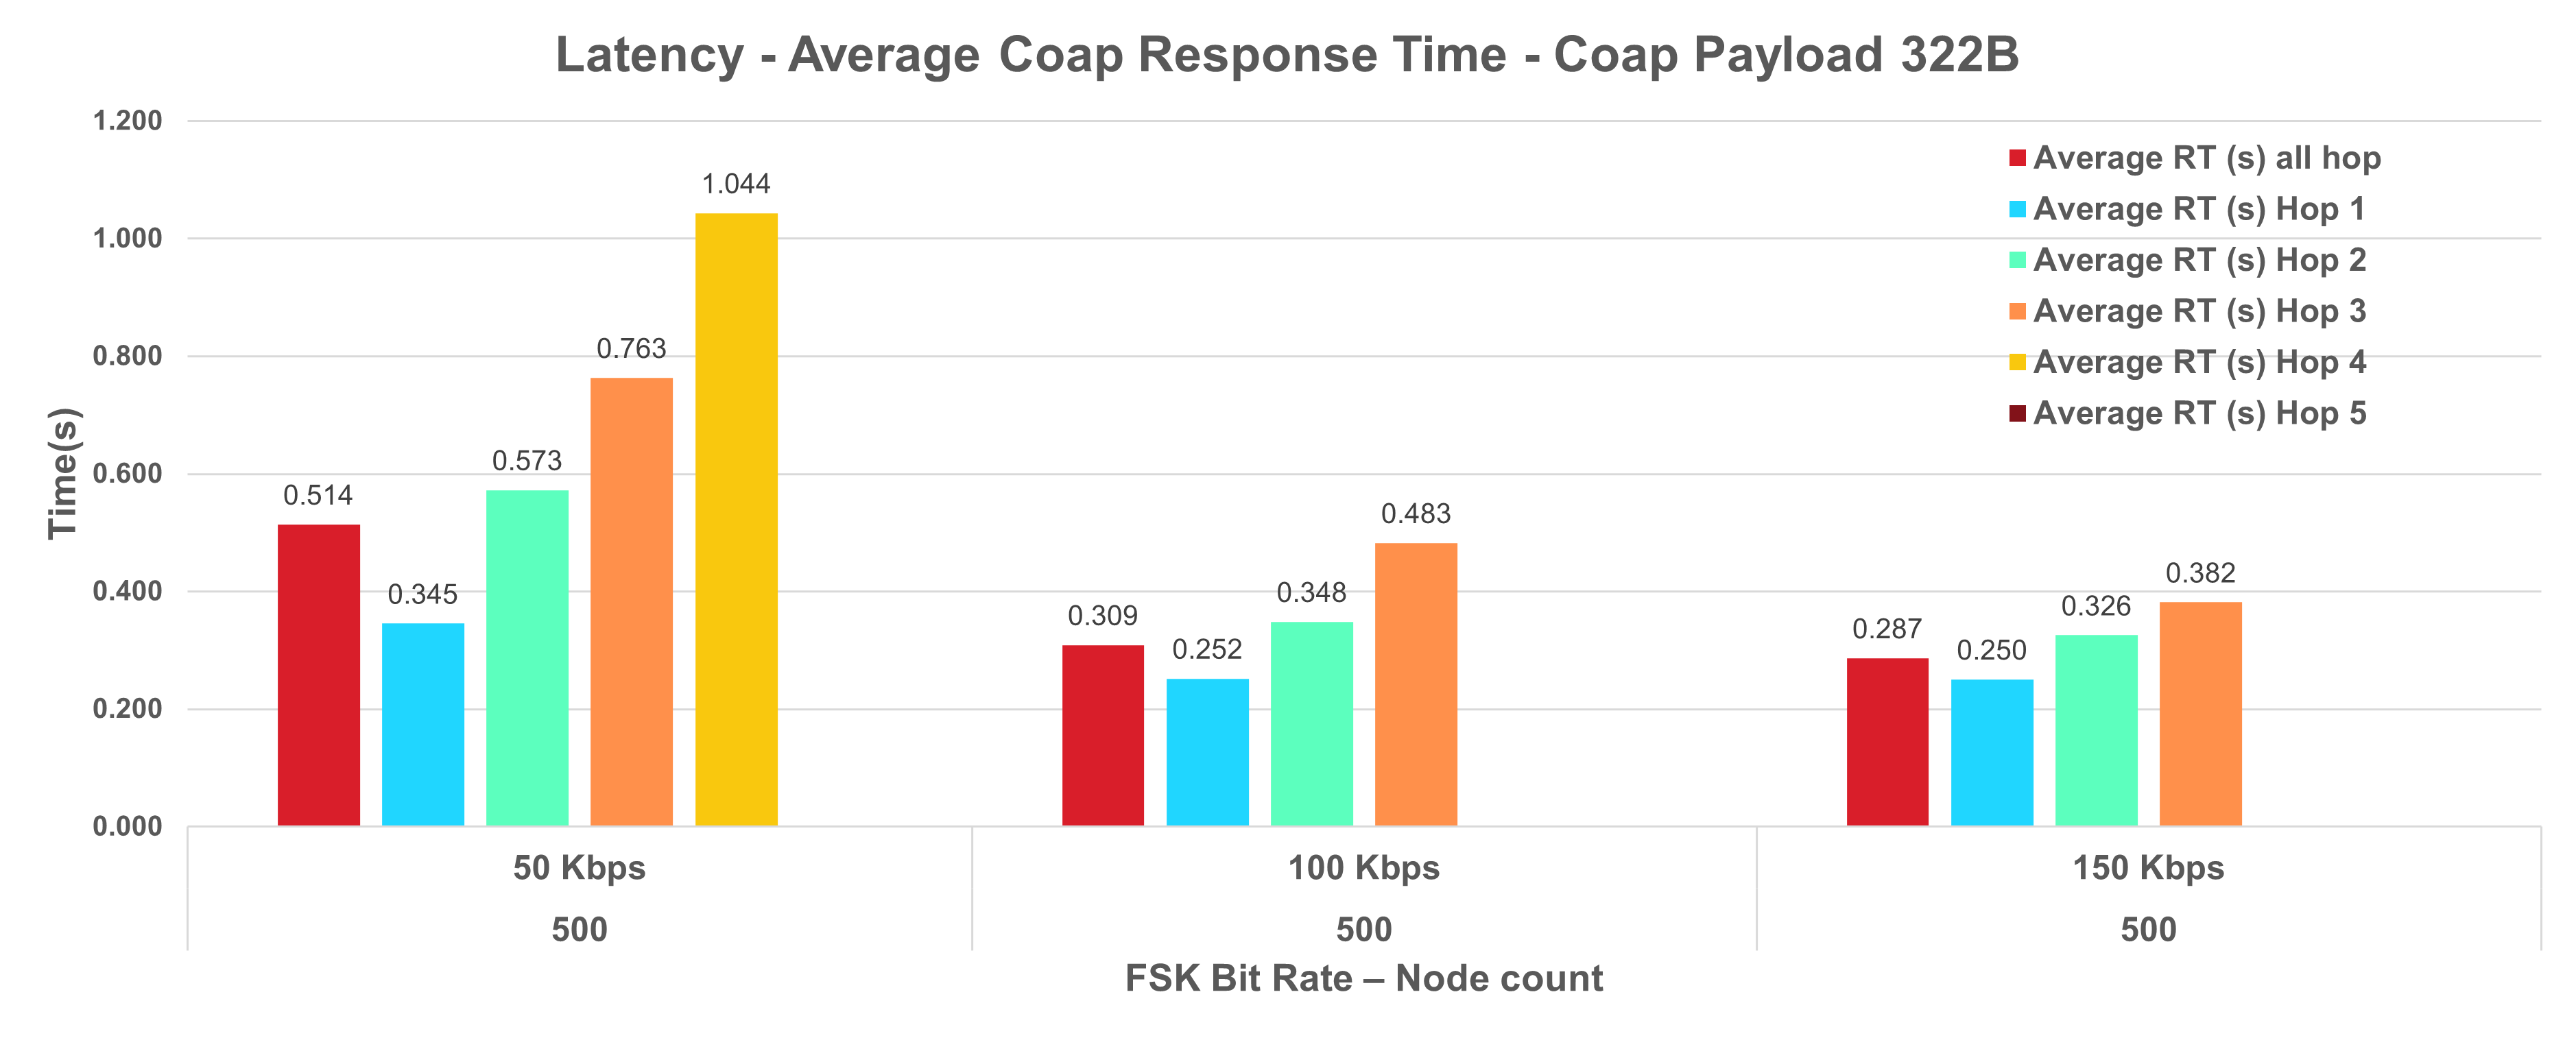
Latency depends on PHY bit rate.
Firmware upgrade OTA#
OTA unicast TFTP#
Test performed with component Wi-SUN Over-The-Air Device Firmware Upgrade (OTA DFU).
Setup:
1000-node network - PHY rate 100 kbps
380 KB firmware GBL (LZMA compressed)
Nodes pull firmware image from the Border Router in 1200 B chunks
Measured on ~20 nodes with different hop counts
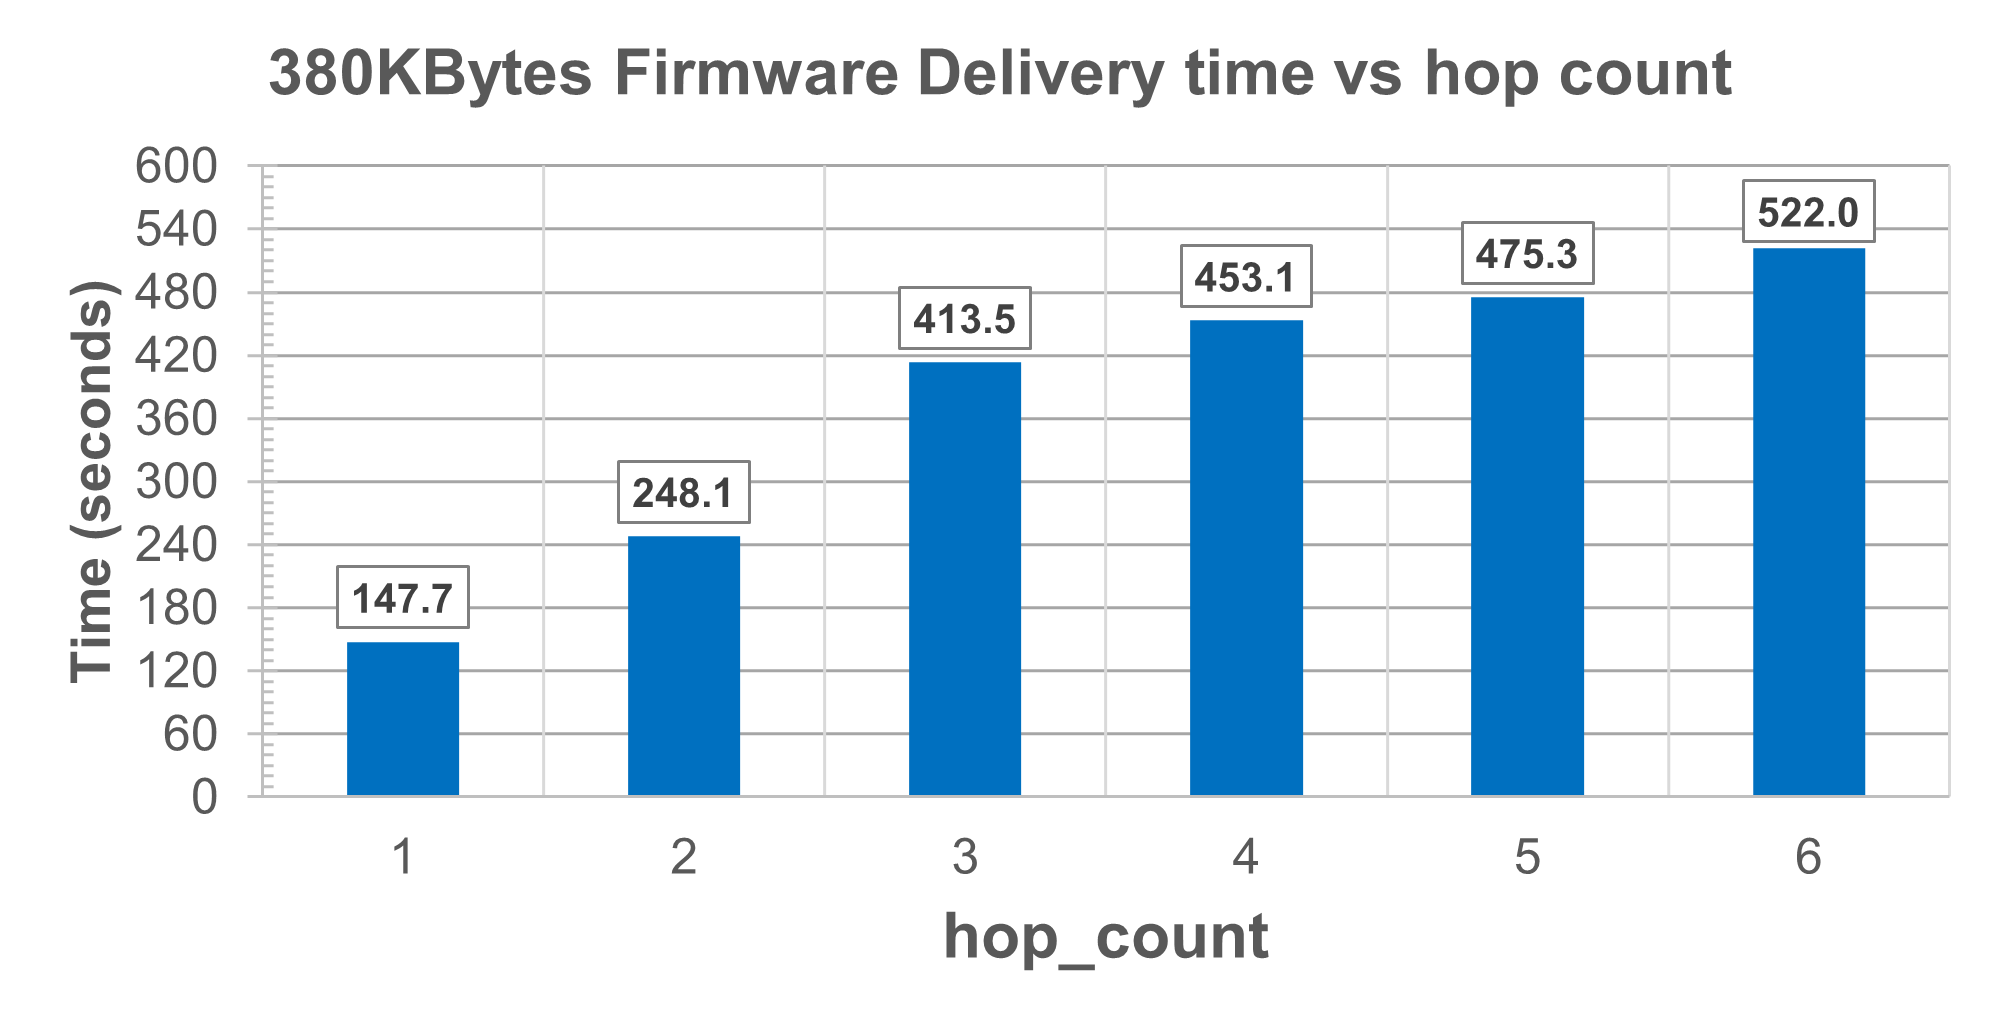
OTA using unicast TFTP ensures safe delivery of the full image to each node.
Average delivery time per node: 380 seconds → 6 minutes 20 seconds
100 nodes → ~10.5 hours
500 nodes → ~53 hours
1000 nodes → ~105 hours
Note: Firmware delivery depends on hop count and PHY rate. OTA unicast TFTP impacts other application unicast traffic.
OTA multicast#
Test performed following Node monitoring OTA multicast readme.
Setup:
1000-node network at 100 kbps PHY rate
broadcast_interval = 1020 msNetwork size MEDIUM with default MPL parameters
380 KB firmware GBL, LZMA compressed
Border Router sends 1024 B chunks by multicast every 40 seconds
After all chunks are propagated, a CoAP request is sent to all nodes to identify missing chunks
Missing chunks are then resent by unicast
Default MPL parameters:
.mpl = {
.trickle = {
.imin_s = 1,
.imax_s = 32,
.k = 8,
},
.seed_set_entry_lifetime_s = 576,
.trickle_expirations = 2,
.seed_id_type = 0,
},Performance results:
Delivery time is predictable: 380 chunks sent every 40 seconds
Total multicast delivery time: 254 minutes, or 4 hours 14 minutes
Delivery time is independent of the number of nodes being updated
Only a few chunks need to be resent to a small number of nodes by unicast
OTA Unicast vs Multicast comparison#
Unicast TFTP averaged approximately 6 minutes 20 seconds per node. Multicast takes a fixed 254 minutes for the full fleet, so the effective time per node improves as the number of target nodes increases.
Nodes Updated | Multicast Effective Time per Node |
|---|---|
40 | ~6 min 21 sec |
100 | ~2 min 35 sec |
250 | ~1 min 1 sec |
500 | ~30 sec |
1000 | ~15 sec |
Note: Broadcast uses dedicated time slots, so regular unicast traffic is NOT impacted. Delivery time in broadcast is independent of the number of nodes to update.