Starting the Trace Recorder#
Starting the SystemView Trace Recorder#
To start recording you need the host application, SystemViewer, which can be downloaded from the following link: https://www.segger.com/systemview.html
The host application will connect to the embedded target via an on board or external J-Link and will stream all trace data up to the PC.
To start a recording open the SystemViewer host application and press the F5 key or click Target -> Start Recording and you will be presented with the dialog window shown below.
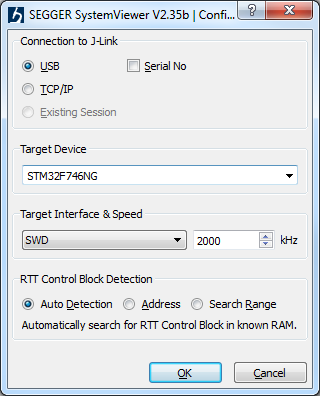
Before pressing the OK button, make sure that you have confirmed the following settings:
The Target Device name matches your embedded target and the one configured by other tools using the same J-Link session (e.g., Debugger and/or µC/Probe).
The Target Interface & Speed match the ones supported by your embedded target and the ones configured by other tools using the same J-Link session (e.g., Debugger and/or µC/Probe).
The RTT Control Block Detection setting makes an attempt to locate the symbol
_SEGGER_RTTwhere the trace data is stored using one of three methods: automatically or by manually specifying the address and range of_SEGGER_RTT.
Recording Status#
During the streaming process, you will be presented with a window similar to the one shown below.
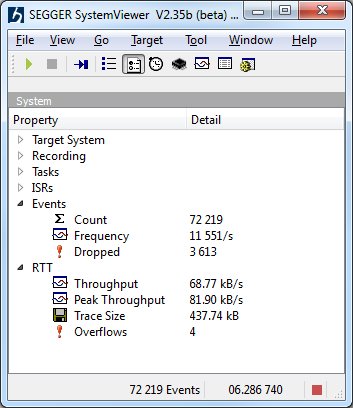
Two categories in that window, Events and RTT, will display any potential Dropped Events due to Overflows in the communication.
Overflow events occur when the SystemView RTT buffer in the embedded target is full.
This can happen due to the following reasons:
J-Link is kept busy by another application using the same J-Link session and cannot read the data fast enough.
The embedded target interface speed is too low to read the data fast enough.
The embedded application generates too many events to fit into the buffer.
To prevent this:
Minimize the interactions of the debugger with J-Link while the embedded target is running. (i.e., disable live watches)
Select a higher interface speed in all instances connected to J-Link. (e.g., The debugger, µC/Probe and SystemViewer)
Choose a larger buffer size for SystemView. (1 - 4 kByte)
Run SystemViewer stand-alone without a debugger and/or µC/Probe.
Further Reading#
For additional and more detailed coverage of SystemView refer to SEGGER SystemView Documentation.