Next Steps#
Multi-Node Energy Profiler#
Multi-Node Energy profiler is an add-on tool, with which you can measure the energy consumption of your device in runtime. You can easily find peak and average consumption, and check for sleep mode current.
To profile the current project, drop down the Profile as menu in the Simplicity IDE perspective and select Profile as / Simplicity Energy Profiler target. This automatically builds your project, uploads it to the device, and starts Energy Profiler. A new Energy Profiler perspective appears, shown in the following figure.
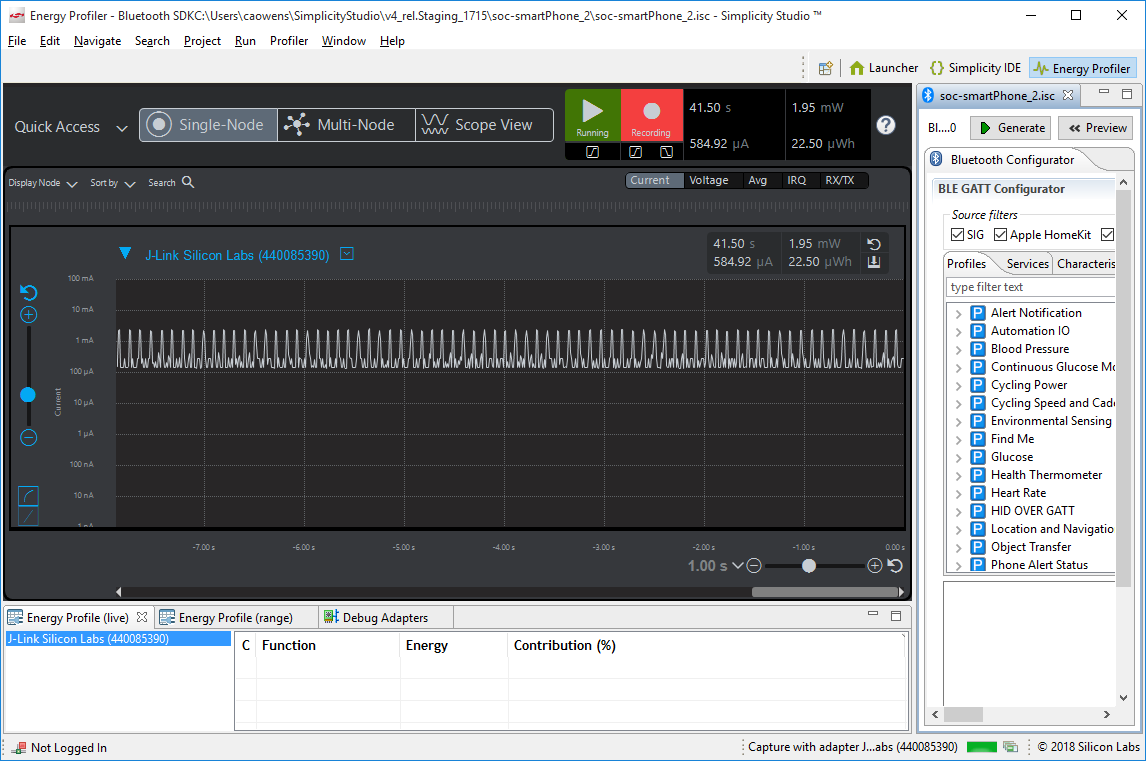
See UG343: Multi-Node Energy Profiler User’s Guide for details on how to use this tool. You can switch easily between Simplicity IDE and Energy Profiler perspectives using the Perspective buttons in the upper right corner of your current perspective.

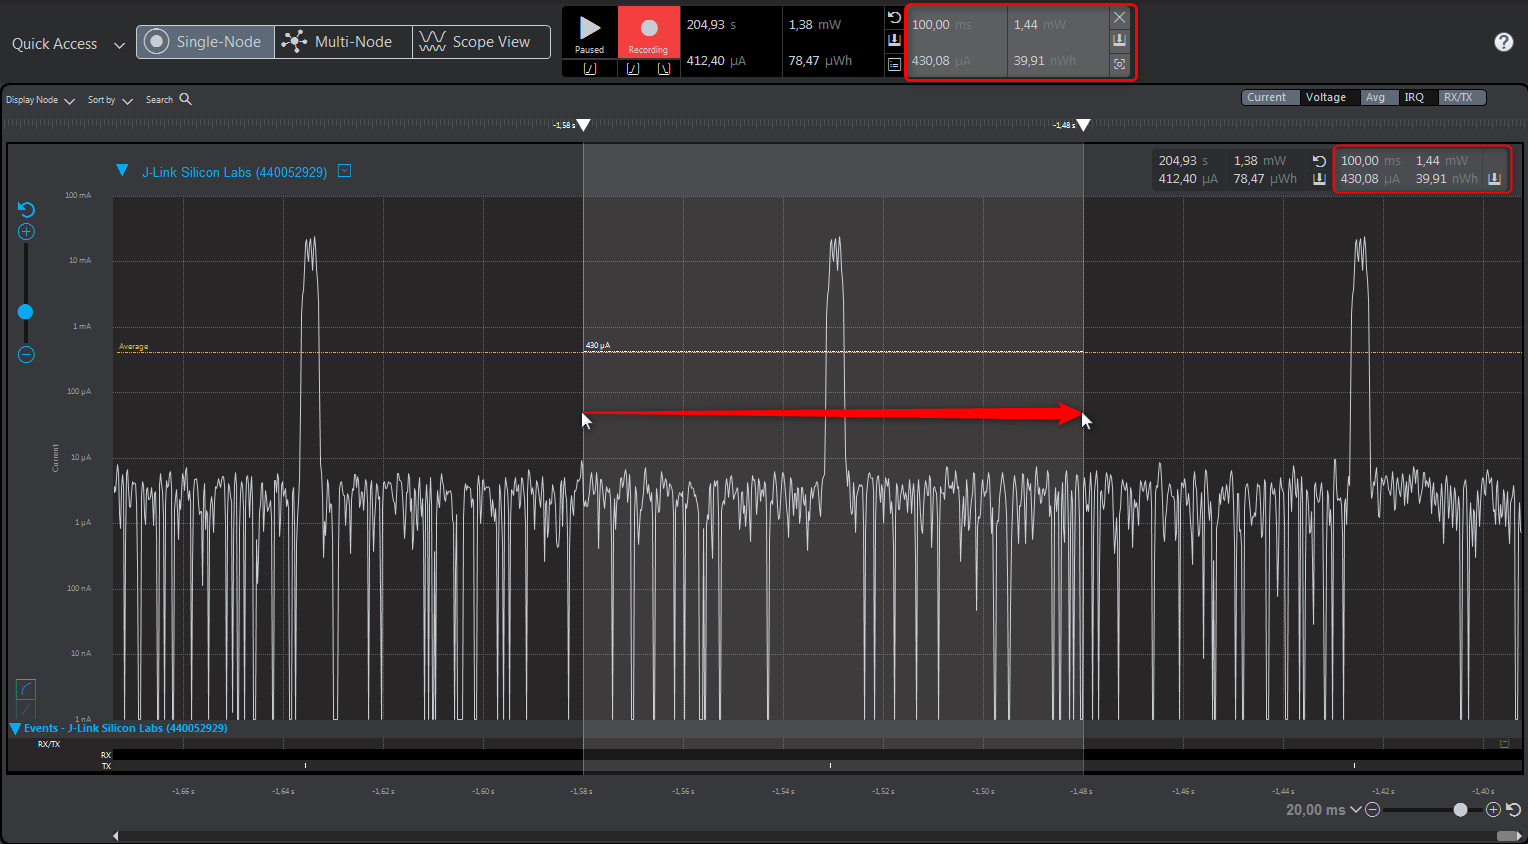
You can see peaks in the energy consumption diagram. Pause profiling by clicking the green Play button, click one of the peaks, and zoom in with time axis (y-axis) zoom until you see sufficient details. These usually represent packet transmissions . You can also see the corresponding Tx events in the Rx/Tx bar below, provided that you enabled Rx/Tx view in the upper right corner. Note that the maximum consumption may now be greater than it appeared on the diagram before you zoomed in. This is because in zoomed-out mode, the displayed values are averaged. If you need exact values, always zoom in. To measure average consumption, click and drag your mouse over a time interval. A new window appears in the upper right corner showing consumption information for the given interval.. Overall average is measured as well, but this is influenced by transient events.
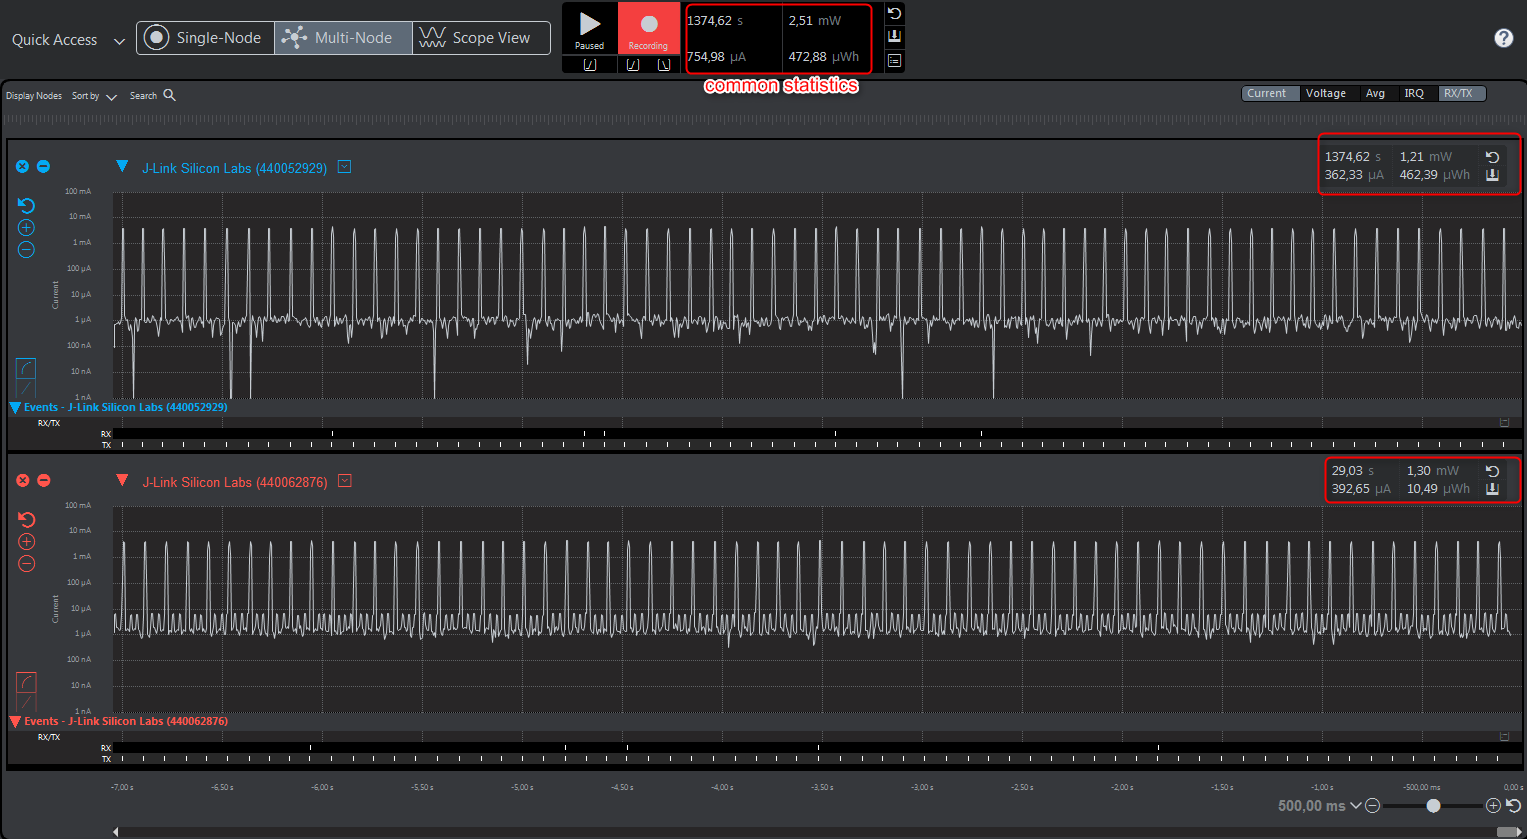
Multi-node Energy Profiler is also able to simultaneously measure the consumption of multiple devices. To start measuring a new device click the Quick Access menu (upper left corner) and select Start Energy Capture. To stop measuring, click the Quick Access menu, and select End/Save session.
To learn more about how to use this tool, see UG343: Multi-Node Energy Profiler User’s Guide.
Network Analyzer#
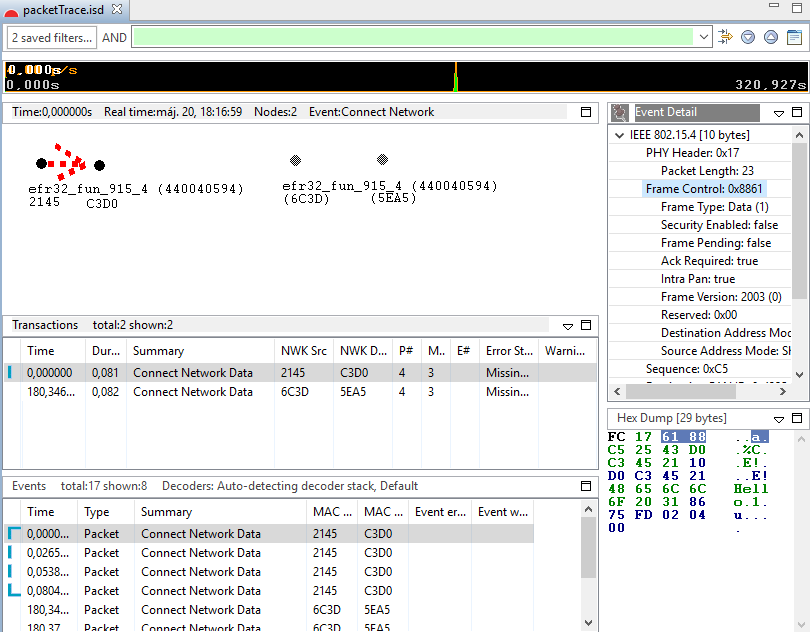
Silicon Labs Network Analyzer is a packet capture and debugging tool that can be used to debug connectivity between Wireless Geckos and other devices. It significantly accelerates the network and application development process with graphical views of network traffic, activity, and duration.
The Packet Trace application captures the packets directly from the Packet Trace Interface (PTI) available on the Wireless Gecko SoCs and modules. It therefore provides a more accurate capture of the packets compared to air-based capture.
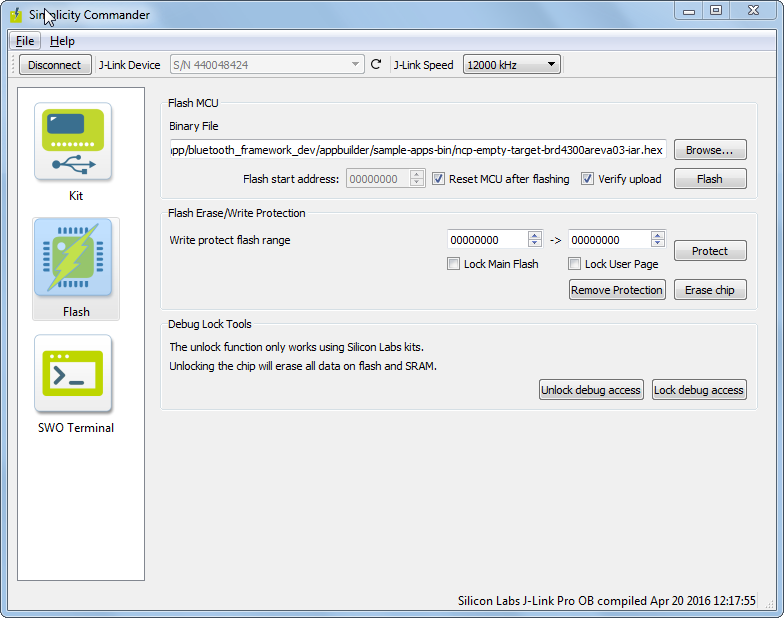
Simplicity Commander#
Simplicity Commander is a simple flashing tool, which can be used to flash firmware images, erase flash, lock and unlock debug access, and write-protect flash pages via the J-Link interface. Both GUI and CLI (Command Line Interface) are available. See Simplicity Commander Reference Guide for more information.