Debugging#
EFR32 Wireless Geckos, like any modern MCU, supports on-chip debugging. However, when debugging radio problems, on-chip debugging is often inadequate. Generally, the problem is that some bugs originate from the real time nature of the radio. When stopping the radio at a breakpoint, you change the behavior of the target. Also, you might need information from multiple targets at the same time. In this article, we recommend RAIL/EFR32 debug techniques for these problems as well as other RAIL-specific debug features.
RAILtest#
While the original goal for RAILtest was to test the RAIL library, it can be a useful tool for software development as well. In most cases, you probably want to concentrate on either receiving or transmitting, and need something to play the role of the other side. RAILtest can be simply used for that. Just set up the desired config, and it will immediately start in receive mode, printing the received messages with timestamps (useful for checking synchronized transmits). It doesn't just print; it has a command line interface to change almost anything in RAIL. Some of the most useful commands for testing:
rx 0turns off the radio, whilerx 1reenables it in receive modetx <N>sends N message or if N=0, it will send messages until you calltx 0againsettxdelay <N>changes the delay between transmitted packetssetchannel <N>changes the channel to Nsetconfigindex <N>will change the radio config to the given number in a multi-PHY setupstatusprints a statistics (e.g., number of received packets) since the device bootedresetcounterszeroes out the statistics for thestatuscommandsetrxoption 3can be used to disable CRC check whilesetrxoptions 0reenables itsetfixedlength <N>sets the configured packet length to N, for both Tx and Rx, even if the radio config is variable lengthsettxpayloadcan change the packet RAILtest transmits. The first parameter is the offset and all following parameters will be written continuouslysettxlength <N>changes how many bytes will be written into the Tx FIFO before transmission (note that it does not actually change the transmitted length)settxtransitionsandsetrxtransitionscan be used to configure automatic state transitions. Do disable going back to Rx, call it both with the argumenti i(i as idle)settxtone 1transmits an unmodulated carrier on the channel untilsettxtone 0is calledgetrssiprints out the current RSSI measured on the antennastartavgrssi <N>measures RSSI for N µssettxstreamcan be used to transmit various periodic modulated signal, including PN9 pseudorandom and '01' patternsetgpiooutpincan be used to drive a pin low or high, e.g., to drive an external PA. For example,setgpiopinoutpin C 3 0will drive portC3 downsetdebugsignaloutputs an internal debug signal to GPIO, this is discussed in detail belowresetresets the part
For further details, refer to RAILtest User's Guide.
Debugging with SWD#
EFR32 provides SWD as the debug interface. You can use breakpoints and read register values when the MCU is halted, just like any other EFM32. However, you should be careful when using this tool for debugging the radio.
Keep in mind that the radio is fast; if you put a breakpoint to the RAIL event handler, you can stop the MCU while it's receiving/transmitting a packet, which could result in bugs that normally wouldn't happen, e.g., the timestamps could be completely wrong, or you can run into buffer overflow/buffer underflow events.
You could also see some strange phenomena when debugging the radio; that is, you might see that the values stored in the memory have changed, even though the MCU is halted. That is caused by the radio co-processor of EFR32 (sometimes called sequencer), which is used to help with time-critical event handling of the radio, and shares some memory with the main MCU.
Generally, we would recommend not putting breakpoints into the RAIL event handler (of course, it is fine to do it if you don't care about execution after the breakpoint); set temporary flags instead and stop the application in the main loop when it's safe to check the values. Another good technique is to put past events into a queue:
volatile RAIL_Events_t eventQueue[5];

void sl_rail_util_on_event(RAIL_Handle_t rail_Handle, RAIL_Events_t events)
{
  // Handle events
  for(int i=1;i<5;i++){
    eventQueue[i-1] = eventQueue[i];
  }
  eventQueue[4] = events;
}
This helps a lot to figure out the flow that resulted in the problem you're debugging.
Assertion#
RAIL provides an assertion mechanism. For example, if you try to set a channel
on a frequency that is not available from the radio configuration, you'll get a
RAIL_ASSERT_FAILED_SYNTH_VCO_FREQUENCY assert. If RAIL Utility, Callbacks
component is installed, these assert will be printed to stdout by default. You
can catch these asserts by overriding sl_rail_util_on_assert_failed weak
function.
It's a good idea to stop normal operation on assert - in a production
application, you probably want to reset from it. If you put a breakpoint in
sl_rail_util_on_assert_failed, you can also see the callstack of the assert,
where you might not understand all levels (as part of it is probably in the
closed source library), but at least you can see the original source of the
assert.
Note that if nothing implements sl_rail_util_on_assert_failed, it defaults to
the rail-lib implementation, which is an infinite loop. Unless you have a
watchdog, this can be harmful in production.
Debugging with GPIOs and PRS Channels#
You probably already used this technique to debug time-critical problems: toggle
a GPIO when something happens, and use a logic analyzer or an oscilloscope to
analyze it. EFR32 can help further with radio specific PRS (Peripheral Reflex
System) channels that are wired to GPIOs. If a GPIO is configured for a given
PRS signal, it will go high when the signal is active; i.e., if you configure
PRS_RAC_TX to a GPIO, the signal will be high during transmission. You can
find a list of the available radio PRS signals below.
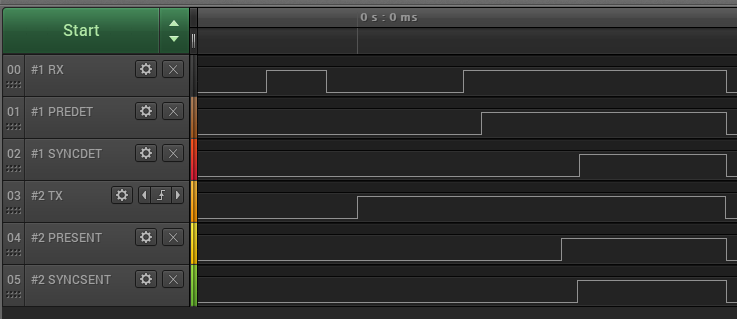
PRS signals can be extremely useful when working on multiple devices:


In the logic analyzer capture above (of a PRS-modified duty cycle example), you can see that device 2 starts transmitting, and how device 1 locks on that signal.
PRS signals also can be used to measure state transition times, which is often
important in time-critical applications. Note, however, that even though the
RXSTATE signal is driven high, the radio and RAIL could still need some time
to complete the state transition, so it might be possible that you can't detect
a signal at the beginning of the Rx window, or you're already leaving Rx mode
when an event is triggered, making it useless. The magnitude of this error
however is small only a few µs.
Setting up PRS Signals with PRS Debug Signal Support Component#
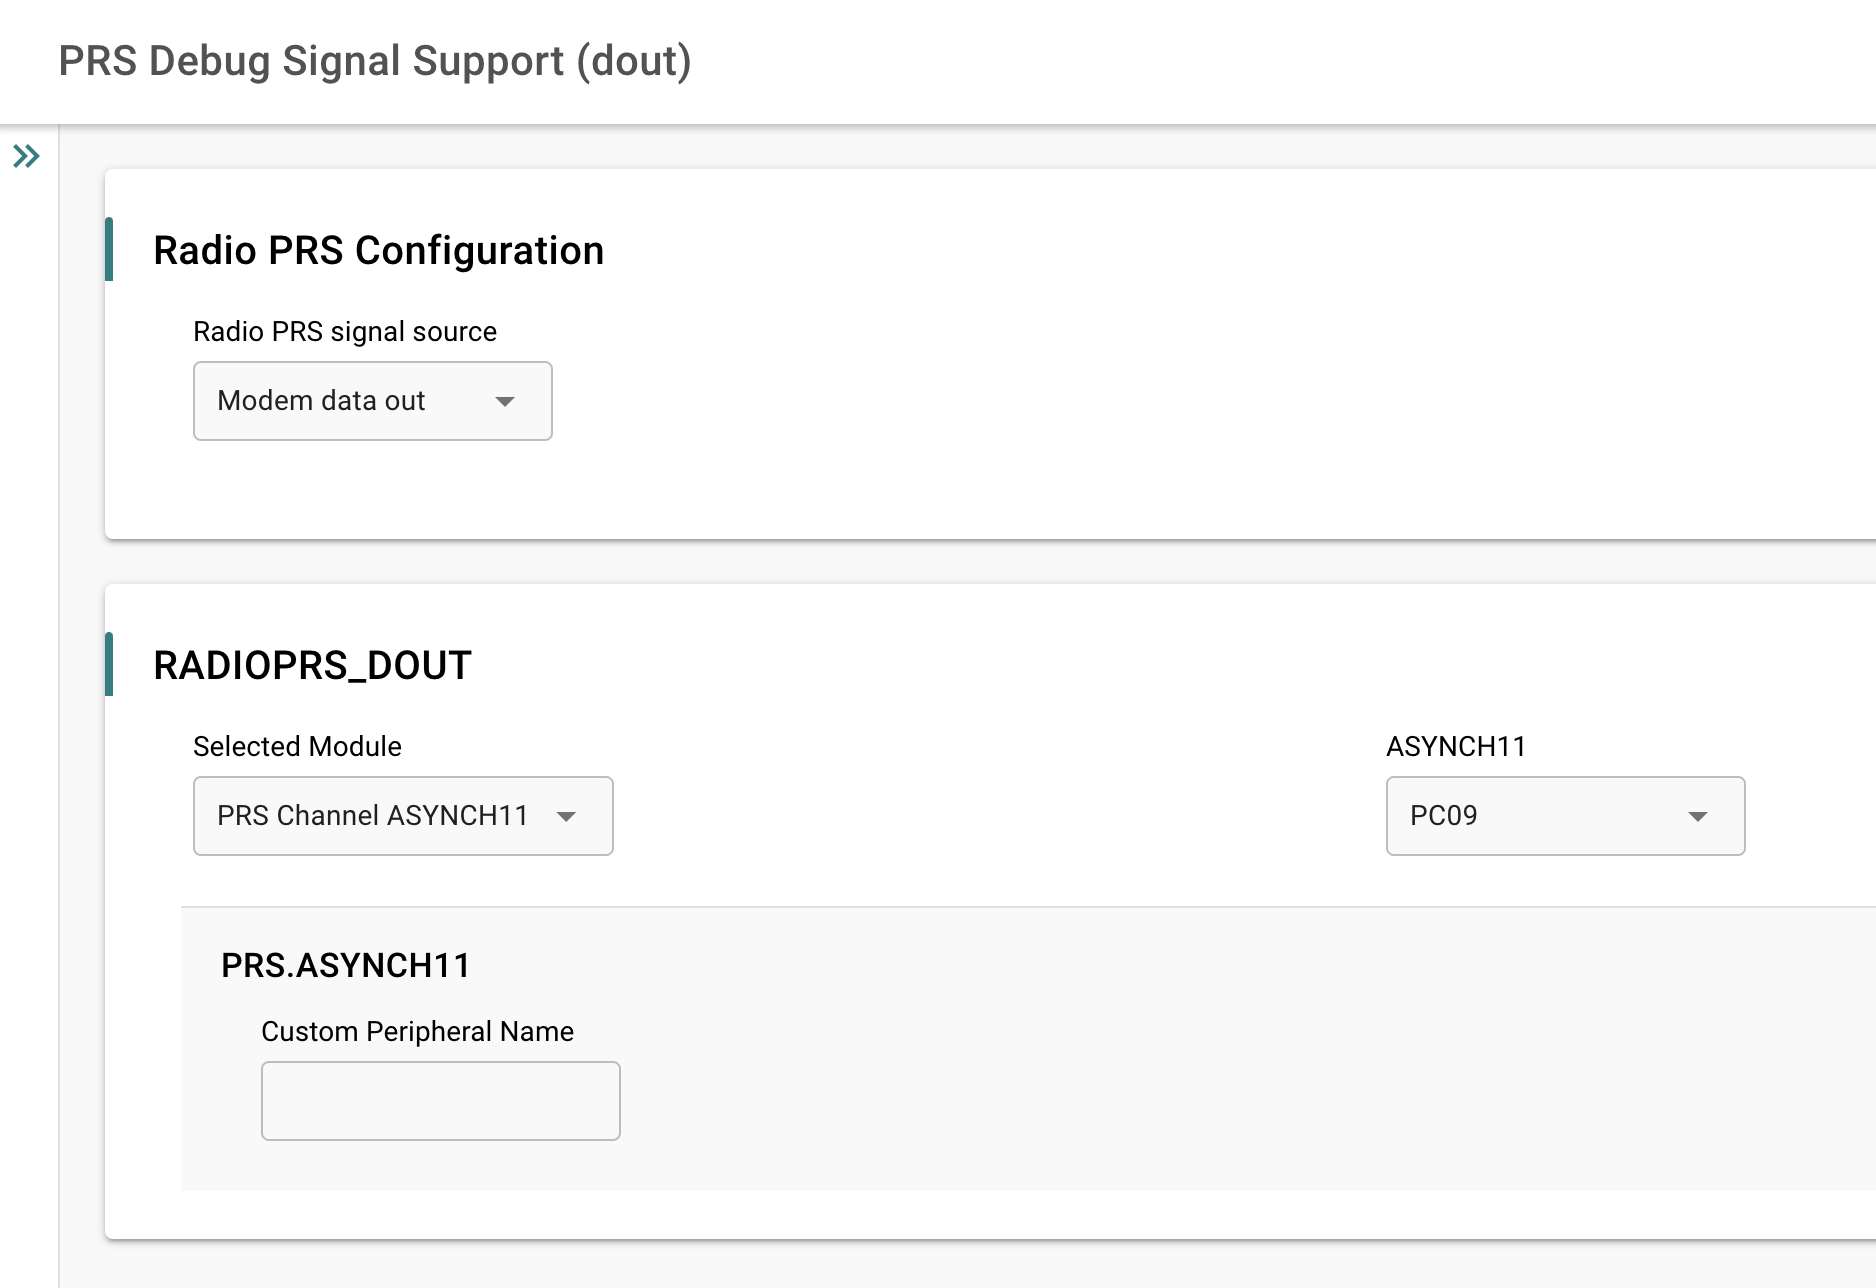
Simplicity Studio 6's PRS Debug Signal Support (in earlier SDKs, Flex -
RAIL PRS Support) component offers an easy way to set up the radio PRS
signals. After installing the component, you can create multiple component
instances. Each instance corresponds to a PRS signal where you can select the
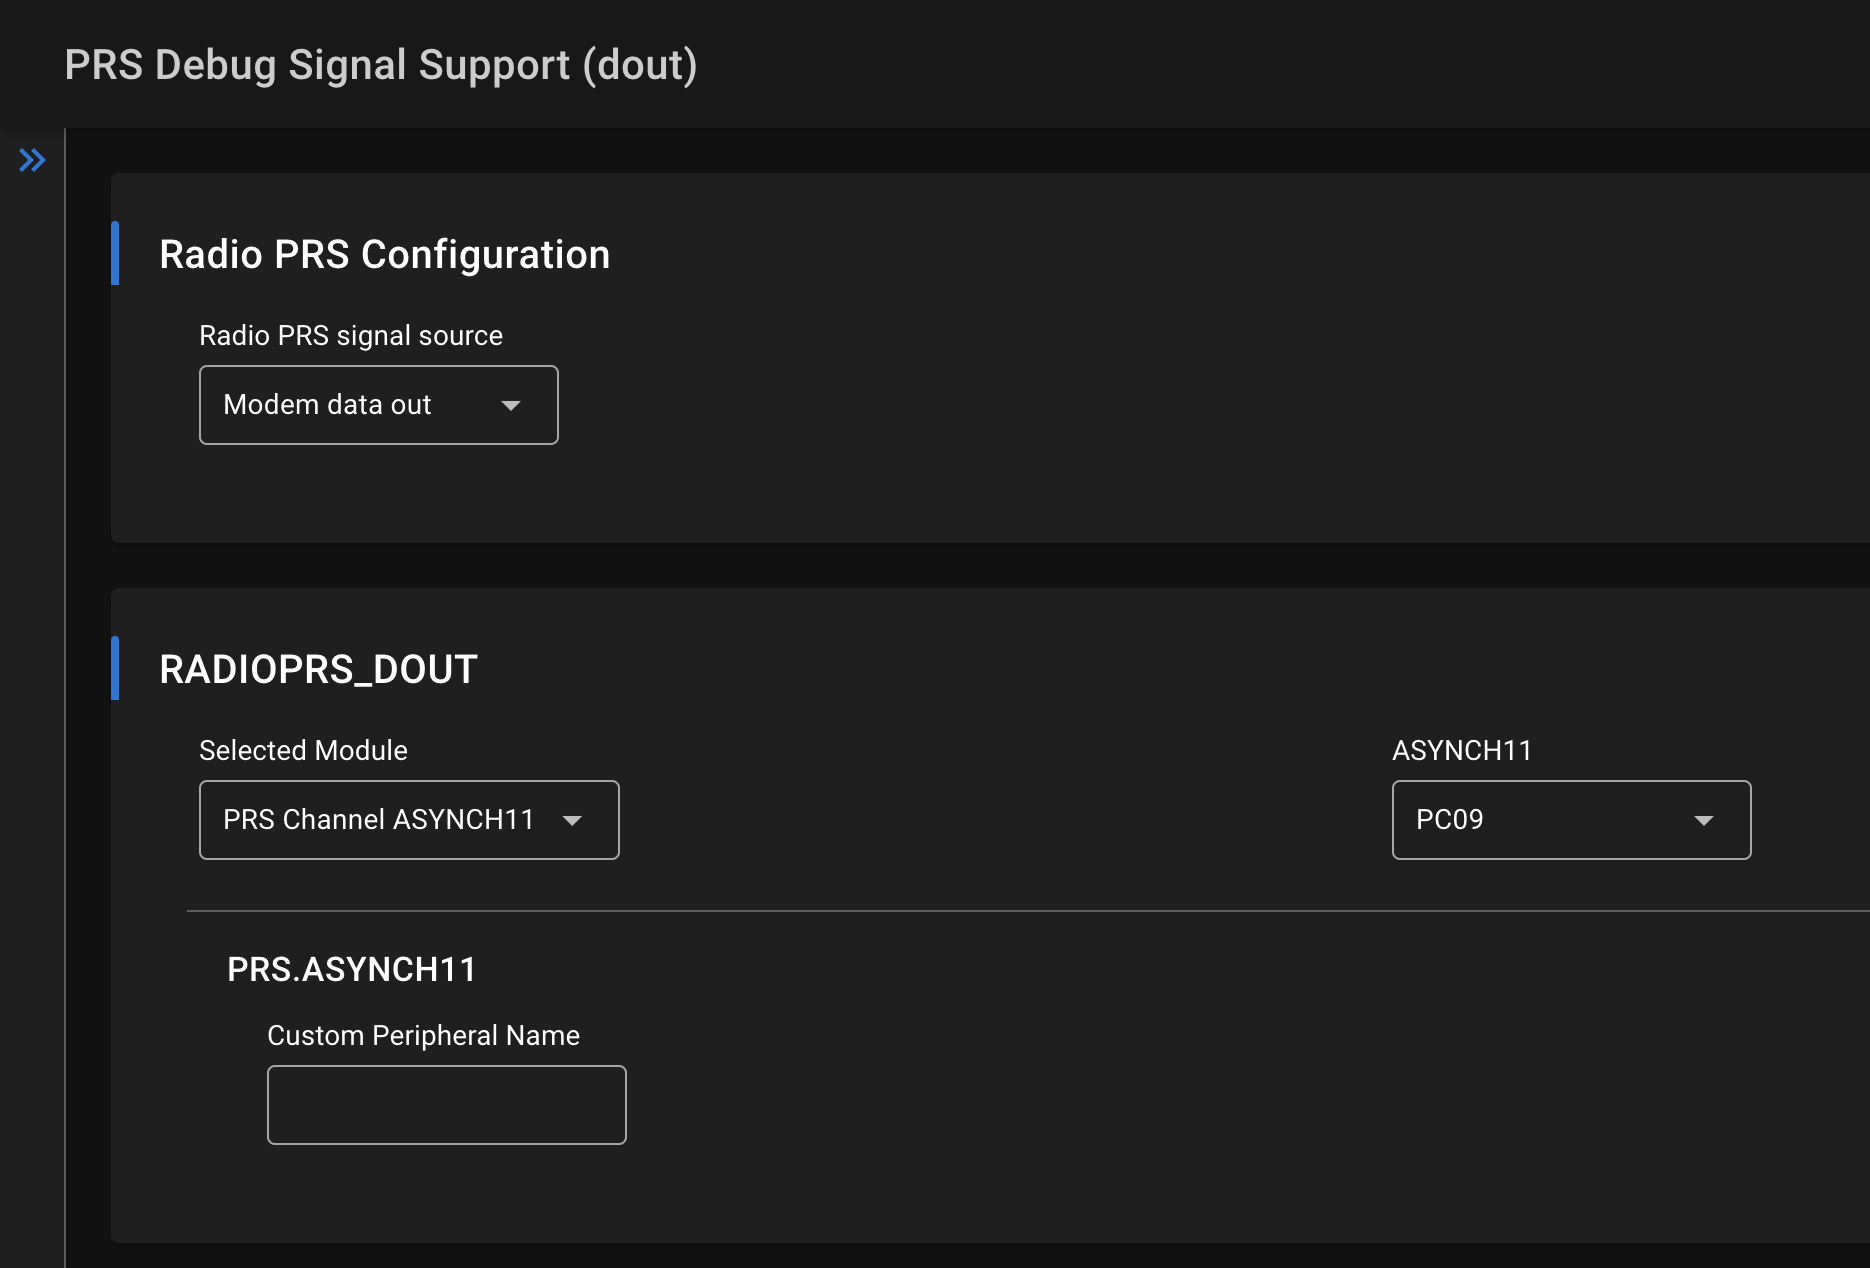
PRS signal source and the output pin. In the picture below, we created an
instance named dout and we set Modem data out to pin PC09.
(Before configuring the pin, check the pin tool, datasheet, and schematic
to ensure it does not conflict with other assigned functions.)


Note that while this article is intended for proprietary developers, the above component and the radio PRS debug signal system is available with any stack. The only possible caveat is that some PRS channels might be used with certain stacks. E.g., PRS channel 7 is usually used for RAIL timer synchronization.
Setting up PRS Signals Without PRS Debug Signal Support Component#
It can be also useful to set up the PRS signals directly from the source code. The implementation is different for the device generations.
For Series 1:
#include "em_cmu.h"
#include "em_prs.h"

// Useful Pins that work on most boards
// Pin,  Ch, Loc, Board gen     (conflict)  WSTK_P?     EXP_HEADER?
// PC10,  9,  15  Series1       (I2C)       WSTK_P12    EXP_HEADER15
// PC11, 10,   5  Series1       (I2C)       WSTK_P13    EXP_HEADER16
// PF02,  0,   2  xG1/xG13/xG14 (SWO)       WSTK_P28
// PF03,  1,   2  xG1/xG13/xG14 (TDI)       WSTK_P10    EXP_HEADER13
// PF04,  2,   2  xG1/xG13/xG14 (LED0)      WSTK_P8     EXP_HEADER11
// PF05,  3,   2  xG1/xG13/xG14 (LED1)      WSTK_P32
// PF06,  0,   6  xG1/xG13/xG14 (BTN0)      WSTK_P34
// PF07,  1,   6  xG1/xG13/xG14 (BTN1)      WSTK_P36
// PC09, 11,   2  xG12                      WSTK_P10    EXP_HEADER13
// PD09,  3,   8  xG12                      WSTK_P02    EXP_HEADER05
// PD10,  4,   1  xG12                      WSTK_P04    EXP_HEADER07
// PD11,  5,   1  xG12                      WSTK_P06    EXP_HEADER09
// PD12,  6,  14  xG12                      WSTK_P08    EXP_HEADER11

// Set PRS_RAC_TX to PC10
// EXP15: PC10, Ch9, Loc15
CMU_ClockEnable(cmuClock_PRS, true);
CMU_ClockEnable(cmuClock_GPIO, true);
GPIO_PinModeSet(gpioPortC, 10, gpioModePushPull, 0);
PRS_ConnectSignal(9, prsTypeAsync, PRS_RAC_TX);
PRS_GpioOutputLocation(9, 15);
For Series 2:
#include "em_cmu.h"
#include "em_prs.h"

// PRS Channel 0-5 can be routed to port A/B and Channel 6-11 to port C/D
// Set PRS_RACL_TX to PC04
CMU_ClockEnable(cmuClock_PRS, true);
CMU_ClockEnable(cmuClock_GPIO, true);
PRS_ConnectSignal(8, prsTypeAsync, PRS_RACL_TX);
PRS_PinOutput(8, prsTypeAsync, gpioPortC, 4);
GPIO_PinModeSet(gpioPortC, 4, gpioModePushPull, 0);
Setting up PRS Signals with RAILtest#
In RAILtest, you can set up the PRS signals using the setDebugSignal serial
command. For example, to route TXACTIVE to pin PC11 use:
setDebugSignal PC11 TXACTIVEYou can use setDebugSignal help me to list available GPIOs and signals.
Radio PRS Signals#
For Series1:
Signal | RAILtest name | Summary |
|---|---|---|
PRS_RAC_ACTIVE | RACACTIVE | Radio enabled |
PRS_RAC_TX | TXACTIVE | Transmit mode enabled |
PRS_RAC_RX | RXACTIVE | Receive mode enabled |
PRS_RAC_LNAEN | LNAEN | LNA enabled for RX |
PRS_RAC_PAEN | PAEN | PA enabled for TX |
PRS_MODEM_FRAMEDET | FRAMEDETECT | Frame detected (Syncword received) |
PRS_MODEM_PREDET | PREAMBLEDETECT | Preamble detected |
PRS_MODEM_TIMDET | TIMINGDETECT | Timing detected |
PRS_MODEM_FRAMESENT | FRAMESENT | Frame sent |
PRS_MODEM_SYNCSENT | SYNCSENT | Syncword sent |
PRS_MODEM_PRESENT | N/A | Preamble sent |
PRS_MODEM_PRESENT+1 | CUSTOM_PRS 0x56 0x6 | Modem clock out |
PRS_MODEM_PRESENT+2 | CUSTOM_PRS 0x56 0x7 | Modem data out |
For Series2:
Signal | RAILtest name | Summary |
|---|---|---|
PRS_RACL_ACTIVE | RACACTIVE | Radio enabled |
PRS_RACL_TX | TXACTIVE | Transmit mode enabled |
PRS_RACL_RX | RXACTIVE | Receive mode enabled |
PRS_RACL_LNAEN | LNAEN | LNA enabled for Rx |
PRS_RACL_PAEN | PAEN | PA enabled for Tx |
PRS_MODEML_FRAMEDET | FRAMEDETECT | Frame detected (Syncword received) |
PRS_MODEM_PREDET | PREAMBLEDETECT | Preamble detected |
PRS_MODEMH_TIMDET | TIMINGDETECT | Timing detected (not valid for most PHYs) |
PRS_MODEM_FRAMESENT | FRAMESENT | Frame sent |
PRS_MODEMH_SYNCSENT | SYNCSENT | Syncword sent |
OFDMFRAMEDETECT_PRSMUXLSB | OFDMFRAMEDETECT | OFDM Frame detected (Syncword received) |
OFDMEOF_PRSMUXLSB | OFDMEOF | OFDM End of Frame |
OFDMFRAMESENT_PRSMUXLSB | OFDMFRAMESENT | OFDM Frame sent |
OFDMSYNCSENT_PRSMUXLSB | OFDMSYNCSENT | OFDM Syncword sent |
OFDMSYMBOLCLK_PRSMUXLSB | OFDMSYMBOLCLK | OFDM Symbol clock out |
PRS_MODEMH_PRESENT | N/A | Preamble sent |
PRS_MODEML_DCLK | CUSTOM_PRS 0x56 0x5 | Modem clock out |
PRS_MODEML_DOUT | CUSTOM_PRS 0x56 0x6 | Modem data out |
The last two signals are direct outputs of the modem (just before modulation for
Tx and after demodulation for RX). On Series 1 devices, they don't have proper
names, so the recommended way to access them is to increment
PRS_MODEM_PRESENT. If you are working with RAILtest, they can be accessed as
custom PRS. In this case, instead of 0x56, use:
0x26on xG1,0x56on xG12-xG14,0x2Bon xG21,0x2Aon xG22,0x29on xG23 and newer
Note that especially on Series 2 devices, some debug signals might not work as
expected, or even meaningless. PRS_MODEML_DOUT for example behaves differently
on rx depending on the radio config while PRS_MODEMH_TIMDET also depends on
the PHY but in most cases its behavior is undefined. For software debugging
however, these signals are rarely needed.
