Capturing Data and Managing Sessions#
Network Analyzer can display one or more network capture sessions. Each capture session displays the transaction and event data captured from one or more nodes. The captured data is shown in editor panes. In general, Network Analyzer captures all incoming and outgoing packet data via the selected adapters, regardless of whether the host nodes have sniffer applications. The captured data includes failed transmissions, as well as debug messages from node applications that are compiled in debug mode.
This kind of capture is called a perfect trace session. The capture nodes of a perfect trace session are not sniffers but nodes that might be running your own application that you are trying to debug. The perfect trace session compiles all incoming and outgoing data from each node in chronological real time, providing a richly-layered display of all activity within a network. A perfect trace session can be especially useful for debugging a network in development as it allows you to see every packet on the network.
Network Analyzer supports two types of capture sessions:
Live sessions display data as it is captured. The display is continuously refreshed as new data arrives. When a live session starts, it is unnamed and its data is maintained in temporary storage until you save it to a named file. Network Analyzer can capture live session data from multiple sets of adapters into the same session. You cannot, however, capture from one adapter into different sessions at the same time. You can run more than one live session at the same time.
Saved sessions contain captured data that has been saved to permanent storage in a named .isd file. You can load a saved session and analyze it at any time.
When you start Network Analyzer, it opens a new live session. Network Analyzer displays each session in an editor with its own tab. The tab of each saved session is labeled with the session's file name; the first live session is labeled Live, the second Live1, the third Live2, and so on.
You can capture data from the node of any connected Debug Adapter, from one node at a time or multiple nodes simultaneously. You can also capture all network traffic over the current channel by capturing data from a connected sniffer node.
Note: The types of data captured from a node depend primarily on the software protocol running on the node, and also the capabilities of the node's radio chip and Debug Adapter.
Starting a Capture#
Before starting a capture, open Preferences > Network Analyzer > Decoding > Stack Versions and make sure that the protocol running on the adapters is selected. If you are working in a multiprotocol environment, select 'Auto-detecting decoder stack'. A change here will not affect any active capture sessions but will apply to the next capture you start.
To start a capture:
Select one or more connected adapters. Multiple adapters are usually on the same network.
Right-click the selected adapters.
On the context menu, select Start Capture.
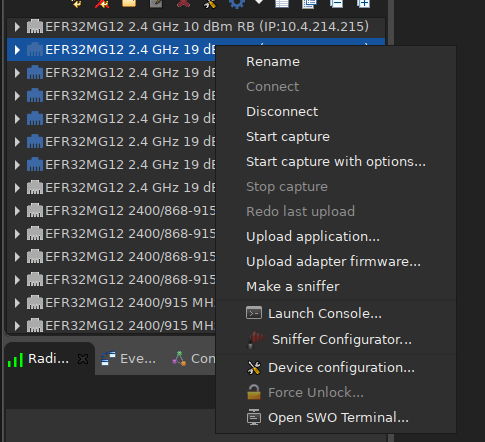
Alternatively, select File > Other Network Analyzer Actions > New Live Capture Session. This creates a new live capture session and puts it on top of the editor list.
When you start a capture on an adapter, or on multiple adapters at the same time, the live session used for the capture is assigned in one of the following ways:
If no live sessions are currently active, a new live session is created and used.
If live sessions are active, but they are not on top of the editor stack (for example, another file is opened and currently on top), a new live session is created and used.
If a live session is active and it is also on top of the editor stack, then this session will be used for capture.
Capturing with Options#
You can filter packets out of the stream during a capture. For example, you can choose to see only packets from a certain PAN ID and drop all other packets.
Select one or more connected adapters.
Right-click the selected adapters.
On the menu, select Start capture with options.
Configure options in the resulting dialog, and click OK.
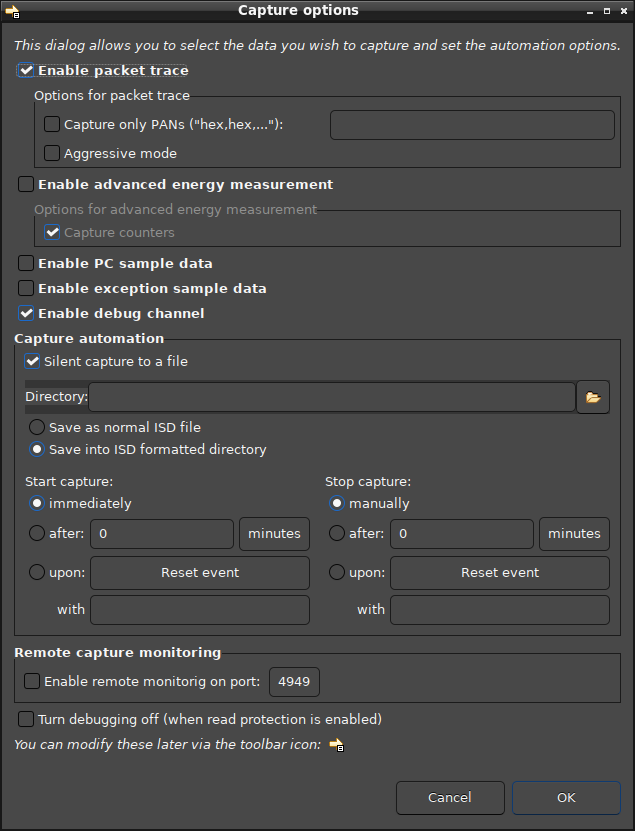
In the capture options dialog, you can set the following:
Capture only PANs: (15.4 protocols only) This filter, based on PAN ID, allows a comma-separated list of hexadecimal values.
Aggressive mode: Filters out all events that may not be or definitely are not packets.
Enable advanced energy measurement: This enables AEM packet filtering. AEM packets are used with Energy Profiler. If you turn this option on and later look at the data in Energy Profiler, you will not see any packets.
Enable PC sample data: If selected, captures diagnostic events.
Enable exception sample data: If selected, captures Java framework exceptions, which are used for deep diagnostics of possible Network Analyzer bugs.
Enable debug channel: If selected, enables capturing all other non-packet events.
Silent capture to file: If selected, performs a lengthy capture as a background task. Traffic will not show in the GUI until the capture is stopped and the file is opened. The silent capture enables you to run a capture over several days, as it does not consume memory resources, only disk space.
The start capture options specify the trigger for delayed start of capture.
immediately: No automation, capture starts right away.
after: Capture starts after a certain time or after a certain number of events.
upon: Capture starts upon Node reset, or upon an event containing a specified ASCII or byte pattern.
The triggers for starting and stopping capture on node reset work only if you have DEBUG level NORMAL turned on for the node that you are capturing from. With the debug level set to Normal, the chip will send debug information, including node resets, over the back channel to Network Analyzer. Network Analyzer uses these reset and other commands to trigger the start-and-stop capture process. If an image does not have debug turned on, it will not send reset information to Network Analyzer, and Network Analyzer has no basis for triggering start or stop capture.
You can also modify some, but not all, capture options through the Live Capture Options toolbar control.
Capturing from a Sniffer Node#
Any adapter's node that connects to Network Analyzer can be designated as a sniffer. A sniffer node is capable of capturing all data that is transmitted among nodes over the designated channel.
A sniffer node must have a sniffer application loaded. The sniffer application enables the node to capture over-the-air transmissions between nodes over the designated channel. When you start capturing from a sniffer node, the sniffer node captures all packets that are exchanged by the nodes on the designated channel.
If no sniffer application is currently loaded, load one in either of the following ways:
In the Debug Adapters view, right-click the adapter and select Sniffer Configurator.
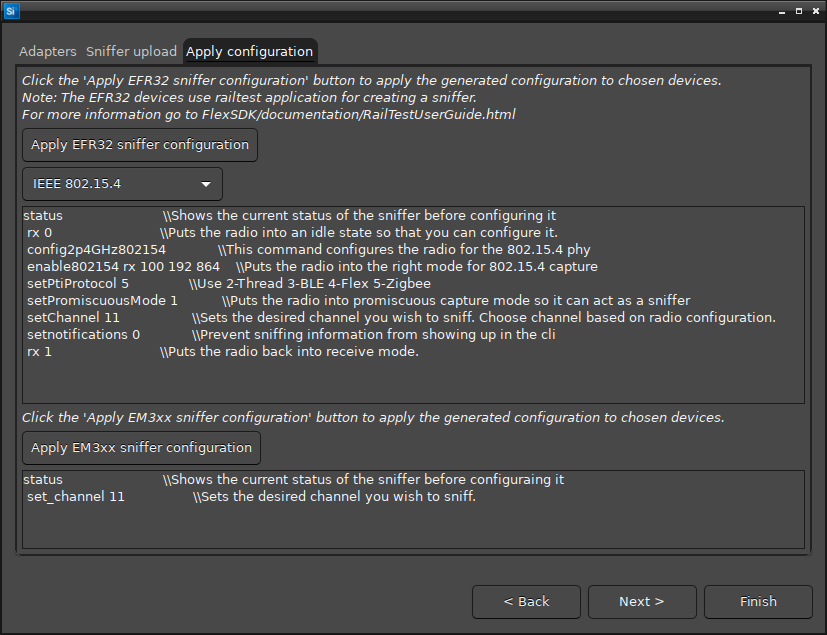
On the Adapters tab, select the adapter.
On the Upload tab, select the target adapter.
On the Apply Configuration tab, apply the appropriate configuration.
In the Debug Adapters view, right-click the adapter and select Make Sniffer. Network Analyzer will first check whether the node has a Sniffer image on it before attempting to upload the new Sniffer image.
Stopping a Capture#
Select one or more connected adapters.
Right-click the selected adapter(s).
On the context menu, select Stop Capture.
To resume capture, select Start Capture.
Pausing a Capture#
Pause a capture at any time by selecting Pause on the Network Analyzer menu or the toolbar. This is a convenient way to stop capturing from a device or devices without having to start a new capture at a later time. Events that occur during the pause are lost, and cannot be retrieved.
Clearing Session Events#
Click Clear Events on the Network Analyzer menu or toolbar to purge all events and their associated transactions from the current session. Caution! You cannot retrieve cleared events.
This is mostly used if you are working on a scenario on an embedded node, where you control some activity through command-line actions. You then simply "Clear" events between each retry, instead of having to do a complete "Start Capture / Stop Capture".
Note: Network Analyzer is designed to stay connected and continue capturing, even when the firmware on the target node is uploaded and the node resets. That does not stop the capture session.
Saving a Session#
When you start a capture, it is initially written to an unnamed live session. At any point during a live session, you can save the data thus far captured to a file by selecting File > Save or clicking the toolbar Save control. After you save a session file, Network Analyzer continues to append capture data to it; however, you must save again in order to retain this data in the session file.
Network Analyzer saves session data to an .isd file, which is a compressed file that stores session data and the network state. Network state includes display settings such as map modifications, which Network Analyzer restores when you reload the session file.
Network Analyzer closes a saved session from further captures after you explicitly stop the capture, or when you start another live session. After a saved session is closed, it cannot be reopened to capture more data.
If you modify a saved session file - for example, set bookmarks or reposition icons in the Map pane - Network Analyzer asks whether to save or discard those changes before you close the session.
Note: For security reasons, Security Keys that you may use to decrypt captured data are not included in saved .isd files by default. If you wish to share security keys with your files, you should turn on the option "Save decryption keys in Network Analyzer files" on the Security Keys preference page, which you can access by selecting Window > Preferences > Network Analyzer > Decoding > Security Keys
Saving Multiple Sessions#
If multiple open capture sessions have unsaved data, you can save all of them at once by selecting File > Save All, or using the toolbar Save All control.
Exporting to Other File Formats#
To export a capture session to another file format:
Select File > Network Analyzer Export or click the toolbar Network Analyzer Export control.
Select the export format
Name the output file.
Click Save.
Extracting Individual Events#
You can extract specific events from the Transactions pane, Events pane, or Hex Dump pane, and save them into a separate text log file.
To extract specific events to a text file:
Right-click the event in the Transactions, Events, or Hex Dump panes that you want to extract.
On the menu, select Extract to.
Name the output file with a text extension.
Click Save.
Once you specify a file, you can append additional events to it by right-clicking the event that you want to append and selecting Append to <file>.
Open and Close Options#
To open a capture file, select File > Open Recent File (Network Analyzer trace ...) or click the toolbar control.
To close a single capture session, close the session tab.
To close all capture sessions, right-click any session tab and select Close All, or select File > Close All.
To close all but the current capture session, right-click its session tab and select Close Others.
Replaying a Session#
(Rarely used) Replay events of the current session, whether live or saved, by selecting Start Replay on the Network Analyzer menu or the toolbar. Network Analyzer replays the session from the selected event at a constant speed. Replaying events in a live session has no effect on the capture in progress.
Once replay has started, both the toolbar control and the menu selection convert to a Stop Replay function.