Viewing Data in Editors#
On the File menu, select Open File (Network Analyzer trace ..) or Open Recent File (Network Analyzer trace ...) to open data in an editor. If the file is smaller than the size set in Preferences > Network Analyzer > Capture File Storage for a file to be considered large, Network Analyzer opens it in the Stream Editor. Otherwise, Network Analyzer opens it in the Large File editor.
Stream Editor: The Stream Editor decrypts, decodes, and displays details of individual events.
Large File Editor: The Large File Editor does not offer any detailed decoding and presentation of events. Instead, it provides a high-level overview of a file and allows users to open their points of interest in the Stream Editor.
The Stream Editor provides details about individual events. However, in the case of really large captures, this may tax system resources. The Large File Editor shows an overall timeline and node statistics. It allows you to scan very large captures for areas of interest, which you can then open in Stream Editor.
Stream Editor#
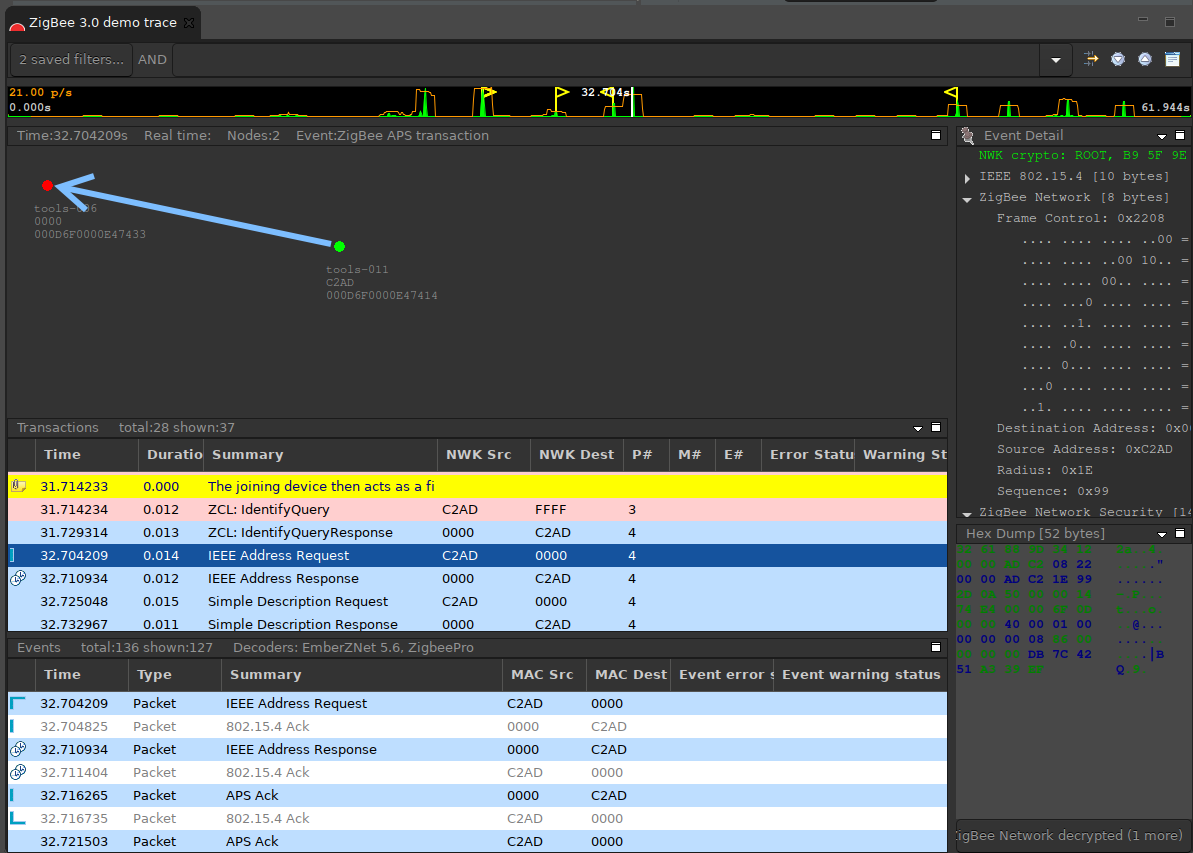
The Stream Editor contains five editor panes, each of which provides a different view of the captured session data:
Map pane: Provides a map of the network, with nodes displayed with their network identifiers. The map also displays network activity.
Transactions pane: Displays high-level node interactions that might comprise multiple events.
Events pane: Displays information about all packets transmitted and received during a capture session.
Event Detail pane: Displays the decoded contents of the packet that is currently selected in the Events pane.
Hex Dump pane: Displays the data of the selected event in raw bytes. Network Analyzer highlights bytes that map to the data currently selected in the Event Detail pane.
All five editor panes may be open at once. Live captured data is continuously updated and displayed in the editor panes.
A Timeline Bar displays the statistics of the traffic over time.
Views are presented in a tabbed interface in the lower left of the default Network Analyzer perspective.
Radio Info View: Shows the information from the radio of all the receivers in the network that have heard the currently selected event.
Event Difference View: Displays the differences between two packets.
Connectivity View: (15.4 captures only) Displays a graph of network connectivity, using the neighbor information from the nodes.
For more information about using the Stream Editor panes, see the Editor navigation tools.
Map Pane#
The following information is applicable to 15.4 networks only.
The Map pane shows all interaction between nodes at a high level. As events occur or are replayed, the Map pane refreshes to show the pattern of network communication. Debug messages issued from a node also display next to the node.
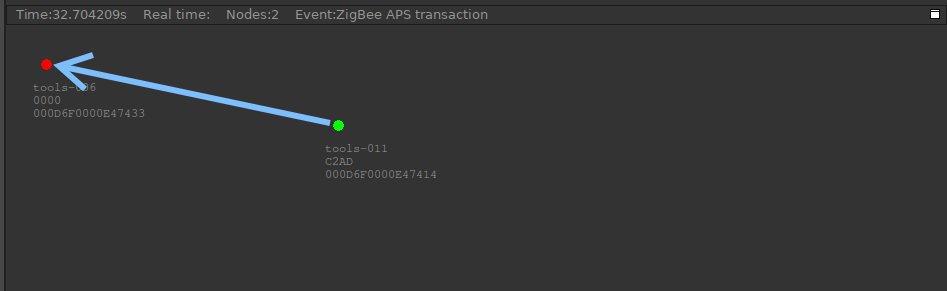
Each node in the map pane is given a different color depending on its capabilities within the network as they are understood by Network Analyzer based on captured data.
RED: The node is a network coordinator.
BLACK: The node is a router.
GREEN: Default color for network nodes.
The following figure shows the graphical elements that appear in the Map pane to depict network activity. Thick lines depict transactions, while thin lines depict single packets.
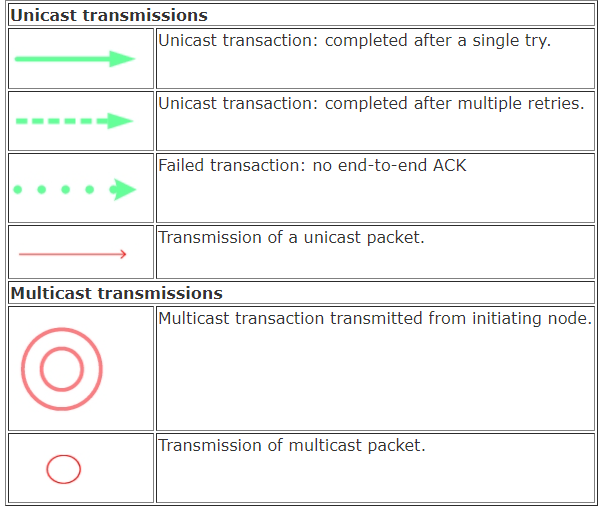
Note: The colors shown vary according to the transaction or event type, and can be configured through the Filter Manager.
The data that is shown for each node is managed through menu/toolbar options:
Show Short ID toggles display of the node's 16-bit address that is unique within the personal area network (PAN).
Show EUI64 toggles display of the node's unique 64-bit IEEE address.
Show PAN ID toggles display of the PAN identifier of the node's network. This label can be useful when the map displays multiple networks.
Show Node Label displays the custom label that you create for map display only.
Show LQI toggles display of link quality data that pertains to the quality of connection between nodes. This is available with perfect trace captures, but not with sniffer captures.
Show Connectivity shows the neighbor relationships between nodes in the network.
Simultaneous Events displays on the Map pane all events that occurred at the same time as the transaction or event that is currently selected. The currently selected event is in color and any other events display in gray.
Zoom Map In and Zoom Map Out enlarge and shrink the space that the map uses to display nodes. Zoom options have no effect on the size of node icons.
You can move node icons within the Map pane display. This has no effect on network functionality. However, it can help to highlight certain node interactions and relationships. When you move node icons in a session, Network Analyzer asks whether to save those changes before you close the session.
Right-click anywhere in the map pane to bring up a context menu.
Organize Map establishes the layout of all nodes on a map. You can also modify individual node positions as needed. The following layouts are available:
Default Placement aligns nodes in a linear pattern.
Random Placement scatters the nodes across the map randomly.
Square Grid aligns the nodes in a grid.
Hexagonal Grid aligns the nodes in a hexagonal, offset pattern.
Load Background Image and Clear Background Image manage the display of a background image in the Map pane.
Right-click on a node to bring up a context menu.
Assign EUI64 lets you assign a EUI64 to a node (not available if Network Analyzer obtains the EUI64). Network Analyzer obtains a node's EUI64 only when that node associates with a network. If the node already belongs to a network when a session begins, its EUI64 is unknown. This option lets you display a known EUI64 for a node; the node's actual EUI64 is unaffected by this label. The Multinetwork checkbox can be used to indicate that the node is operating on multiple networks. See Multinetwork Considerations for more information.
Multinetwork toggles the multinetwork property. See Multinetwork Considerations for more information.
Label lets you customize the node's adapter (device) label with any string up to 25 characters long. This string appears in brackets after the node's device name. (By default, the Map pane labels each node that is undergoing capture with its device name.) You can also make the labels time-dependent by entering a start time. This lets you supply multiple names for the same node. This can be useful while debugging applications, by indicating the node's current state.
Icon and More Icons allow you to display the node as an icon.
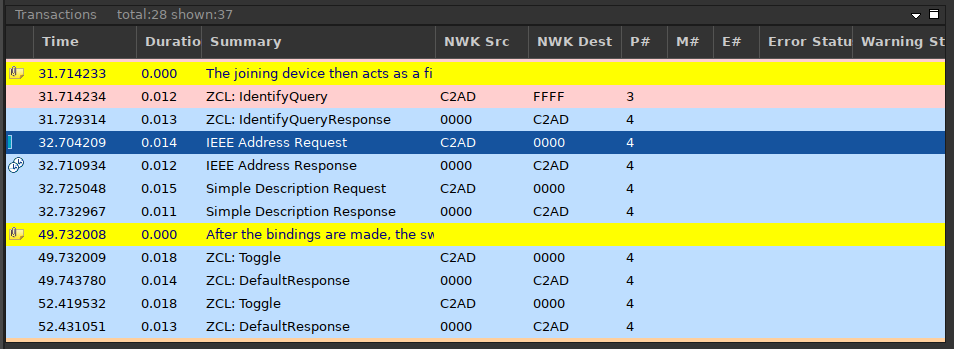
Transactions Pane#
The Transactions Pane displays higher-layer protocol events that consist of multiple packet transmissions. For example, a Zigbee broadcast is retransmitted by every node in the network. By analyzing packet headers, Network Analyzer determines which packets belong to the same transaction and groups them accordingly.
Typical 15.4 transactions include:
802.15.4 association: Involves a request-response protocol that consists of at least 6 packet transmissions.
APS unicast: Can contain the following events:
A MAC layer unicast packet and its MAC retries
Acknowledgements for each hop along the route
An end-to-end APS acknowledgement message, which itself consists of multiple MAC unicast packets
Multiple end-to-end APS retries
Zigbee route discovery: Involves a broadcast route request followed by unicast route-reply packets across multiple hops.
In the case of Bluetooth Low Energy (and Bluetooth mesh), a “transaction” refers to an actual Bluetooth Low Energy transaction as defined in the core specification. This corresponds most of the time to a Bluetooth Low Energy procedure. Equally, the event pane displays the actual Bluetooth Low Energy events corresponding to the transaction or procedure. For more details, refer to the Bluetooth Core specification document.
Network Analyzer understands the protocol semantics for many transaction types. Therefore it can group multiple packets in real time to facilitate high-level analysis.
All transactions are listed in chronological order, using transaction start times. Each selection maps to one or more events in the Events Pane, which are marked accordingly. Clock icons indicate concurrent transactions with the current selection.
All transactions and their events are uniquely numbered. However, the transaction numbers may not be in sequence, and various factors will result in number gaps. For example, only top-level transactions and the lowest-level packets are shown. Intermediate transactions are not shown. Also, number gaps are likely to occur if filters are turned on.
When you click on a transaction, the information shown in the Event Detail Pane and the Hex Dump Pane corresponds to the first packet in the transaction. However, if filters are turned on, the first transaction might not be shown in the Event Pane. In that case, the event detail information in the transaction display will not be consistent with the first packet shown in the Event Pane. In fact, with a filter expression such as show(transaction.summary != null, SELF) only transactions are displayed and the Event Pane will be blank. In that case, click the transaction to see the first events in the transaction in the Event Detail and Hex Dump Panes.
Events Pane#
The Events pane displays information about packets received by the current session. All events are displayed in chronological order.
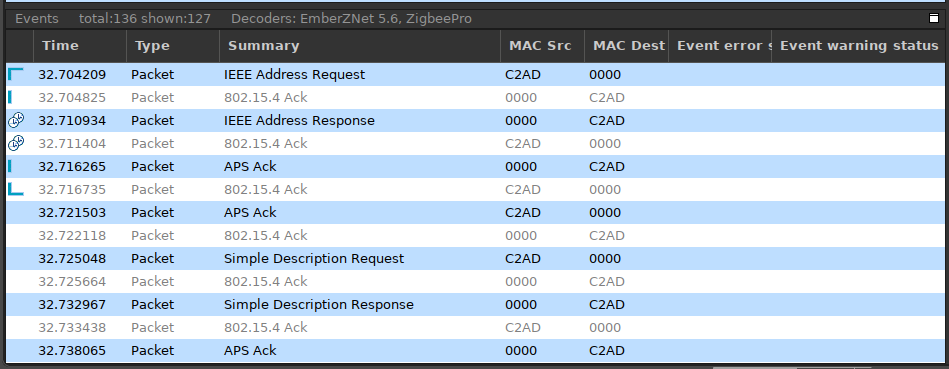
Events that belong to the currently selected transaction in the Transactions pane are marked by one of the following icons:
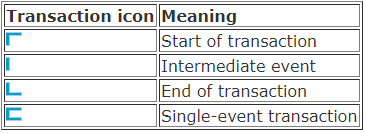
Clock icons mark unrelated events that are concurrent with the selected transaction in the Transactions pane.
Event Detail Pane#
The Event Detail pane displays the decoded contents of the event that is currently selected in the Events pane. The content of this pane varies according to the event type. If a transaction is selected on the Transactions pane, the Event Detail pane shows the details of the first event in the transaction.
Pane options include:
Expand Bitfield: Shows the bitfields in an expanded mode, like Wireshark.
Use Fixed Fonts: Can improve readability as information is presented aligned.
When capturing from multiple devices, Network Analyzer may capture the same packet as heard by several different sources. In order to reduce confusion, Network Analyzer automatically performs duplicate detection on all packets captured. If the transmission is captured over the backchannel, only the transmitted packet is kept. Otherwise the first receive packet is kept. All duplicate packets are dropped after extracting their RadioInfo data. Only the radio info frame for each duplicate packet is kept. The radio info for each individual instance of a packet captured by Network Analyzer is visible in the Radio Info View
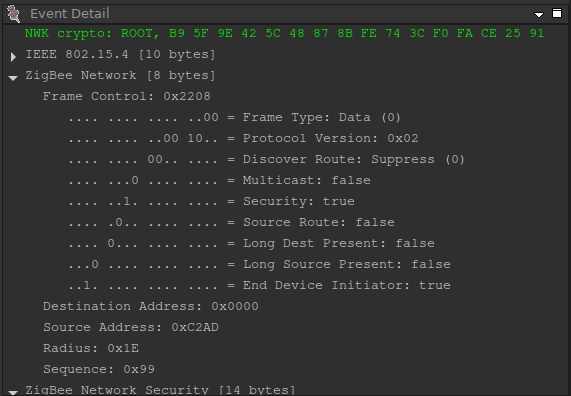
Pinning a field: The Event Detail pane has the ability to "pin" a field into view. When you double-click on a specific field, the Pin icon in the top left of the pane turns bright red, indicating that it is active. Now, as you move through events, this field is always visible when it is present in the currently selected packet. This is useful if you are interested in a specific field across multiple events in a trace file. In the above figure, the Zigbee Application Support Delivery Mode is "pinned" into view. The pin can be deactivated at any time by either double-clicking on the pinned field, or by clicking the Pin icon itself.
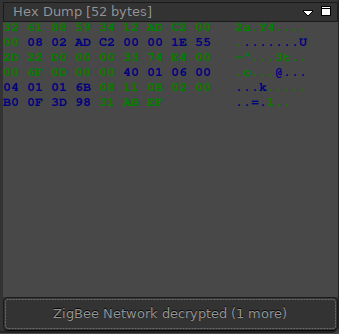
Hex Dump Pane#
The Hex Dump pane displays data in raw bytes of a selected event in the Events pane. Clicking on bytes in the Hex Dump pane selects the corresponding field in the Event Detail pane. Alternatively, selecting a field or a frame in the Event Detail pane highlights the corresponding bytes in the Hex Dump pane. The pane shows multiple "layers", so if the packet is decrypted, the "raw" layer shows encrypted data, but the higher-level layers show this data progressively decrypted.
Timeline Bar#
The Timeline bar displays the statistics of the traffic over time. The Timeline bar function on the Network Analyzer toolbar toggles the Timeline Bar on and off.

Available actions are:
Click on the Timeline bar to move the cursor to the event closest to the time selected.
Click and drag on the Timeline bar to filter the display to only the time within the selected area.
Right-click to display a timeline menu.
The Timeline bar shows bookmarks as yellow flags. You can click a bookmark to jump to it in the Transaction and Event panes. It shows red flags for errors, such as out-of-sequence problems.
Radio Info View#
The Radio Info view is a helper view that shows the information from the radio of all the receivers in the network that have heard the currently selected event. It is available through the tabbed Views interface in the lower left of the default Network Analyzer perspective. If not, add it through Window > Show View.
The view displays in a tree all the information that has been gathered from the receiver nodes. Displayed information includes LQI value, CRC value, and the status bits that show several states of the radio.
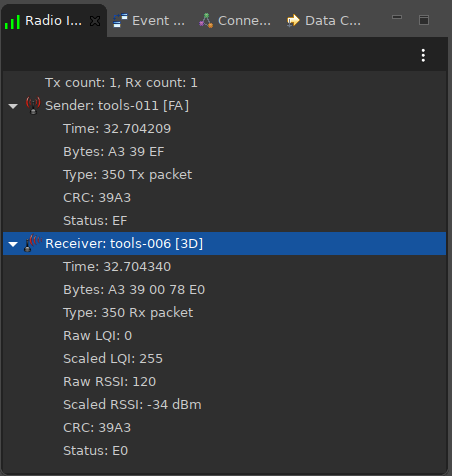
The event that supplied radio information in the figure above was captured from both the sending and receiving nodes. This is possible because the trace that contains this event was created by capturing from both the sending and receiving nodes simultaneously using Network Analyzer's Perfect Trace capability. While the original events were merged into a single event by Network Analyzer's duplicate detection mechanism, the radio information was retained for each event and is shown in the Radio Info view with the time that the event was captured by Network Analyzer.
Event Difference View#
Event Difference view is a helper view that displays the specific differences between two packets. It is available through the tabbed Views interface in the lower left of the default Network Analyzer perspective. If not, add it through Window > Show View.
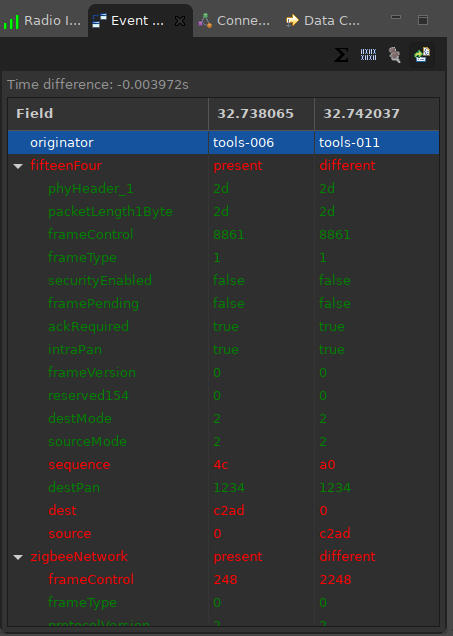
Once the view is shown, it tracks the selected events. The view will by default show the difference between the last two events selected. If you select event 1, and then click on event 2, the view shows the difference between those two events. If later you select event 3, the view shows the differences between event 2 and 3.
Packet frames that do not have any differences are shown in green. Frames that contain differences are shown in red. Expand the frame to see which portions of the frames are different.
The menu at the top of the view supports additional functions.
![]()
![]()
Show traffic counts: Opens a window showing the statistics for the events between, but not including, the two selected event.
Show byte differences: Enables viewing of individual bytes in the view.
Pin last selected event: Changes the way events are tracked. If this is enabled, then the first event for diffing stays the same, and only the second event changes. You can use this if you wish to always differentiate events against a certain static event, rather than always viewing last two selected events.
Include fields that are same: Enables filtering out fields that are same in both events.
Editor Navigation Tools
Some of the Network Analyzer Toolbar functions are specific to working in the Stream Editor.
Edit description of trace file: Opens a simple dialog which allows you to view and edit overall description of the captured data. This is helpful if you need to pass on some information others for analyzing the contents of the trace file.
Go to Line: Moves the cursor to the event or transaction having the specified event number. This is only enabled if the Stream preference "Show event numbers" is selected. To turn this feature on go to: Window > Preferences > Network Analyzer > Capture Configuration > Show event numbers.
Go to Time: Moves the cursor to the transaction and event that match or immediately follow the specified time.
Go to Bookmark: Moves the cursor to the selected bookmark. Assign bookmarks to events or transactions by right-clicking the event or transaction and selecting Add Bookmark.
Lock to Bottom: Locks the cursor on the latest event during a live session. To remove the lock, select any event or transaction during a live session, which causes a view to scroll as the events are captured.
Large File Editor#
If the file is larger than the size set in Preferences > Network Analyzer > Capture File Storage, Network Analyzer opens it in the Large File editor. The Large File Editor allows you to find and select a region of interest, which you can then open and analyze with the Stream Editor.
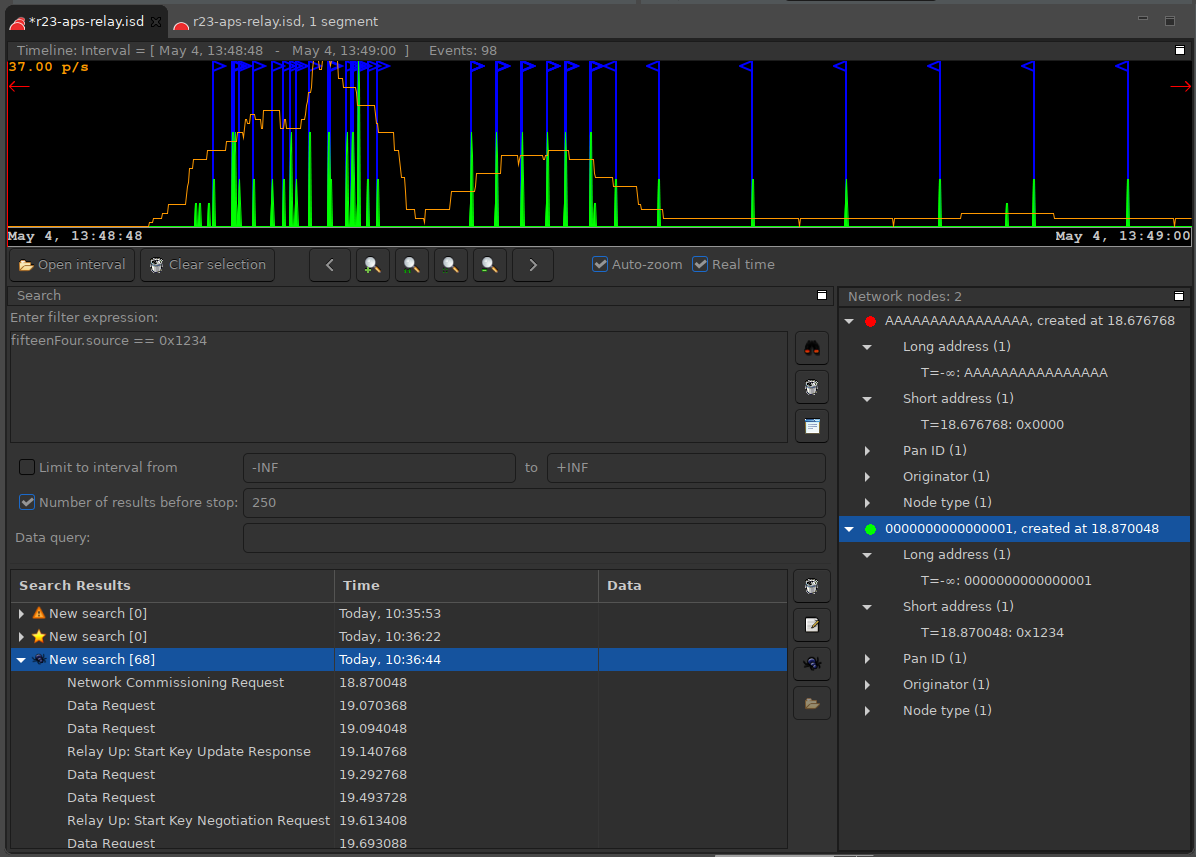
The Large File Editor consists of three component panes:
Large File Timeline: Shows a high-level view of a large file's traffic over time.
Large File Search pane: Provides a mechanism for searching across very large files.
Large File Network Nodes pane: Shows all of the network devices included in a large file.
Large File Timeline#
The Large File Timeline shows a high-level view of a large file's traffic over time. It works similarly to the Stream Editor's timeline. In fact, the Large File and the Stream Editor timelines use the same widget.
Large File Timeline Segments: The entire set of events shown in the Large File Timeline is broken into segments. By default, each segment includes up to 5,000 events. Segments boundaries are shown in the Large File Timeline by horizontal grey lines.
Large File Timeline Time Markers: The Large File Timeline shows the actual time during which a file was captured. The capture start-time appears in the bottom left corner of the Timeline. The capture end-time appears in the bottom right corner.
Moving the cursor to any point on the timeline displays the time for that point.
Large File Intervals: A Large File Interval is a subset of an entire trace. You can create an interval by clicking and dragging. Click on the Large File Timeline at the desired start-point, and then drag the cursor along the timeline to the desired end-point.
The click and drag operation creates the interval you defined, and zooms the timeline view into that interval. To clear the interval, click the Clear Selection button in the toolbar under the timeline, or right-click on the timeline and select Clear interval.
Once you have created an interval, you can open that interval in the Stream Editor by clicking the Open Interval button, or right-clicking in the timeline and selecting Open Interval.
Timeline Flags: Search results and errors are displayed in the Large File Timeline by flags. Search results are displayed as a yellow flag. Errors are displayed as a red flag. When you move the mouse over the flag, the Timeline displays the Summary of the Event or Transaction that is associated with the flag.
Large File Search#
Use the Large File Search mechanism to search for events across very large files. The entire filter language is supported in the Large File Search. For more information, see Filter Language.
To run a search in the Large File Editor, enter the filter expression into the Filter Expression text box and click the Start Search control. The search progress is shown in the Large File Timeline. Options allow you to limit the search within a time interval or to limit the number of search results. It is useful to limit the number of search results, as the system can become slow if the search expression matches an extremely large number of events.
Filter results are shown in the Search Results table. Search results are grouped into results trees and labeled with the time and date that the search was performed.
To view search result details, double-click an individual search result. This opens three segments in a Stream Editor: one before the selected event, one that contains the event, and one after the event.
Note: The expressions and search results are saved into the Network Analyzer file. Thus they will be seen by other users who open the same Network Analyzer file.
Controls to the right of the search results allow you to delete, tag, open, and assign decorative icons to the searches and search results.
Large File Network Nodes#
The Large File Network Node pane shows all of the network devices included in a large file. The information provided about each node in a trace includes:
EUI64 address
Short address
PAN ID
Node type
Since each of these values is subject to change over time, the summary also includes the time at which each value was discovered.