Energy Profiler and Network Analyzer Integration#
Note: This functionality is only available in offline mode with a previously saved ISD file.
Energy Profiler and Network Analyzer now provide a basic level of integration when trace data from a debug adapter includes both AEM and PTI data. This integration allows you to easily move between the two applications by selecting an event in either one and selecting Show in Network Analyzer or Show in Energy Profiler.
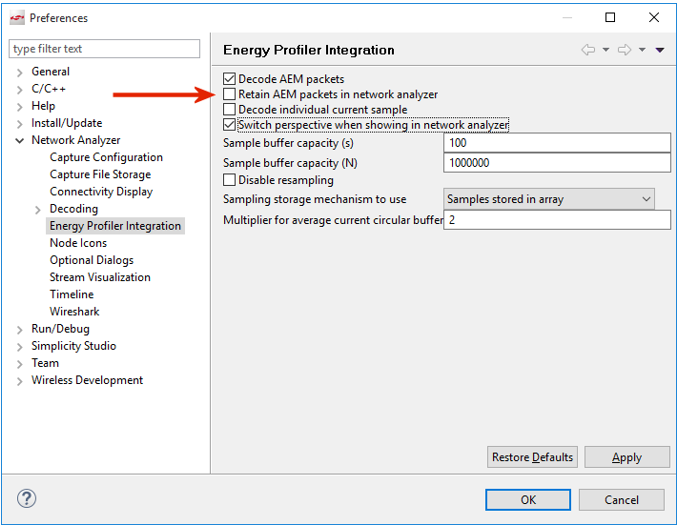
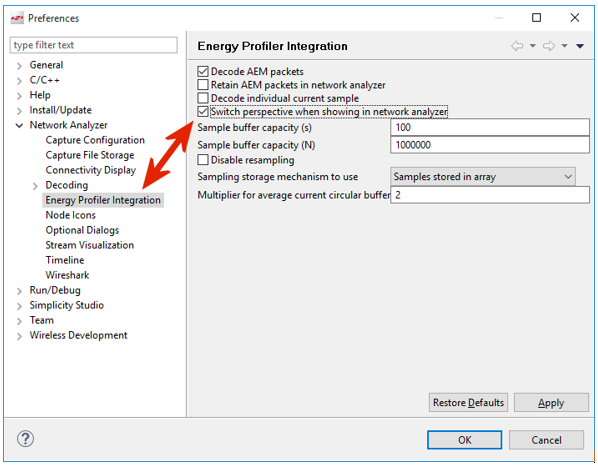
An SSv5 preference determines whether moving between applications leaves the Energy Profiler perspective and opens the Network Analyzer perspective, or stays in the Energy Profiler perspective.
This page reviews:
Using the Integrated Tools#
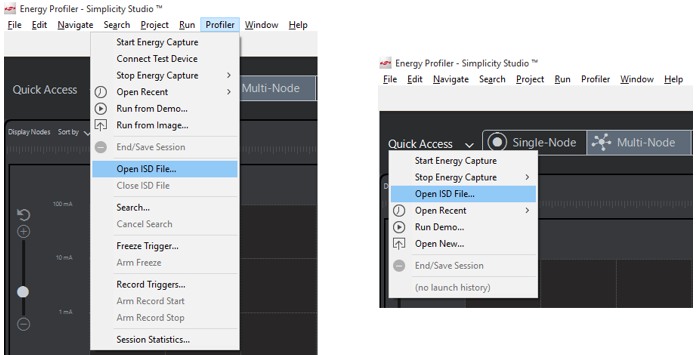
To open a previously saved ISD file, either use the top menu Profiler > Open ISD File... menu or the Quick Access > Open ISD File... menu, as shown in the following figure.
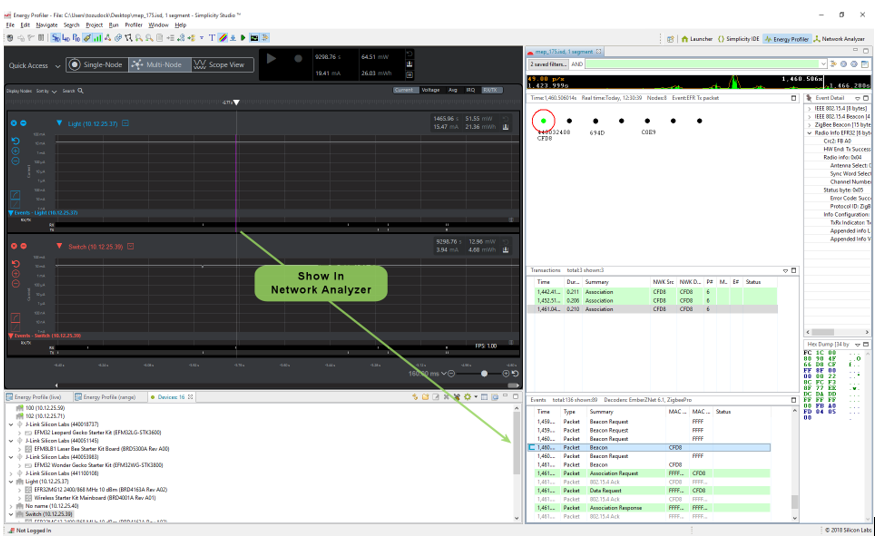
Once the file is open, you can examine previously recorded details. In the following figure, notice two devices transmitting and receiving packets. Select a TX or RX event and display the context menu. One of the options is Show in Network Analyzer.
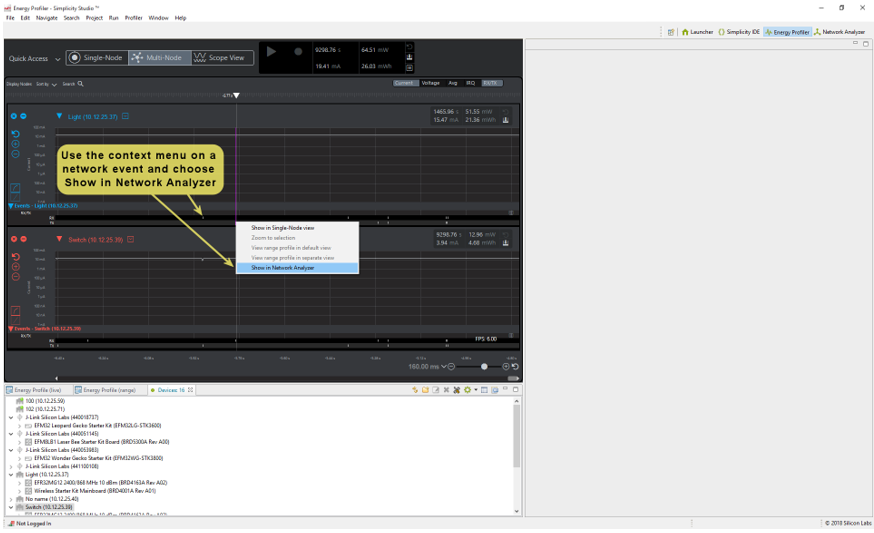
Select that option and the Network Analyzer view opens either in the Energy Profiler perspective or the Network Analyzer perspective, based upon the preference setting.
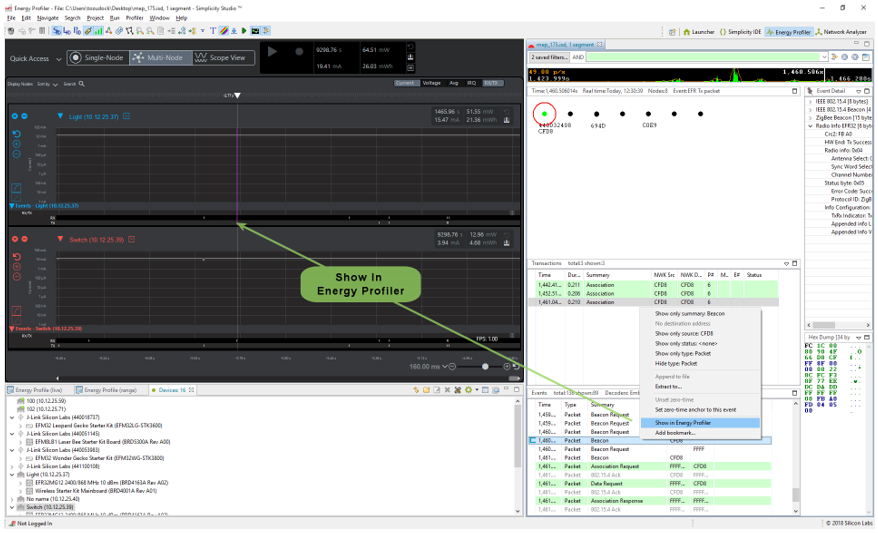
Likewise, you can select an event in Network Analyzer and use the context menu to navigate back to Energy Profiler.
Use Cases for Multi-Node Energy Profiler and Network Analyzer#
Depending upon your goals for an analysis session, there will be times when you will primarily use Network Analyzer, times when you will primarily use Energy Profiler, and times when you will find it advantageous to use them together.
When you are interested in energy consumption of a single or multiple devices, Energy Profiler is where you will focus your time. From a network communication perspective, it provides only the start time of a TX or RX packet, and does not provide any decoding of the packets themselves. Still, this information can be revealing in your application's consumption of power relative to network activity. For example, by using the search tool, you can set search criteria that identify all points in the data where a packet was transmitted and the power exceeded a given value. If you have an expected power performance based upon your design, you can quickly identify when your system is operating outside its specification.
If you are interested in packet contents, node activity, and network interaction in a wireless network, Network Analyzer is where you will focus your time. Network Analyzer's multiple editor panes provide tiered displays of network activity, letting you drill down from a high-level map of node interactions to the details of each packet. Customizable filters enable you to specify exactly which network activities to display, allowing you to sift out information unrelated to a given task. These features allow you to determine when your network is behaving as expected, but are not available in Energy Profiler.
You will find yourself benefitting from the integration of these applications where these two information spaces intersect. For example, the Energy Profiler use case mentioned above ended at finding a transmit packet that exceeded expected power consumption. To investigate further, you could select Show in Network Analyzer to investigate that specific node's network activity and packet contents, in hopes of determining why the power was higher for that particular network transaction. In contrast, you may suspect that packets with specific content are the root cause of high power consumption. In Network Analyzer you could search for that data, and use Show in Energy Profiler to determine if indeed those packet contents are the root cause of high power consumption.
Post Analysis Using an ISD File#
Both Network Analyzer and Energy Profiler capture data in the same format, which are saved in the ISD file format. Both applications can open an ISD file that has been save by either application. For example, if you have completed an Energy Profiler session and saved the ISD file, only to realize later that you are interested in the packet trace information, you would open that file from Network Analyzer to further investigate it. It is important to note, however, that captures started in Energy Profiler include packet trace data by default, but captures started in Network Analyzer only contain energy data if the preference to include it has been selected, as shown in the following figure.