Profiling with Code Correlation#
Code correlation is one of the most powerful features in Energy Profiler. Energy Profiler captures program execution in conjunction with the energy data. This allows Energy Profiler to calculate the power consumed by each function executed in the application. This data may then be sorted to highlight the portions of an application that consume the most power. This enables the application developer to know where they should concentrate their software development efforts to reduce power consumption. Additionally, Energy Profiler can color-code sections of the current waveform to represent which functions were executing when a given section of the current waveform occurred.
This page reviews:
Enabling Code Correlation#
This section assumes an embedded application is already configured to produce AEM data through a debug adapter (see Customer Hardware and Software Design Information for details). For code correlation to operate, Energy Profiler needs access to debug information associated with the embedded application that is currently running. This information is available in the AXF file output from the build. Code correlation can be enabled when an application is started from the Simplicity IDE perspective through context menu commands for a given project, or it can be associated with an application already running on an embedded device that is being profiled in Energy Profiler.
From the Simplicity IDE Perspective
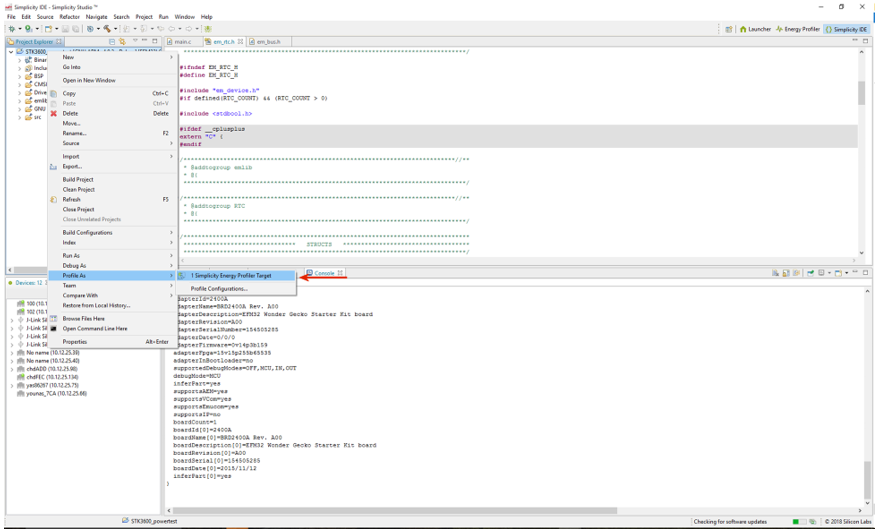
One simple way to enable the code correlation view is to start the energy profiling session by using the context menu on the project from the Simplicity IDE perspective, as shown below. The associated debug file will be provided to Energy Profiler when the session is started.
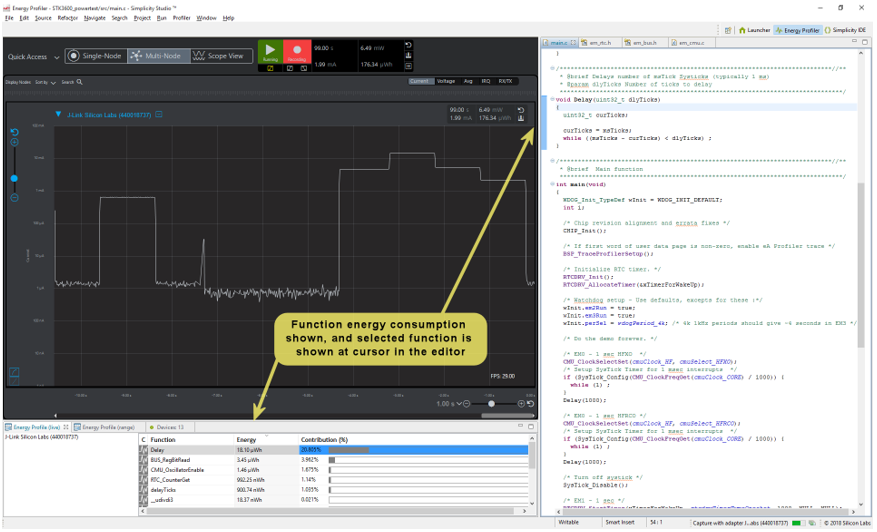
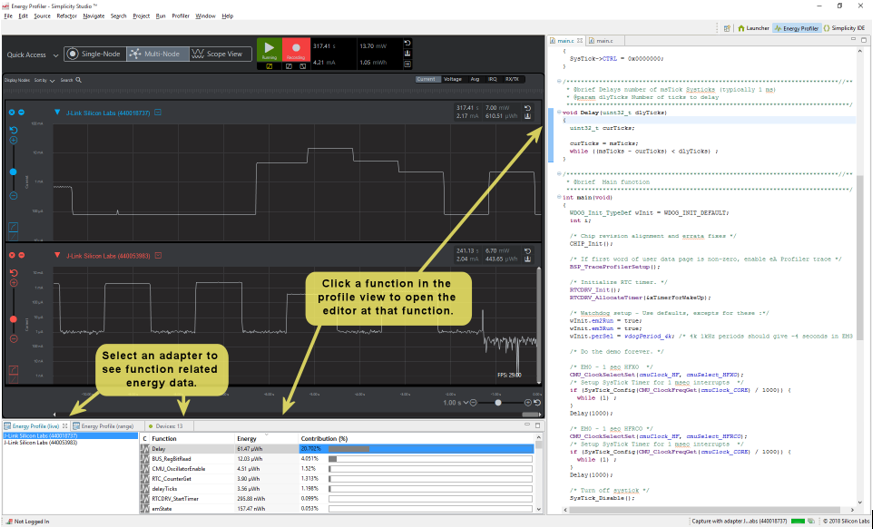
Once Energy Profiler starts, the following view is displayed. Notice in the Code Correlation view, energy consumed by each function is updated in real time. Clicking any of the functions opens the associated source code file and jumps to that function in the file.
From Energy Profiler
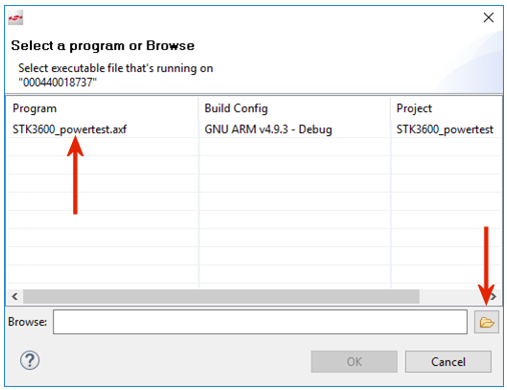
If you start energy capture with a running embedded application, Energy Profiler does not have the debug information it needs to associate program execution with source code. In these cases, the Code Correlation view is as shown in the following figure.
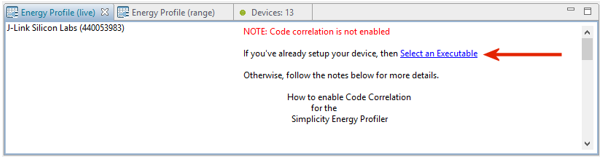
Click the elect an Executable link and the program selection dialog is displayed. Debug files from open projects are provided in the list. Alternatively, you may browse to select the debug file.
Code Correlation View#
The Code Correlation view is shown below the waveform portion of the Multi-Node Energy Profiler Perspective, and works in conjunction with the Editor view. When multiple devices are displayed in the Multi-Node view, you can click on each adapter to view the function profile data associated with that device. The function data may be sorted as desired. Clicking on any function opens the associated source file in the Editor view with the start of scope for that function selected.
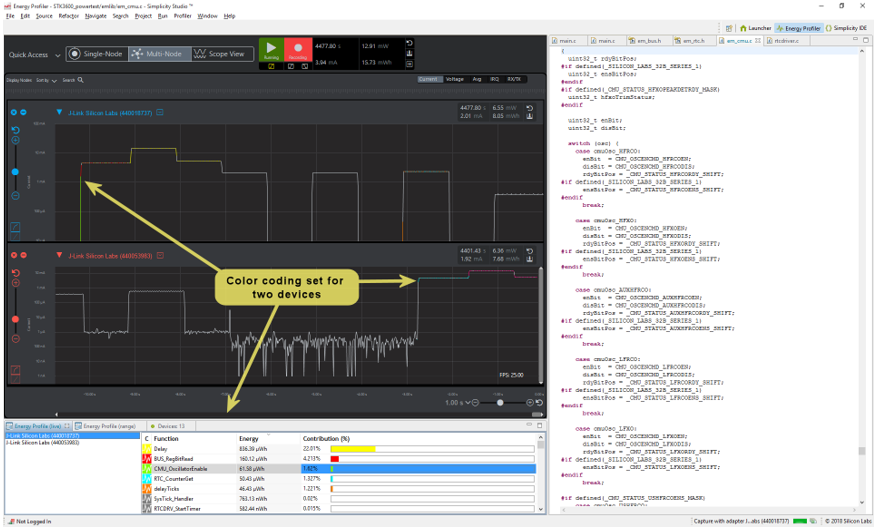
Color Coding and Code Correlation#
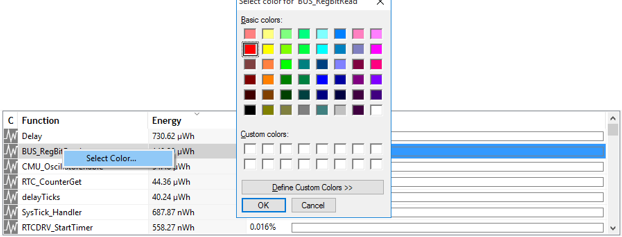
Energy Profiler provides the ability to color-code the current waveform based on program execution. You can set the color for each function using the context menus in the Code Correlation view.
The following figure shows the current waveform view with several functions set to different colors.