Filtering Captured Data#
By default, the Events pane displays all session events. You can build and apply filters that constrain Network Analyzer to show only events that are of interest. By filtering events, you can analyze results more efficiently.
Each capture session has its own filter settings. A filter can be used either to search for the next matching event or to display only the events that match the filter. In the latter mode, when you change a session's filters, Network Analyzer immediately refreshes the display. When you exit Network Analyzer, all session filters are cleared and must be reapplied when you restart. Network Analyzer provides two ways to edit filters:
Filter Manager: Maintains a set of saved filters that you can review and edit. You can also add new filters. You specify any of the saved filters for display on the Filters menu, accessed through the n saved filters button on the filter bar, so that they are available for use in one or more sessions.
Filter Bar: An editor that attaches to a given session, where you can enter one or more filter expressions on the fly. Network Analyzer discards filter bar expressions for all sessions when it exits.
Quick filters are available when you right-click on events and transactions. They provide an easy way to create common expressions for the filter bar.
Filter Language is a powerful syntax used to create filters.
Filter Manager#
The Filter Manager lets you:
Use filter expressions to customize display of entries in the Events pane.
Specify which filters appear in the Filters menu.
The Filter Manager is available through menu and toolbar selections as well as through Window > Show View (as Expression Manager).
An older feature, the Expression Builder, is deprecated.
Maintaining Filters#
To add a filter to the Filters menu, check the Menu checkbox. This makes the filter available to the current sessions.
To restore filters to installation settings, click Reset.
To rename a filter, click on the name field and edit.
You can also create new, delete, export and import filters.
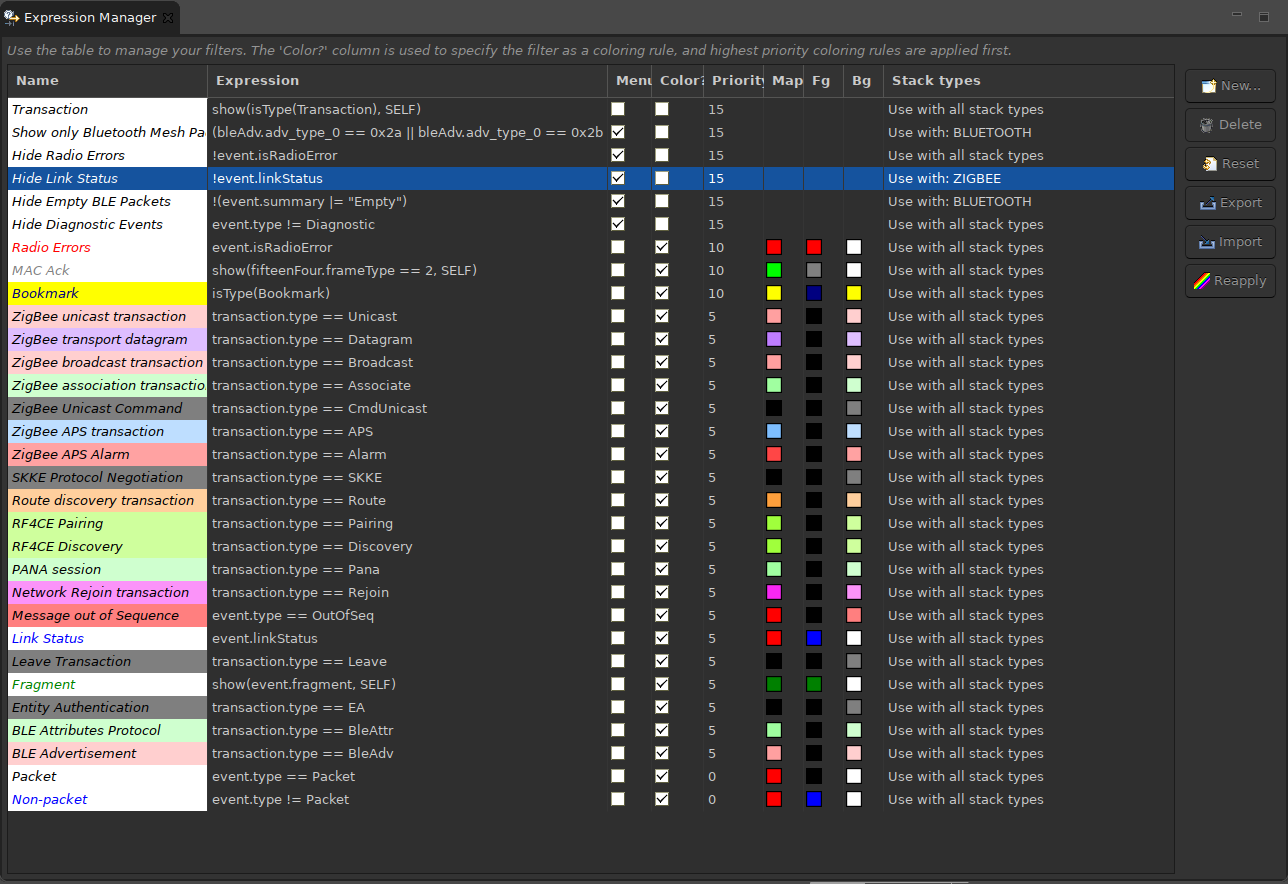
Setting Filter Color Schemes#
You can associate a color scheme with each filter. If an event evaluates as true for a given filter expression, Network Analyzer applies the filter's color scheme to that event. An event can be configured with a color scheme for two display levels:
For the Map pane, the color used by the graphic representing the event type.
For the Events pane, the foreground and background colors used by event type instances.
Note: Setting a color scheme on a filter expression does not specify whether to display events; it only determines how to display certain event types.
Note: If a filter's foreground color is the same as its background color you will not be able to read the text in the event and it will effectively disappear from view.
To set a filter color scheme, in the Filter Manager:
Next to the filter of interest, check the Color checkbox to enable the controls for Map (Map color), and Fg (Foreground color) and Bg (background color) for event instances.
Click the control you want to set to enable the color selector control.
Click the color selector control, set the filter's color, and click OK. If you have changed Foreground or Background colors you will see the change on the Name field.
For each filter, set the color scheme's Priority level by assigning a positive or negative integer value. If an event evaluates as true for multiple filters, Network Analyzer uses the color scheme with the highest precedence. In the case where there is no clear precedence, Network Analyzer randomly chooses one of the matching color schemes.
To refresh the Map pane and Events pane with the new color scheme, click Reapply.
A filter whose menu checkbox is selected is shown in the Filters menu. The order in which the filters are displayed in the Filters menu is determined by their order in the filter manager table.
Filter Bar#
A session's Filter Bar provides the same level of functionality as the Filter Manager for building expressions. Any filter expression that appears in a session's Filter Bar is combined with the saved filter expressions that are already in effect for that session.

The Filter bar is displayed by default, but can be toggled on and off using the Show Filter Bar menu control.
You can compose a Filter Bar expression in the following ways:
Enter the expression directly in the filter edit field, and press Enter.
Create a Quick filter.
To apply a Filter Bar filter, enter an expression into the filter edit field and press Enter.
To find an event that matches the filter, click the Find icons on the Filter Bar.
To remove a filter, select it and press Enter.
Note: A history of filter expressions is maintained in the drop-down list.
Quick Filters#
Network Analyzer provides several filters that are available from the Transactions pane, Events pane, Event Detail pane, and Hex Dump pane.
To access a quick filter, right-click an item and choose a quick filter pop-up menu option.
Hide or Show Events/Transactions#
Access these filters by right-clicking an event (Events pane) or transaction (Transactions pane) and selecting a pop-up menu option to hide or show specific information. The filter options that are available depend on the selected transaction or event. You can specify to hide all events/transactions of the selected type, or to show only that type. In addition if you select an event of type APITrace, the pop-up menu displays two filter options:
Hide type: APITrace
Show only type: APITrace
Further, if you select an event such as a neighbor exchange that has a source and/or destination address, the pop-up menu also contains these two filter options:
Show only destination: short-ID
Show only source: short-ID
In all cases, Network Analyzer enters the corresponding filter expression in the session's Filter Bar. This can help you to understand the filter language. For example, if you specify to show only route discovery transactions, this expression is set in the filter bar: isType(Route)
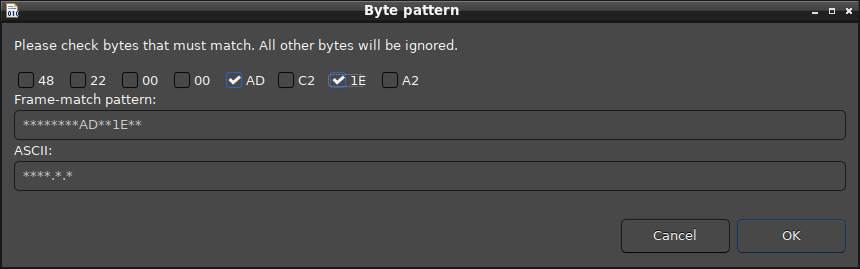
Frame Byte Pattern Filtering#
A frame pattern filter matches a specific byte-array pattern. For example, you could filter for packets in a payload whose frame has the third byte equal to 0x33. (Many more complex combinations are possible.)
To create a frame pattern filter:
Right-click a frame in the Event Detail pane or Hex Dump pane.
Select Filter by frame pattern from the pop-up menu.
In the Byte Pattern dialog, check the byte pattern match desired and click OK. The filter is added to the Filter Bar for this session.
Filter Language#
Filter language enables you to construct logical expressions, based on decoded fields in events. The following are some examples:
fifteenFour.sequence == 0x52: Matches events where 15.4 sequence number equals hex 0x52.fifteenFour.ackRequired == true && fifteenFour.source == 0x035f: Matches events where 15.4 ack required flag is set, and source shortId is 0x035f.isPresent(zigbeeSecurity.frameCounter): Matches events that contain the Zigbee security frame, and the frameCounter field within it.event.summary | "string": Matches events where a string is a substring of the summary.isType(Packet): Matches events that are packets.frameMatch(fifteenFour,"**88**EF/**********"): Matches events where 15.4 frame contains second byte equal to 0x88 and fourth byte equal to 0xEF.
A good way to learn the filter language is by first using the Add to filter context menu option in the Event Detail Pane. This option will add a filter expression for the chosen field.
You can use most standard logical operators (&&, ||) and standard comparison operators ( ==, !=, |, <, >, <=, >=, etc.) in filter expressions.
Event and Transaction Filter Extensions#
In addition to filtering on decoded packet fields, you can filter on several other Event and Transaction values.
Event Extensions:#
event.summary: A String value of the summary shown in the Event Pane.
Example: event.summary == "APS Ack"
event.linkStatus: True if the packet is a Link Status packet.
Example: event.linkStatus == true
event.ack: True if the packet is an 802.15.4 ack.
Example: event.ack == true
event.time: The time that the event was transmitted (tx) or received (rx).
Example: event.time >= 75.78
event.originator: The adapter that saw and reported the event.
Example: event.originator == "ewb-unit04"
event.status: The event status, listed in the righthand column of the event status window
Example: event.status == "ZCL: ReportEventStatus"
event.type: The type of event, shown in the Type column of the Event and Transaction Panes.
Example: event.type == "Packet"
event.corrupt: The event corruption string, empty if event is not corrupt
Example: event.corrupt < "crypt"
Transaction Extensions:#
transaction.summary: Filters on the transaction summary field shown in the Summary column of the Transaction Pane.
Example: transaction.summary == "ZCL: LoadControlEvent"
transaction.packetCount: Filters on the number of packets in the transaction shown in the P# column of the Transaction Pane
Example: transaction.packetCount == 4
transaction.macRetries: Filters on the number of MAC retries in the transaction shown in the M# column in the Transaction Pane.
Example: transaction.macRetries == 2
transaction.endToEndRetries: Filters on the number of end to end retries shown in the E# column in the Transaction Pane.
Example: transaction.endToEndRetries == 3
transaction.status: Filters on the status of the transaction shown in the Status column of the Transaction Pane.
Example: transaction.status == "CRC failed"
transaction.dest: Filters on the network destination of the transaction shown in the NWK Dest column of the Transaction Pane.
Example: transaction.dest == 0x05c7
transaction.source: Filters on the network source of the transaction shown in the NWK Src column of the Transaction Pane.
Example: transaction.source == 0x0000
How Network Analyzer Applies a Filter#
When Network Analyzer captures an over-the-air message, it runs the message through a processing stream. The processing stream is made up primarily of Decoders and Groupers.
Decoders: Decoders are responsible for making sense of the message based on its format so that it may be displayed to the user. Each over-the-air message captured becomes a single Event of type Packet. This Event is displayed to the user in the Event view.
Groupers: The groupers are responsible for making sense of a series of packets and grouping them into a hierarchy under a single Transaction. The Transaction is displayed in the Transaction view.
Using show(expression, SELF|PARENT|CHILD|SIBLING)#
Events exist within a hierarchical structure where Transactions represent the top of the hierarchy and Events are at the bottom. The hierarchical nature of trace data creates something of a problem for filtering. In most cases, you wish to see Transactions associated with filter-matching Events, and vice versa.
For instance, if you use a filter like: "transaction.summary == Association", you probably do not want to see only the transactions in the Transaction Pane. You probably also want to see the events contained within the Association displayed in the Event Pane.
You can solve this problem by using the optional show(expr, args) syntax in your filters.
The show syntax allows you to explicitly indicate the conditions under which an event or transaction should match your filter. The arguments for the show syntax are as follows:
SELF - The Event or Transaction matches if it contains data that matches the expression provided.
PARENT - A Transaction should be shown if any one of its child Events matches the filter.
CHILD - An Event should be shown if the Transaction to which it belongs matches the filter.
SIBLING - An Event matches if its PARENT transaction contains another Event which itself matches the filter.
Filter display defaults: Filter expressions that do not explicitly contain the optional show(expr, args) syntax are implemented as though they contain one of two default syntaxes. Which default syntax is used depends on where the filter is executed, in the Stream Editor or in the Large File Editor.
Stream Editor default:
show(expression, SELF|PARENT|CHILD)By default, filter expressions that do not explicitly contain the show(expr, args) syntax are implemented as though they were wrapped in the following syntax:
show(expression, SELF|PARENT|CHILD)The SELF|PARENT|CHILD arguments provide what Silicon Labs believes a user expects to see when a filter is run in the Stream Editor. The filter display includes the events and transactions that match the filter itself. If an Event matches the filter, you also see an associated Transaction (PARENT) regardless of whether that Transaction matches the filter. Likewise, if a Transaction matches the filter, you also see its associated Events (CHILD) regardless of whether those Events match the filter.Large File Editor default:
show(expression, SELF)By default, the search mechanism in the Large File Editor returns only those Events and Transactions which themselves match the filter expression provided. This behavior makes it very easy to run a filter to search for all the Transactions with a given summary without having the search results bogged down with hits for their associated Events.
Expression Validation#
Lexical validation - When you enter a filter expression, the filter engine validates whether the expression is lexically correct. If an expression is not lexically correct, Network Analyzer gives you an error message with a suggestion about where there may be a problem in the expression.
Event Key validation - When you enter a lexically correct expression, Network Analyzer also runs an event key validation. It checks that any identifier provided represents a real entity within an Event or Transaction. If the filter engine is not able to find any associated data for an event key within the expression, Network Analyzer will warn you that you are using an unverified identifier.
For example, in the expression
fifteenFour.dest == 0xffff
fifteenFour.dest is a verifiable event key in that Network Analyzer knows that it represents real data in an event.
Here are two examples to illustrate the validation of expressions in Network Analyzer. Consider this expression:
foo == bar
The filter mechanism has no way of knowing what foo and bar represent, or that they even represent any type of data within an Event or Transaction. While this expression is lexically correct, Network Analyzer will warn the user that foo and bar could not be verified, and that the expression may provide unexpected results. In fact, this expression will not show anything, since foo may very well equal bar, but the filter engine has no way of knowing that.
Consider also this expression:
foo == foo
This expression also displays a warning. However, when run, it will return ALL events, because while Network Analyzer does not know what foo is, it knows it definitely equals foo.
Special identifiers - Several special identifiers are not mapped to an event key.
payload.xxx, which evaluates into the payload bytes for a given layer xxx, for example payload.raw or payload.tcp_stream. You can form expressions like
payload.raw == {001122aabbcc}to match payloadsflag.xxx, which evaluates into the value of the event flag for a given event, for example:
flag.neighbor_exchangeorflag.fragment.