User Interface Review#
The Simplicity IDE perspective is made up of three views areas, the editor area, and a toolbar.
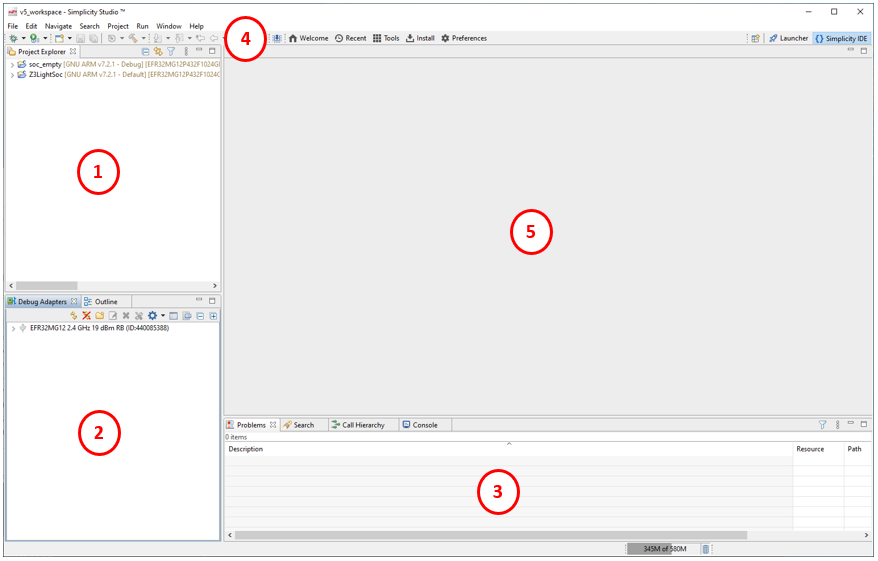
The Editor area is populated with whatever tool is appropriate for the device and project, such as Project Configurator or the 8-bit device Hardware Configurator.
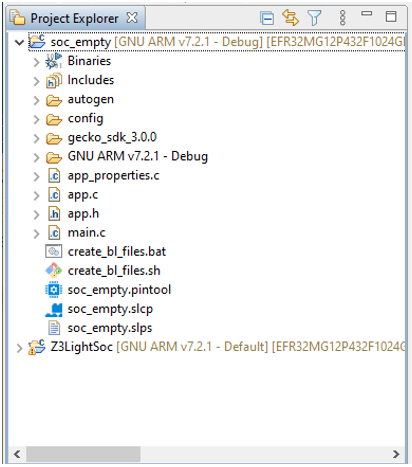
Project Explorer View#
The Project Explorer view shows project files in the current workspace.
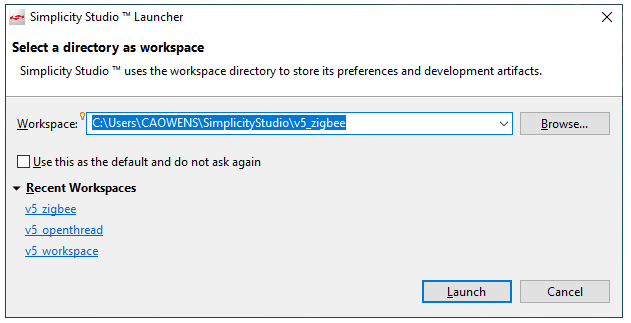
A workspace is a directory that includes some hidden metadata, and must be created through SSv5. The default Windows workspace is:
\Users\<username>\SimplicityStudio\v5_workspace\
Maintaining separate workspaces for different GSDK versions or compiler versions may be necessary in some cases or may help improve SSv5 Performance. See Tips and Tricks for more information.
Each SSv5 session has a single default workspace. To change workspaces or to create a new workspace, use the File > Switch Workspace function. To create a new workspace click Browse and add a new directory. After you add or switch, SSv5 restarts.
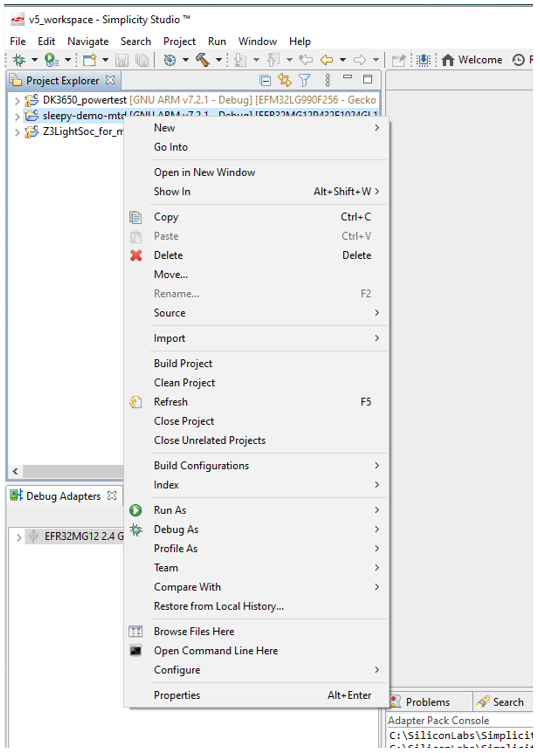
Right-click a project directory for a context menu of project-level functions.
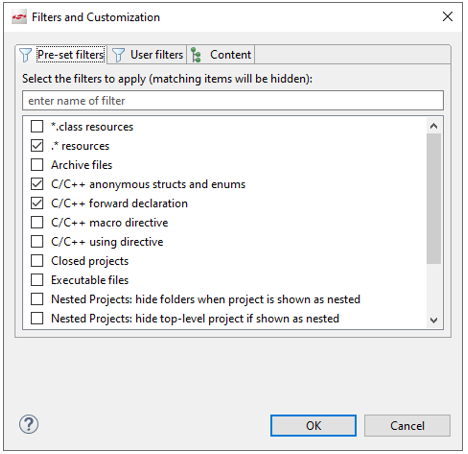
The Filter functionality available through the view toolbar can be used to limit the files shown.
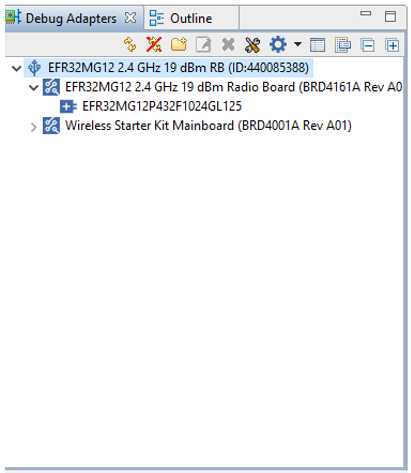
Debug Adapters View#
The debug adapters tab in this view is the same as that in the Launcher perspective.
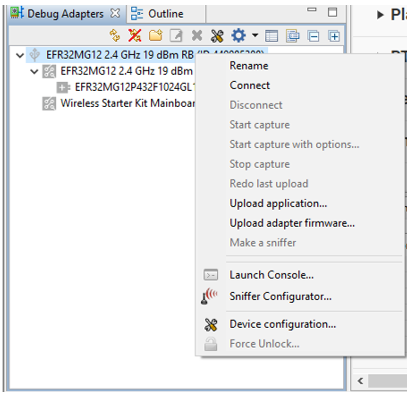
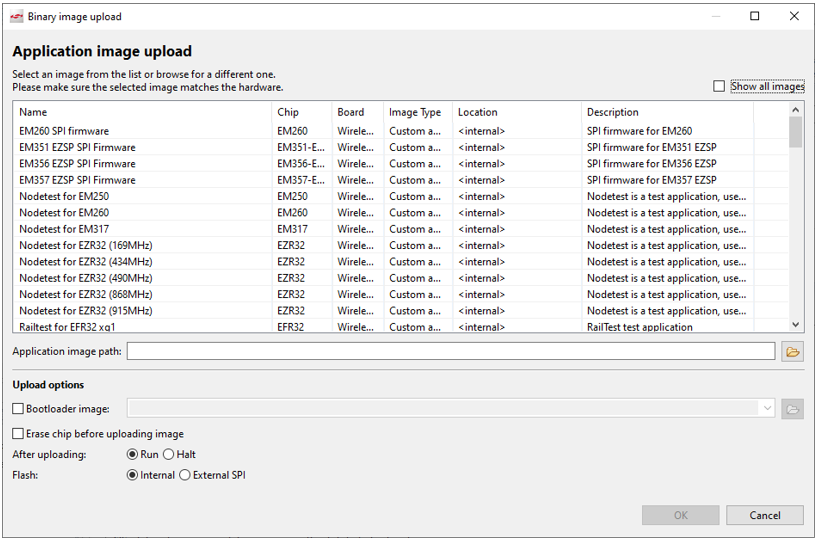
When the adapter is disconnected, an Upload application option is available. This has the advantage of allowing you to flash both an application image and a bootloader image at the same time, and also to see the various pre-compiled images available based on the installed SDKs, along with their compatible hardware.
When you connect to an adapter, the icons turn blue.
Once you have connected, Start capture and Start capture with options open the Network Analyzer interface for that device. For many devices, Launch console opens up a console in the editor area, where you can interact with the device. This option is not available with EFM8 / C8051 starter or development kits (STKs or DKs).
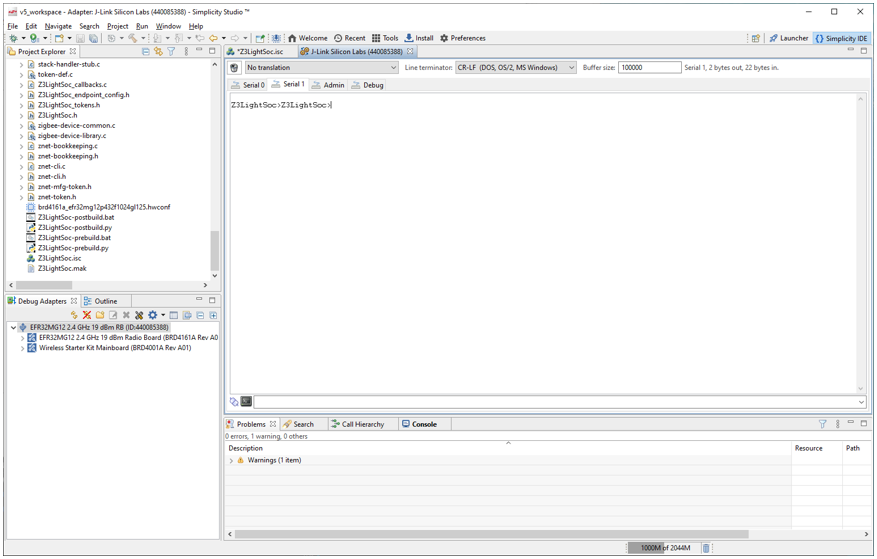
Other Views#
Other views are available in the pane below the editor area.
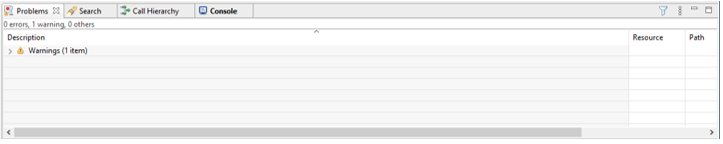
Problems shows any problems detected in an open file or a process.
Search shows the results of the most recent search. The toolbar allows you to retrieve previous searches.
Call Hierarchy shows the results of Open Call Hierarchy when using the IDE for code development.
Console shows activity such as flashing an image to the device and build results.
Toolbar#
The Simplicity IDE toolbar offers debug and other code and file options.
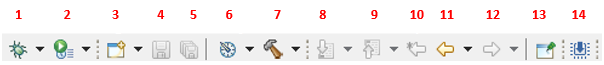
1 Debug builds an image in debug mode, flashes it, and opens the debugger.
2 Profile as opens the Energy Profiler.
3 New opens a menu where you can create a variety of items, including a new project (equivalent to File > New > Project).
4 Save saves a changed file.
5 Save all saves all changed files.
6 Mode allows change between debug and release mode for the applicable toolchain.
7 Build builds the selected project file in the default mode (debug or release).
When working with code files, 8 Next and 9 Previous annotation allow you to select the type of annotation and move to them.
10 Edit last location opens the last file you had selected.
11 Back and 12 Forward to file allow you to move to the previous or next file, or to select a file from a list.
13 Pin editor links the selection in the Project Explorer view to its editor tab.
14 Flash programmer opens the Flash programmer tool, also available through the Tools menu.