


Custom Board Debug Options#
Enabling debug support for a custom board has two stages. First, set up and configure the custom board in Simplicity Studio®. Then configure Visual Studio Code (VS Code) with the debugger settings and launch configurations you need for debug sessions on the target platform.
Configure Debugging for a Custom Board#
The following Silicon Labs debug adapters are supported for programming and debugging custom boards and hardware:
Debug Adapter | Debug Mode | Description |
|---|---|---|
Wireless Starter Kit Mainboard (WSTK BRD4001A) | OUT | Uses the external debug connection for a custom board. |
Wireless Pro Kit Mainboard (WPK BRD4002A, OPN: Si-MB4002A) | MINI | Uses the onboard mini-Simplicity connector. |
Wireless Pro Kit Mainboard (WPK BRD4002A, OPN: Si-MB4002A) | OUT | Uses the debug connectors on the side of the board. |
Simplicity Link Debugger (Si-DBG1015A) | OUT | Connects to the custom board through the mini-Simplicity connector or header pins by using jumper wires. |
Note: For either a WSTK or WPK configured for OUT mode, the recommended connection method is to use a Simplicity Debug Adapter Board (SLSDA001A). Insert the adapter board into the Debug Connector and Simplicity Connector, and then use a 10-pin ribbon cable to connect to the debug connector on the custom board.
Hardware Setup#
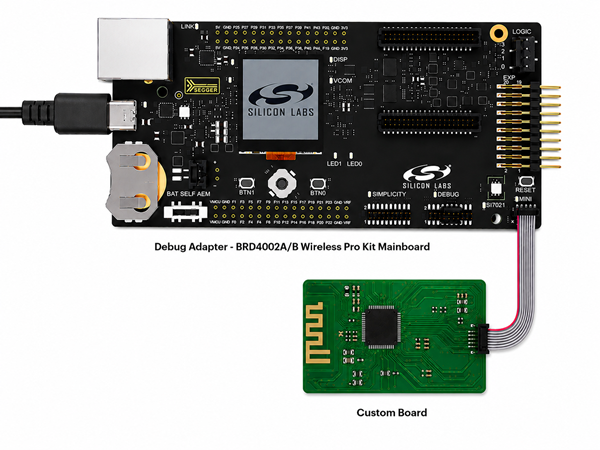
The following hardware configuration is used throughout this guide. Connect the custom board to the Wireless Pro Kit Mainboard (BRD4002A/B) using the mini-Simplicity (MINI) connector, and connect the mainboard to the host computer with a USB-C cable.
Configure the Debug Adapter#
In Simplicity Studio, select DEVICES.
In the Device tree, select the debug adapter you want to use for a custom board.
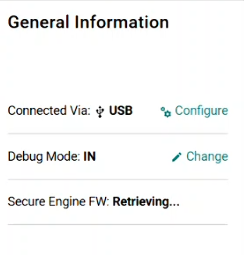
In the General Information panel, select Change next to Debug Mode to open Simplicity Device Manager (SDM).
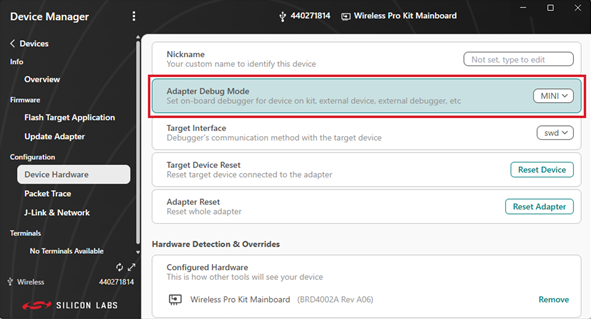
In SDM, select the appropriate Debug Mode for the target device, and then apply the configuration.
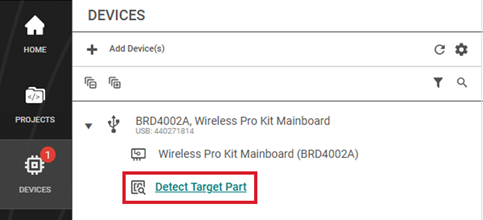
In the Device tree, under the selected debug adapter, select Detect Target Part to identify the target part on the custom board.
For an SiWG917 device, select Check if your target board is based on SiWG917.
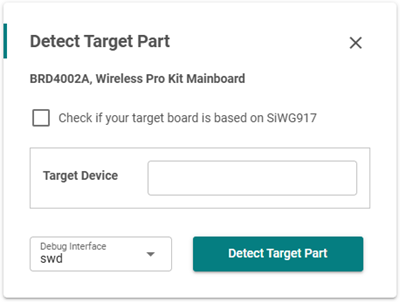
Select Detect Target Part.
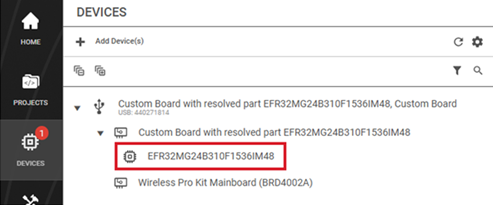
After the target part (for example, EFR32MG24B310F1536IM48) is successfully detected, it appears the custom board debug adapter, as shown in the following figure.
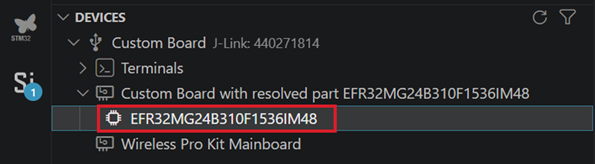
The custom board configuration also appears in the Devices view of the Simplicity Studio for VS Code extension.
Note: To detect a different target device, right-click the detected target in the Device tree and select Configure Device Hardware. This action launches Simplicity Device Manager (SDM). In SDM, click Reset Adapter, and then run Look for Devices again to detect the target device.
Configure Debug Sessions in VS Code#
The VS Code extension automatically retrieves the debug adapter configuration from Simplicity Device Manager, so you typically do not need additional setup to flash and debug a custom board. The debug adapter configured for the custom board appears under Devices in the Simplicity VS Code extension.
If the default settings are not sufficient, use the project-specific Debug Configurator:
Right-click on the project folder.
Select Open Configurators 2.0.
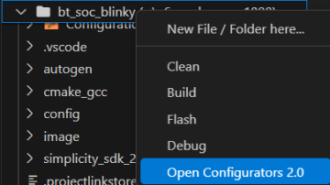
Select Debug Configurator.
The standard debug configuration fields are prefilled. Expand the bottom section of the dialog to view optional fields for the debug session, including configuration options for Real-Time Transfer (RTT) and Serial Wire Output (SWO) terminals.
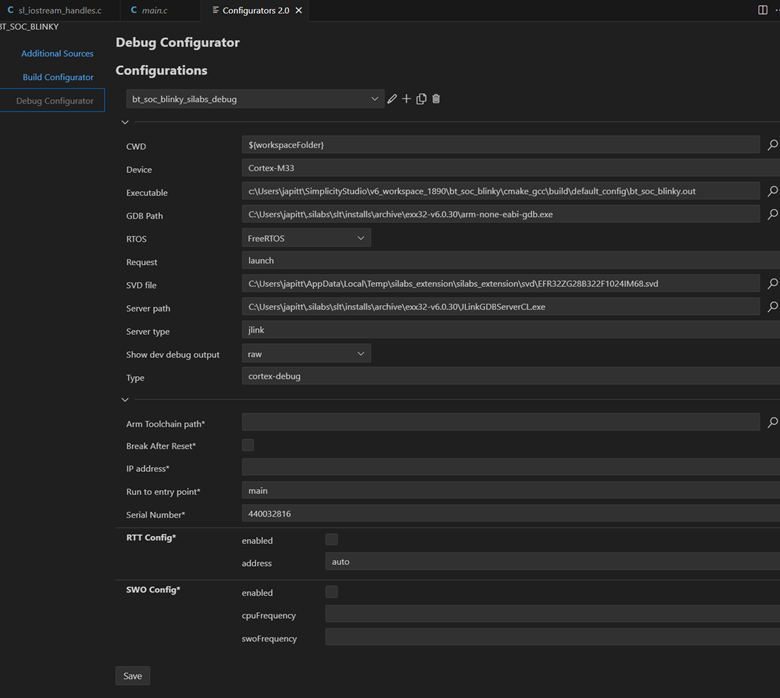
Common Settings#
Break after Reset: Stops code execution after a reset instead of running to
main.Run to entry point: Defaults to
main, but you can change it for special debugging scenarios.
Enable the RTT Config or SWO Config sections (or both) to apply custom settings for those terminals. The default settings are typically sufficient.