Application Debugging#
The following section provides information on enabling different types of debug logs in the SDK, monitoring sockets and internal queues, collecting RAM dumps, and performing other debugging steps listed further.
Enable Debug log for the WiSeConnect SDK#
The WiSeConnect SDK incorporates SL_DEBUG_LOG_V2 statements within various internal functions, providing valuable insights for debugging and troubleshooting during development.
The SL_DEBUG_LOG_V2 debug logs appear in the following format:
SL_DEBUG_LOG_V2(ERROR, " MAC address failed \r\n");To enable SL_DEBUG_LOG_V2 output in Simplicity Studio, install the Log Backend I/O Stream - Formatted Output (si91x_log_iostream_formatted) component and set the compile-time log level to DEBUG. See the Enable Additional Logs section for the complete workflow. Alternatively, set SL_LOG_CONFIG_LEVEL_COMPILE_TIME to SL_LOG_CONFIG_LEVEL_DEBUG in config/sl_log_common_config.h.
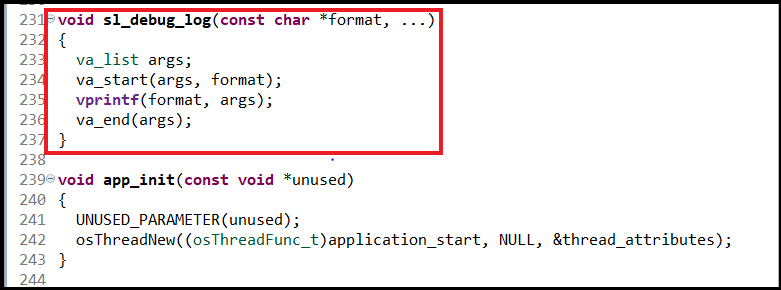
Note: Instead of displaying all
SL_DEBUG_LOG_V2prints, you can customize the SDK to selectively enable debug log prints from specific sections of the SDK, allowing for more focused and efficient debugging. This is explained in the following sections.
Monitoring Only Tx and Rx Frames#
The transmit (H TX->) and receive (H RX->) frames are printed using SL_DEBUG_LOG_V2 statements from a single location:
components/device/silabs/si91x/wireless/sli_hal_si91x/src/sli_hal_si91x.cTx frames (host → NWP) are logged in the
sli_hal_si91x_send_packet_to_bus()function:
SL_DEBUG_LOG_V2(DEBUG, "H TX-> Q: %u, C: 0x%X, L: %u.\r\n", queue_id, frame_type, packet_length);Rx frames (NWP → host) are logged in the
sli_hal_si91x_handle_rx_event()function:
SL_DEBUG_LOG_V2(DEBUG, "H RX-> Q: %u, C: 0x%X, L: %lu,", firmware_queue_id, packet->command, rx_buffer->length);
SL_DEBUG_LOG_V2(DEBUG, " S: 0x%x.\r\n", frame_status);Because both data and command frames are transmitted through the same HAL path, enabling these logs captures Tx frames, Rx frames, and Tx data frames together.
These are DEBUG level logs and are disabled by default. To view them, raise the compile-time log level as described below.
Enable the Tx and Rx Frame Logs#
Note: For Simplicity Studio projects, the recommended approach is to install the Log Backend I/O Stream - Formatted Output (
si91x_log_iostream_formatted) component and set the compile-time log level in the component configuration. See the Enable Additional Logs section for the complete workflow. Alternatively, you can setSL_LOG_CONFIG_LEVEL_COMPILE_TIMEdirectly inconfig/sl_log_common_config.has described below.
To set the compile-time log level manually, edit the SL_LOG_CONFIG_LEVEL_COMPILE_TIME macro in the sl_log_common_config.h file. This file is generated separately for every example, so the change only affects the example you edit.
Open the
sl_log_common_config.hfile located in theconfigfolder of your project:config/sl_log_common_config.hSet the compile-time log level to DEBUG:
#define SL_LOG_CONFIG_LEVEL_COMPILE_TIME SL_LOG_CONFIG_LEVEL_DEBUG
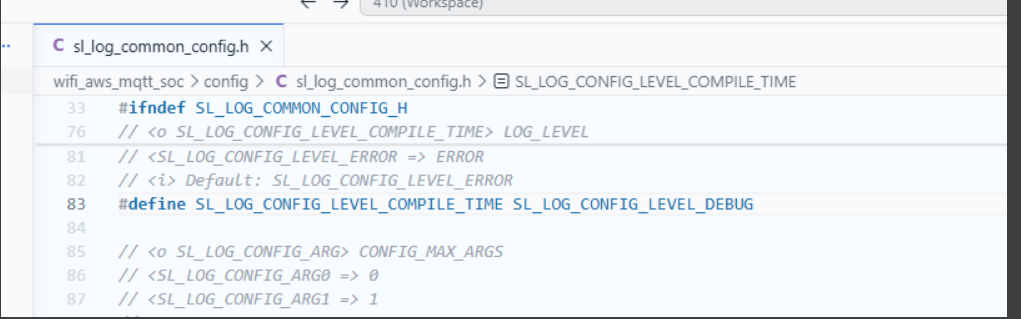
Rebuild and flash the application.
Each logged frame is printed in the following format, where:
Qis the internal command queue ID.Cis the command/frame type. A Tx frame ID typically has a matching Rx frame ID that represents the response to the command.Lis the packet length.S(in theH RX->line) is the returned status code.0x0indicates success, while a non-zero value indicates an error. See the Status Codes section for details.Expected Output:
H TX-> Q: 4, C: 0x10, L: 40. H RX-> Q: 4, C: 0x10, L: 0, S: 0x0.
Notes:
SL_DEBUG_LOG_V2sends its output to the configured log backend. In Simplicity Studio, install the Log Backend I/O Stream - Formatted Output (si91x_log_iostream_formatted) component to route these logs to the console. For the complete Simplicity Studio workflow, see the Enable Additional Logs section.Setting the level to DEBUG also enables the other
SL_DEBUG_LOG_V2messages in the SDK. If you want to see only theH TX->andH RX->frames with less verbose output, change the level argument of these specificSL_DEBUG_LOG_V2statements fromDEBUGtoINFOinsli_hal_si91x.c, and then setSL_LOG_CONFIG_LEVEL_COMPILE_TIMEtoSL_LOG_CONFIG_LEVEL_INFO.
Monitor Specific Tx and Rx Commands#
To focus on specific Tx and Rx logs, filter them by the queue ID (and, if required, the command/frame type). For instance, to log only BLE commands, follow these steps:
Note: Changes made to
sli_hal_si91x.cin the SDK components folder are for temporary debugging only and are lost when you upgrade or regenerate the SDK.
Navigate to the following path in the project folders:
components/device/silabs/si91x/wireless/sli_hal_si91x/srcOpen the file
sli_hal_si91x.c.Filter Tx frames by wrapping the Tx log in the
sli_hal_si91x_send_packet_to_bus()function with a queue ID check. For example, to log only BLE (SLI_BT_Q) commands:if (queue_id == SLI_BT_Q) { SL_DEBUG_LOG_V2(DEBUG, "H TX-> Q: %u, C: 0x%X, L: %u.\r\n", queue_id, frame_type, packet_length); }Filter Rx frames by wrapping the Rx log in the
sli_hal_si91x_handle_rx_event()function with the same check:if (firmware_queue_id == SLI_BT_Q) { SL_DEBUG_LOG_V2(DEBUG, "H RX-> Q: %u, C: 0x%X, L: %lu,", firmware_queue_id, packet->command, rx_buffer->length); SL_DEBUG_LOG_V2(DEBUG, " S: 0x%x.\r\n", frame_status); }Note: Other queue IDs you can filter on include
SLI_WLAN_MGMT_Q(Wi-Fi management),SLI_WLAN_DATA_Q(Wi-Fi data), andSLI_LOG_Q(NWP logs).Ensure the compile-time log level is set to DEBUG in
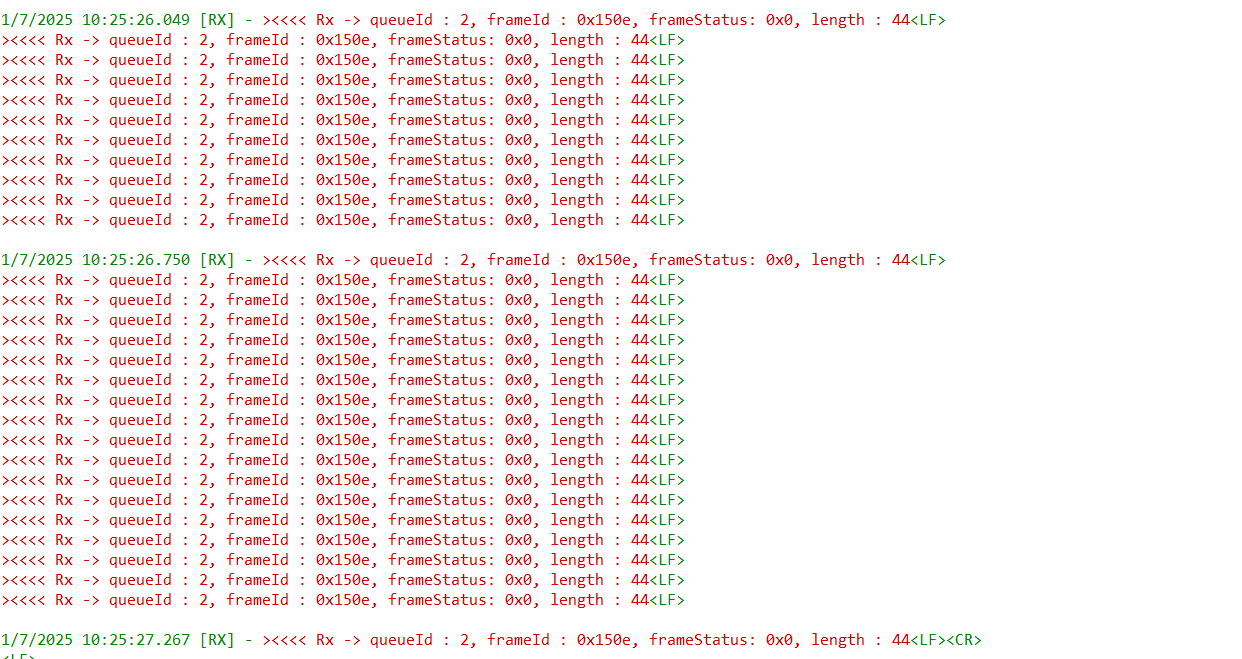
config/sl_log_common_config.h(see Enable the Tx and Rx Frame Logs), then rebuild and flash the application.Expected Output:
Monitor Command Payload Descriptor and Payload#
If you need the command descriptor and payload in addition to the H TX-> and H RX-> summary logs, update the current host/NWP command path in components/device/silabs/si91x/wireless/sli_hal_si91x/src/sli_hal_si91x.c.
Note: Changes made to
sli_hal_si91x.cin the SDK components folder are for temporary debugging only and are lost when you upgrade or regenerate the SDK.
Monitor TX Command Descriptor and Payload#
Open
sli_hal_si91x.c.In
sli_hal_si91x_send_packet_to_bus(), add prints before thesli_si91x_bus_write_frame(...)call.Print the 16-byte descriptor from
buffer->descand then print the payload bytes frombuffer->data. The payload length is stored in the lower 12 bits ofbuffer->length(buffer->length & 0x0FFF) and excludes the 16-byte descriptor.
Example:
SL_DEBUG_LOG_V2(DEBUG, "TX desc: ");
for (uint32_t i = 0; i < 16; i++) {
SL_DEBUG_LOG_V2(DEBUG, "%02x ", (uint32_t)buffer->desc[i]);
if ((i + 1) % 8 == 0) {
SL_DEBUG_LOG_V2(DEBUG, " ");
}
}
SL_DEBUG_LOG_V2(DEBUG, "\nTX payload: ");
for (uint32_t i = 0; i < (buffer->length & 0x0FFF); i++) {
SL_DEBUG_LOG_V2(DEBUG, "%02x ", (uint32_t)buffer->data[i]);
if ((i + 1) % 16 == 0) {
SL_DEBUG_LOG_V2(DEBUG, "\n");
}
}
SL_DEBUG_LOG_V2(DEBUG, "\n");Expected Output:
The following example is from the station_ping example. Descriptor and payload byte values vary by command; the L field in the H TX-> line matches the number of payload bytes printed.
TX desc: 28 00 40 10 00 00 00 00 00 00 00 00 00 00 00 00
TX payload: 00 01 02 03 04 05 06 07 08 09 0a 0b 0c 0d 0e 0f
10 11 12 13 14 15 16 17 18 19 1a 1b 1c 1d 1e 1f
20 21 22 23
H TX-> Q: 4, C: 0x10, L: 40.Monitor RX Command Descriptor and Payload#
Open
sli_hal_si91x.c.In
sli_hal_si91x_handle_rx_event(), add prints after the packet is cast fromrx_buffer->data.Print the 16-byte descriptor from
packet->descand then print the payload bytes frompacket->data. The payload length is stored in the lower 12 bits ofpacket->length(packet->length & 0x0FFF) and excludes the 16-byte descriptor. This matches theLfield in theH RX->log.
Example:
SL_DEBUG_LOG_V2(DEBUG, "RX desc: ");
for (uint32_t i = 0; i < 16; i++) {
SL_DEBUG_LOG_V2(DEBUG, "%02x ", (uint32_t)packet->desc[i]);
if ((i + 1) % 8 == 0) {
SL_DEBUG_LOG_V2(DEBUG, " ");
}
}
SL_DEBUG_LOG_V2(DEBUG, "\nRX payload: ");
for (uint32_t i = 0; i < (packet->length & 0x0FFF); i++) {
SL_DEBUG_LOG_V2(DEBUG, "%02x ", (uint32_t)packet->data[i]);
if ((i + 1) % 16 == 0) {
SL_DEBUG_LOG_V2(DEBUG, "\n");
}
}
SL_DEBUG_LOG_V2(DEBUG, "\n");Expected Output:
The following examples are from the station_ping example. The first shows a response with no payload (L: 0); the second shows a response with payload data (L: 54).
RX desc: 00 00 40 10 00 00 00 00 00 00 00 00 00 00 00 00
RX payload:
H RX-> Q: 4, C: 0x10, L: 0, S: 0x0.RX desc: 36 00 40 13 00 00 00 00 00 00 00 00 00 00 00 00
RX payload: 00 01 02 03 04 05 06 07 08 09 0a 0b 0c 0d 0e 0f
10 11 12 13 14 15 16 17 18 19 1a 1b 1c 1d 1e 1f
20 21 22 23 24 25 26 27 28 29 2a 2b 2c 2d 2e 2f
30 31 32 33 34 35
H RX-> Q: 4, C: 0x13, L: 54, S: 0x0.Enable Error Logs#
These error logs are crucial for pinpointing the file and line number where the issue arises.
To enable the error logs for critical issues, define the PRINT_ERROR_LOGS macro:
Navigate to the following path in the project folders:
components/common/inc/Open the file
sl_constants.h.Enable PRINT_ERROR_LOGS MACRO as illustrated below.
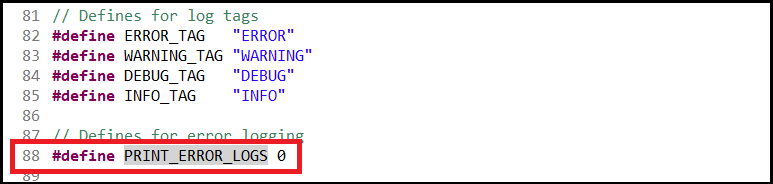
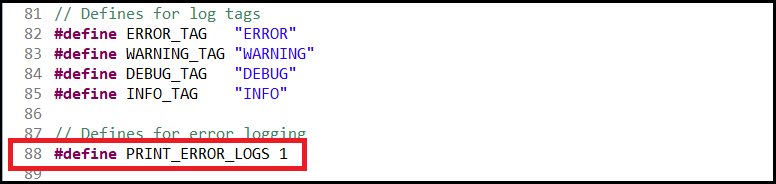
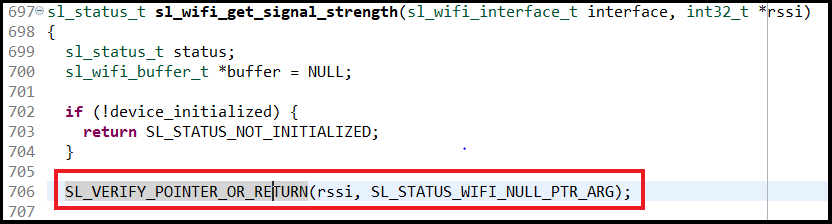
Enabling error logging will capture errors whenever the following SDK functions are called. Use the following listed functions in areas where an issue is suspected. This error logging identifies the specific functions where the problem occurs.
SL_VERIFY_POINTER_OR_RETURNVERIFY_STATUS_AND_RETURNVERIFY_STATUS_AND_GOTO

Monitor Sockets in the SDK#
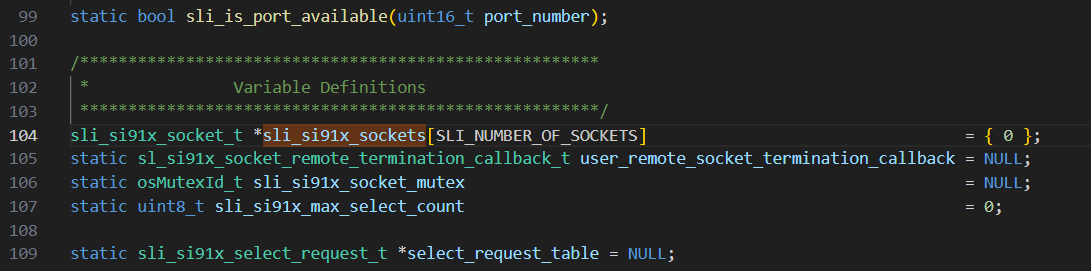
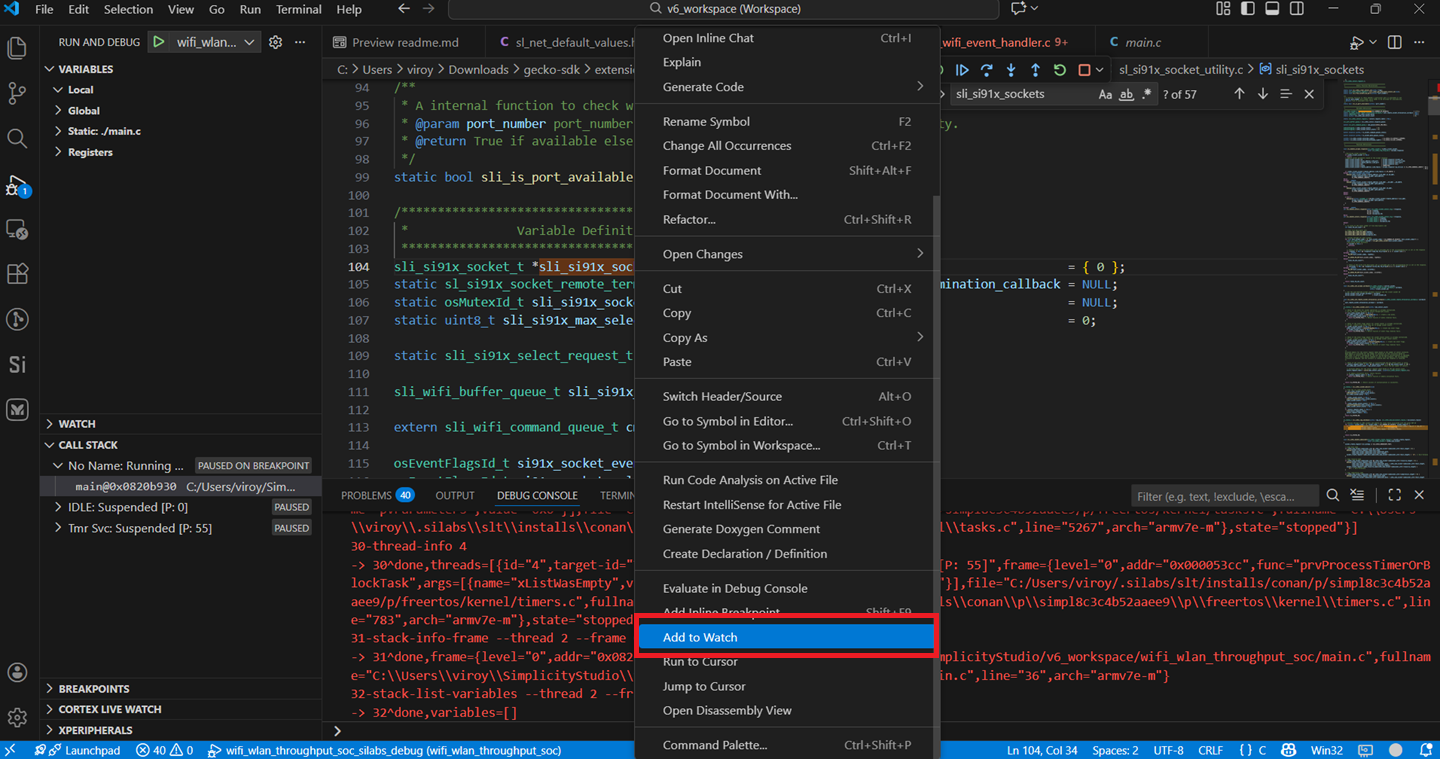
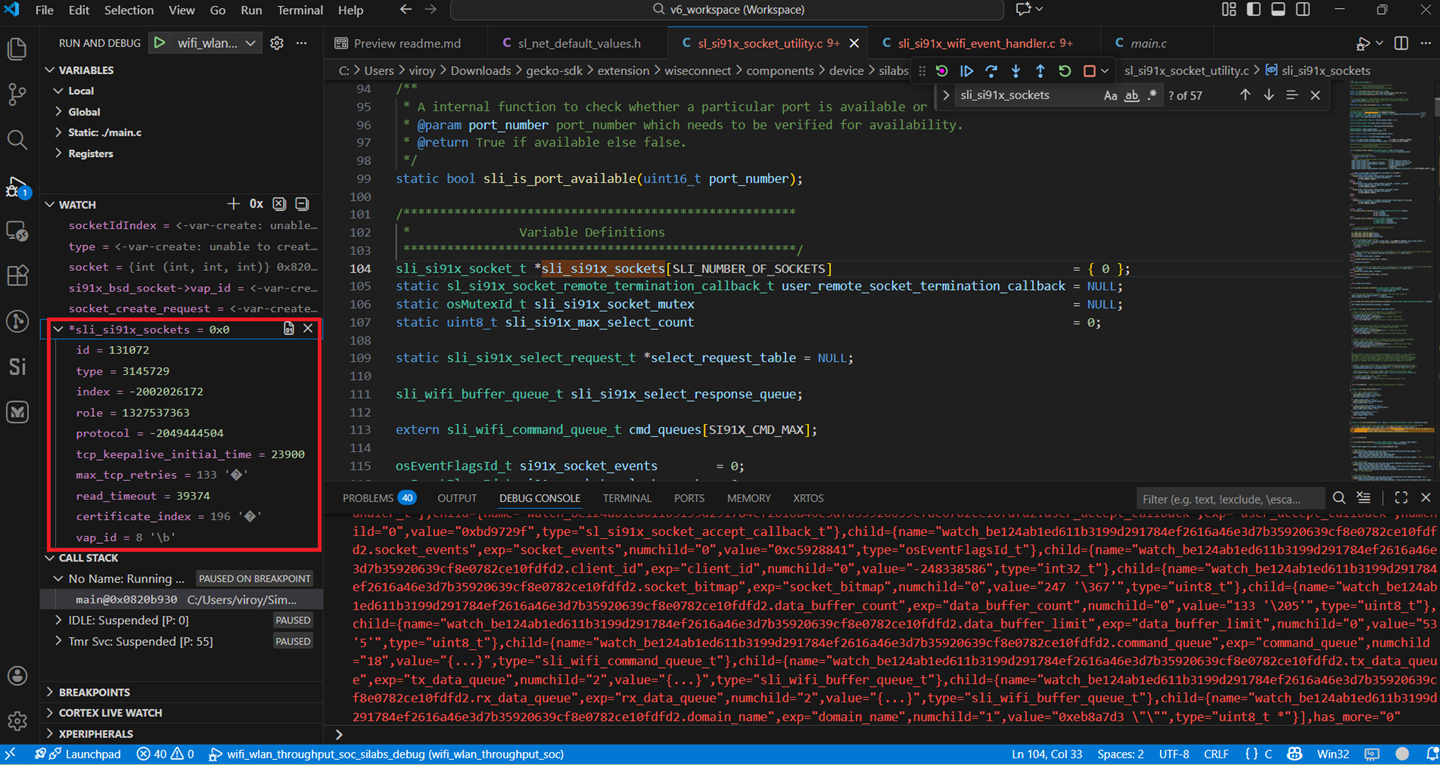
To view all the sockets, add the sli_si91x_sockets variable to the debugger’s watch window (for example, in Simplicity Studio).
Navigate to the following path in the project folders:
components/device/silabs/si91x/wireless/socket/src/Open the file
sl_si91x_socket_utility.c.Right-click on the
sli_si91x_socketsvariable, as shown below. To monitor its value during debugging, add thesli_si91x_socketsvariable to the watch window.
Socket Configuration and State Information#
Each socket can be accessed using the
sli_si91x_sockets[i]structure, whereistands for the socket File Descriptor (FD).If the socket is in a closed state, it indicates that the information provided by this structure is invalid or garbage.
Internal Queue Types in the SDK#
The SDK includes five distinct types of internal command queues. The following are the queues listed with their specific purpose or functionality:
Common -
cmd_queues[0]Wi-Fi -
cmd_queues[1]Network -
cmd_queues[2]BLE -
cmd_queues[3]Socket -
cmd_queues[4]
Each of these command types has a corresponding instance in global data memory, represented by the sli_si91x_command_queue_t structure.
Role of the sli_si91x_command_queue_t Structure#
The
sli_si91x_command_queue_tstructure plays an essential role in managing and tracking the internal command queues within the SDK. It helps to efficiently monitor the communication between the host and NWP through the respective command types.
Key Variables in the sli_si91x_command_queue_t Structure#
tx_queue: TX command queue.
rx_queue: RX command queue.
event_queue: Event queue.
frame_type: Indicates the latest command sent to the NWP.
tx_counter: Tracks the total number of transmitted commands between the host and NWP for this queue type.
rx_counter: Tracks the total number of received commands between the host and NWP for this queue type.
packet_id: Represents the packet ID of the latest command sent to the NWP.
flags: Indicates whether the last command sent to the NWP was synchronous or asynchronous.
command_tickcount: Represents the tick count when the command was added by the application thread.
command_timeout: Specifies the maximum timeout that the application thread should wait for a response.
These variables help to efficiently manage and track the communication between the host and NWP through the internal queues.
Monitor Internal Queues#
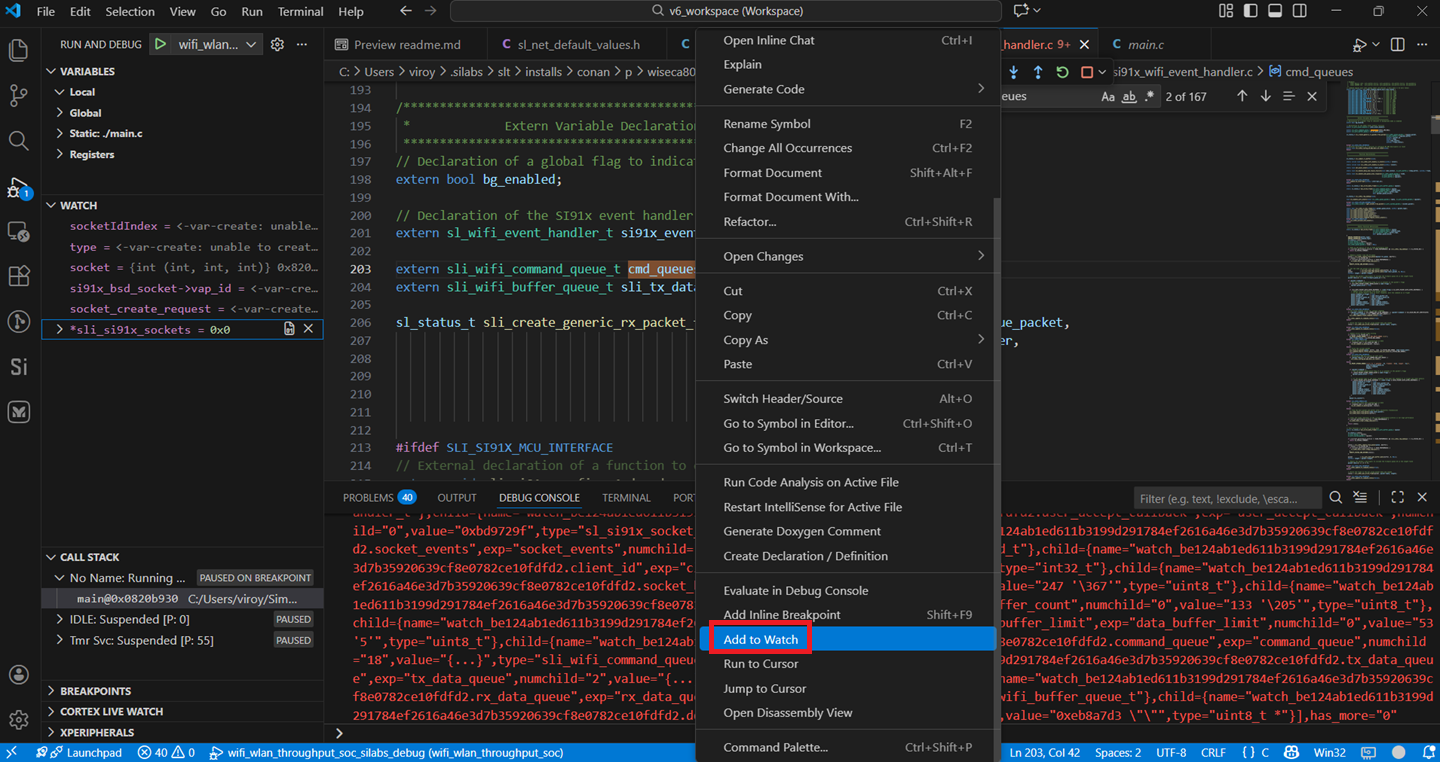
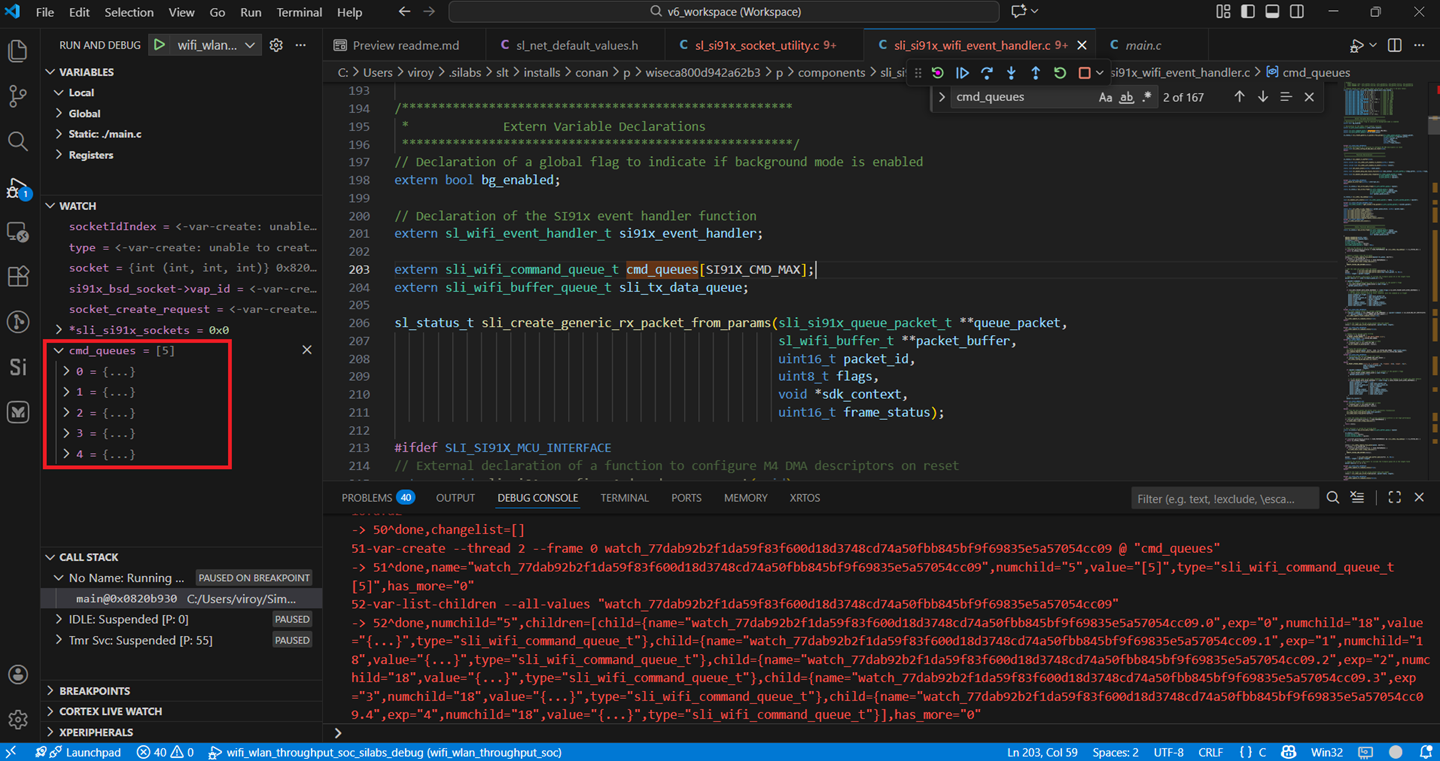
To track internal SDK queues, add the cmd_queues variable to the watch window in the debugger.
Navigate to the following path in the project folders:
wiseconnect/components/sli_si91x_wifi_event_handler/srcOpen the file
sli_si91x_wifi_event_handler.c.Right-click on the
cmd_queuesvariable, as shown below, add it to the watch window for monitoring its value during debugging.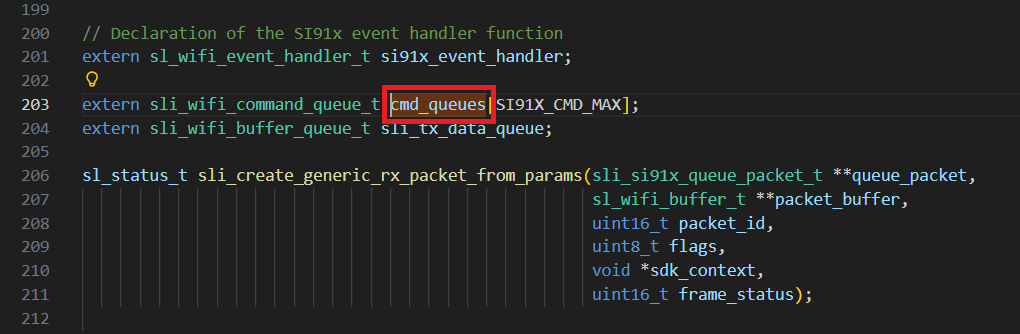
Procedure for Capturing NWP RAM Dump#
Enabling NWP Debug Logs#
To capture NWP logs via NWP UART, enable the SL_SI91X_EXT_FEAT_UART_SEL_FOR_DEBUG_PRINTS bit (BIT(27)) in the
ext_custom_feature_bit_mapof the device configuration. This allows the NWP logs to be redirected to the UART port.To capture NWP logs via NWP UART2, enable the SL_SI91X_ULP_GPIO9_FOR_UART2_TX
For SoC mode, M4 UART is set to ULP GPIO 9, to obtain NWP UART2 prints, M4 UART instance has to be changed via configurator and also VCOM port has to be disabled via admin device console in studio.
Follow below Steps to change M4 UART insatnce and to disable VCOM port.
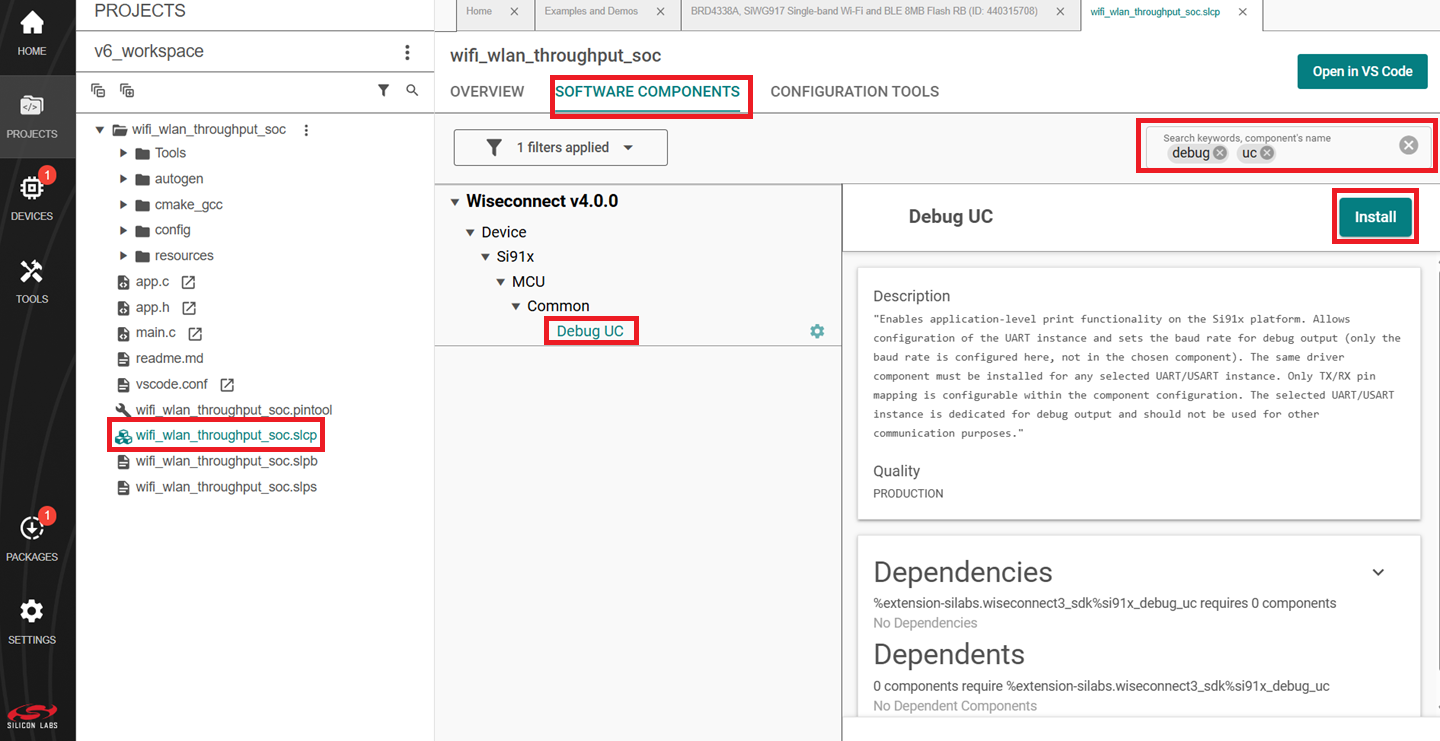
Open Project file(.slcp) and select Software Components.
Search for 'debug' and install the Debug UC component.
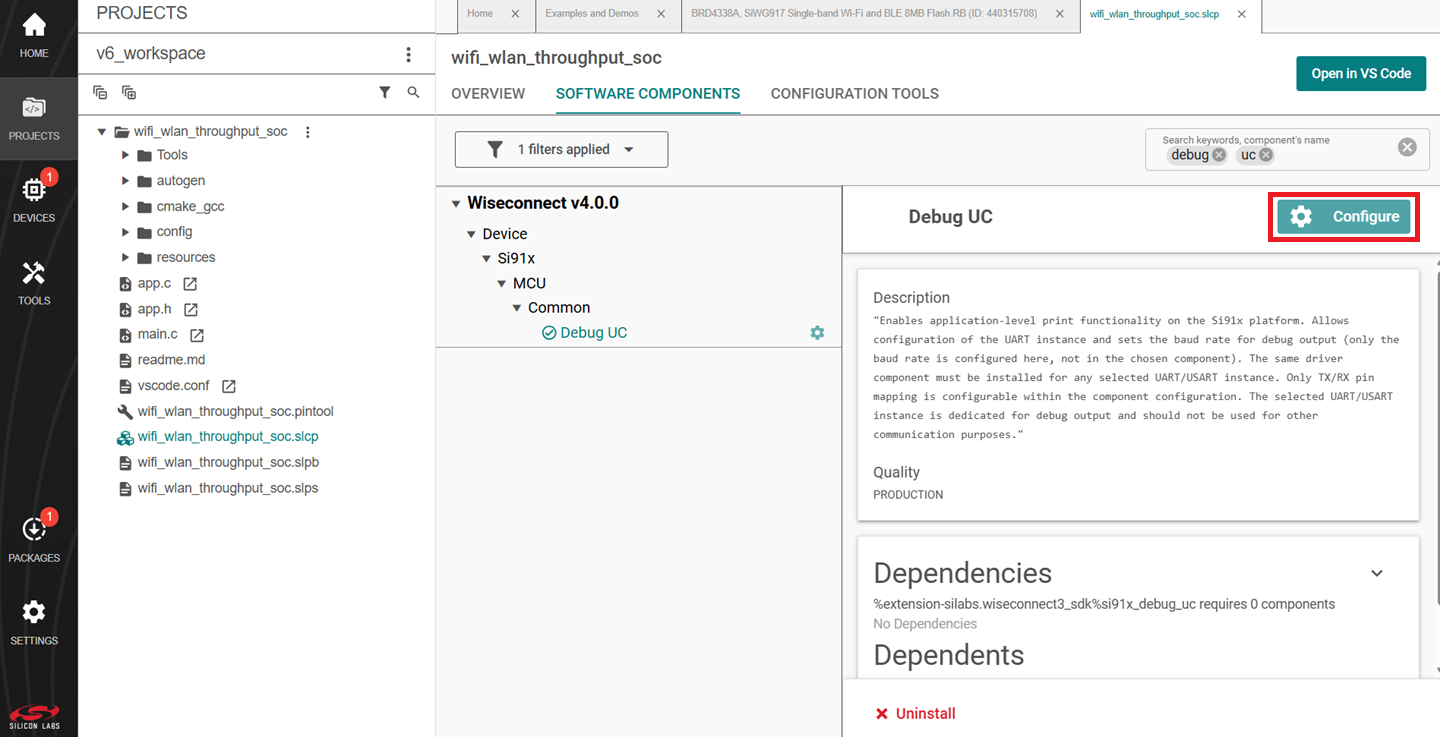
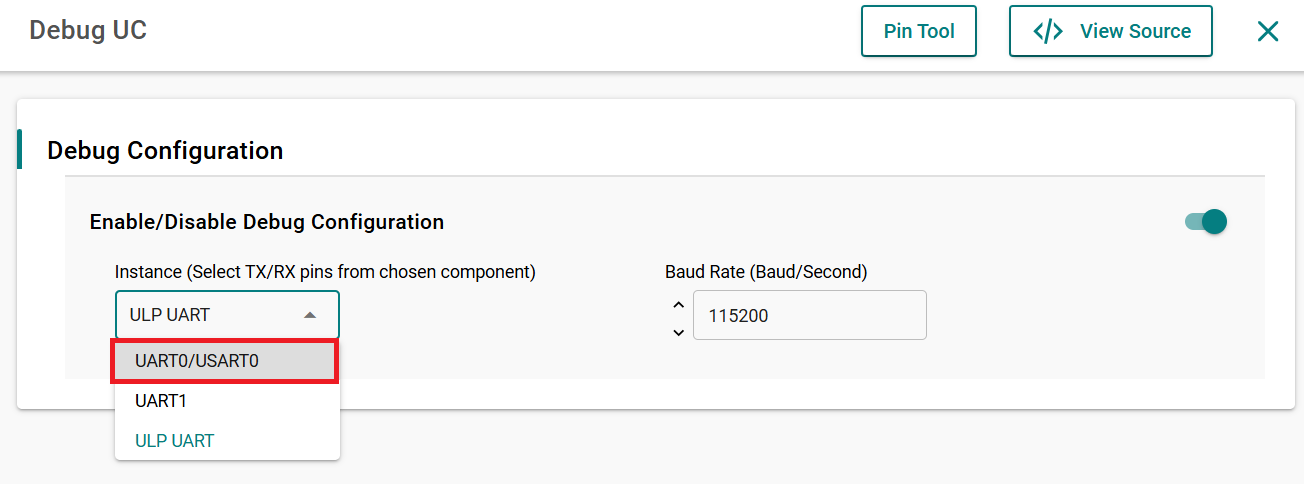
Click on configure and the change the UART instance to UART0/USART0 or UART1.
Disable the VCOM port
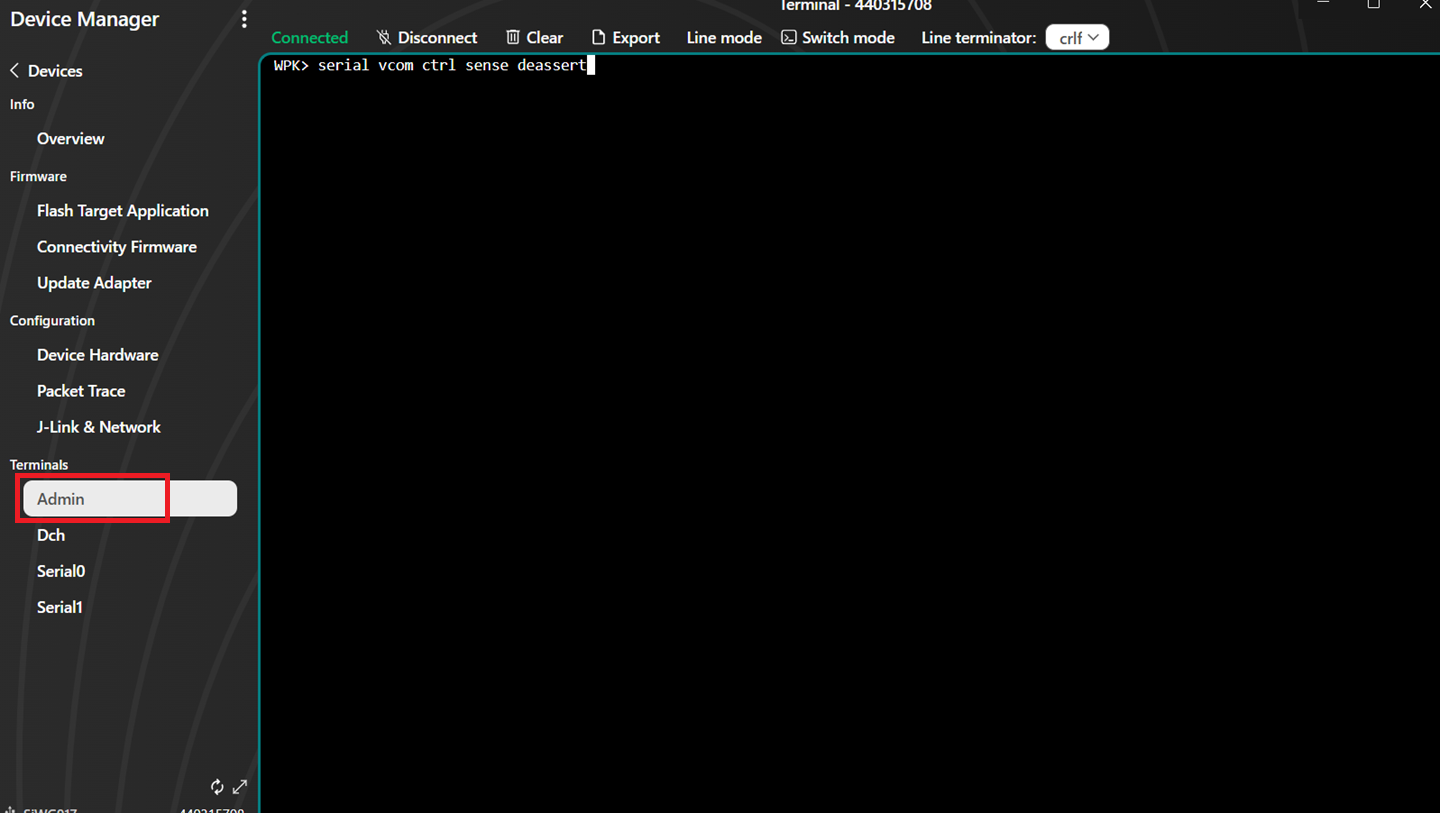
Open Admin terminal from TOOLS > Simplicity Device Manager > Open Tool > admin and issue the below command.
serial vcom ctrl sense deassertAfter issuing the above command, VCOM light on BRD4002A board would be disabled.
Connect TTL converter to ULP GPIO 9 (F7 on BRD4002A).
Notes:
To re-enable VCOM port, issue the below command
serial vcom ctrl sense assertTo check the UART pin connections, see the SL_SI91X_EXT_FEAT_UART_SEL_FOR_DEBUG_PRINTS.
Identifying Memory Configuration for SOC and NCP#
For RAM dump logs, it's essential to know the memory configuration used in the application, as it determines the NWP RAM size. There are different configurations for SOC and NCP.
SOC Memory Configurations#
Memory Configuration 1: NWP RAM size = 480 KB
Memory Configuration 2: NWP RAM size = 416 KB
Memory Configuration 3: NWP RAM size = 352 KB
NCP Memory Configuration#
Memory Configuration: NWP RAM size = 672 KB
Memory Configuration: NWP RAM size = 352 KB
Determine the memory configuration in the application and use the corresponding API to capture the RAM dump.
API for Capturing NWP RAM Dump#
Use the sl_si91x_get_ram_log API to capture the NWP RAM dump.
sl_si91x_get_ram_log(uint32_t address, uint32_t length);Address: Use
0for the base address.Length: Use the appropriate value based on the memory configuration (for example, 480 KB for Memory Configuration 1).
Example:
For Memory Configuration 1 (480 KB):
sl_si91x_get_ram_log(0, 480 * 1024);Note: Once the
sl_si91x_get_ram_logAPI is executed, the NWP RAM content is displayed on the console of TeraTerm/Docklight via the NWP UART port.
Follow these steps to capture the content displayed on the Docklight console.
Follow the steps below to change the baud rate to capture NWP RAM DUMP via the NWP UART PORT. The baudrate to capture via the NWP UART PORT is 460800.
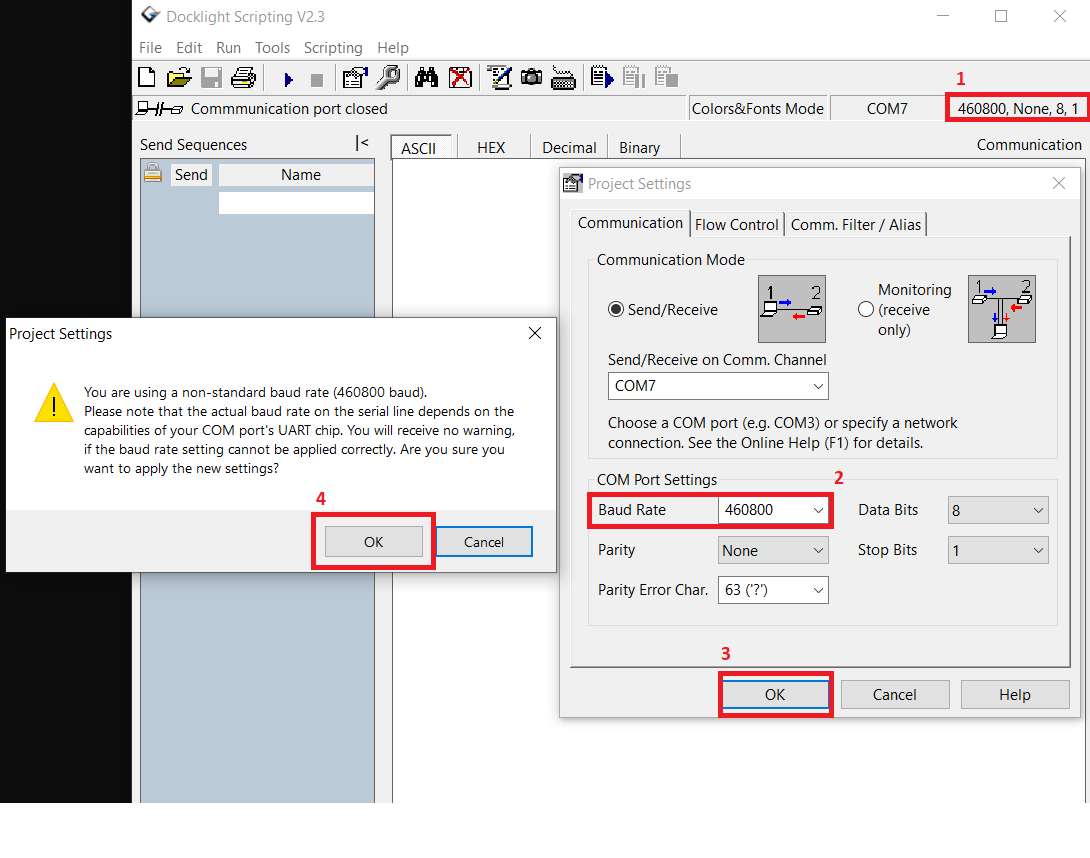
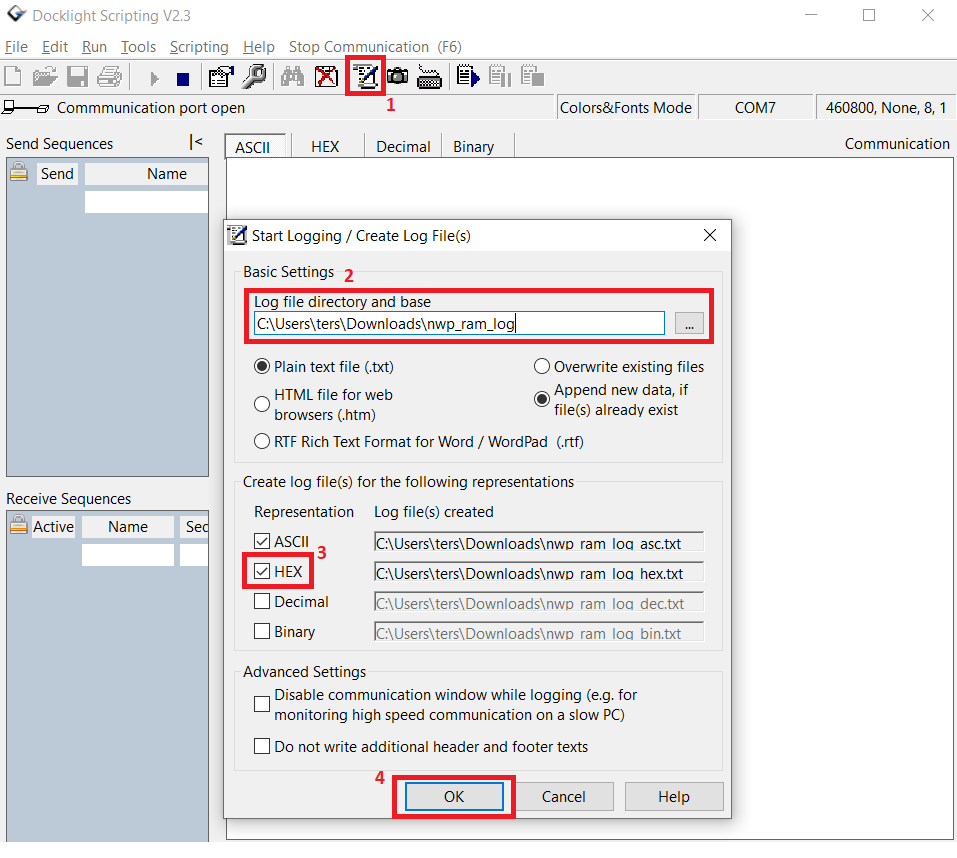
Click on Start Communication Logging button. Give the path in which the file to be saved.
Select HEX to save the content in Hexadecimal format and click OK.
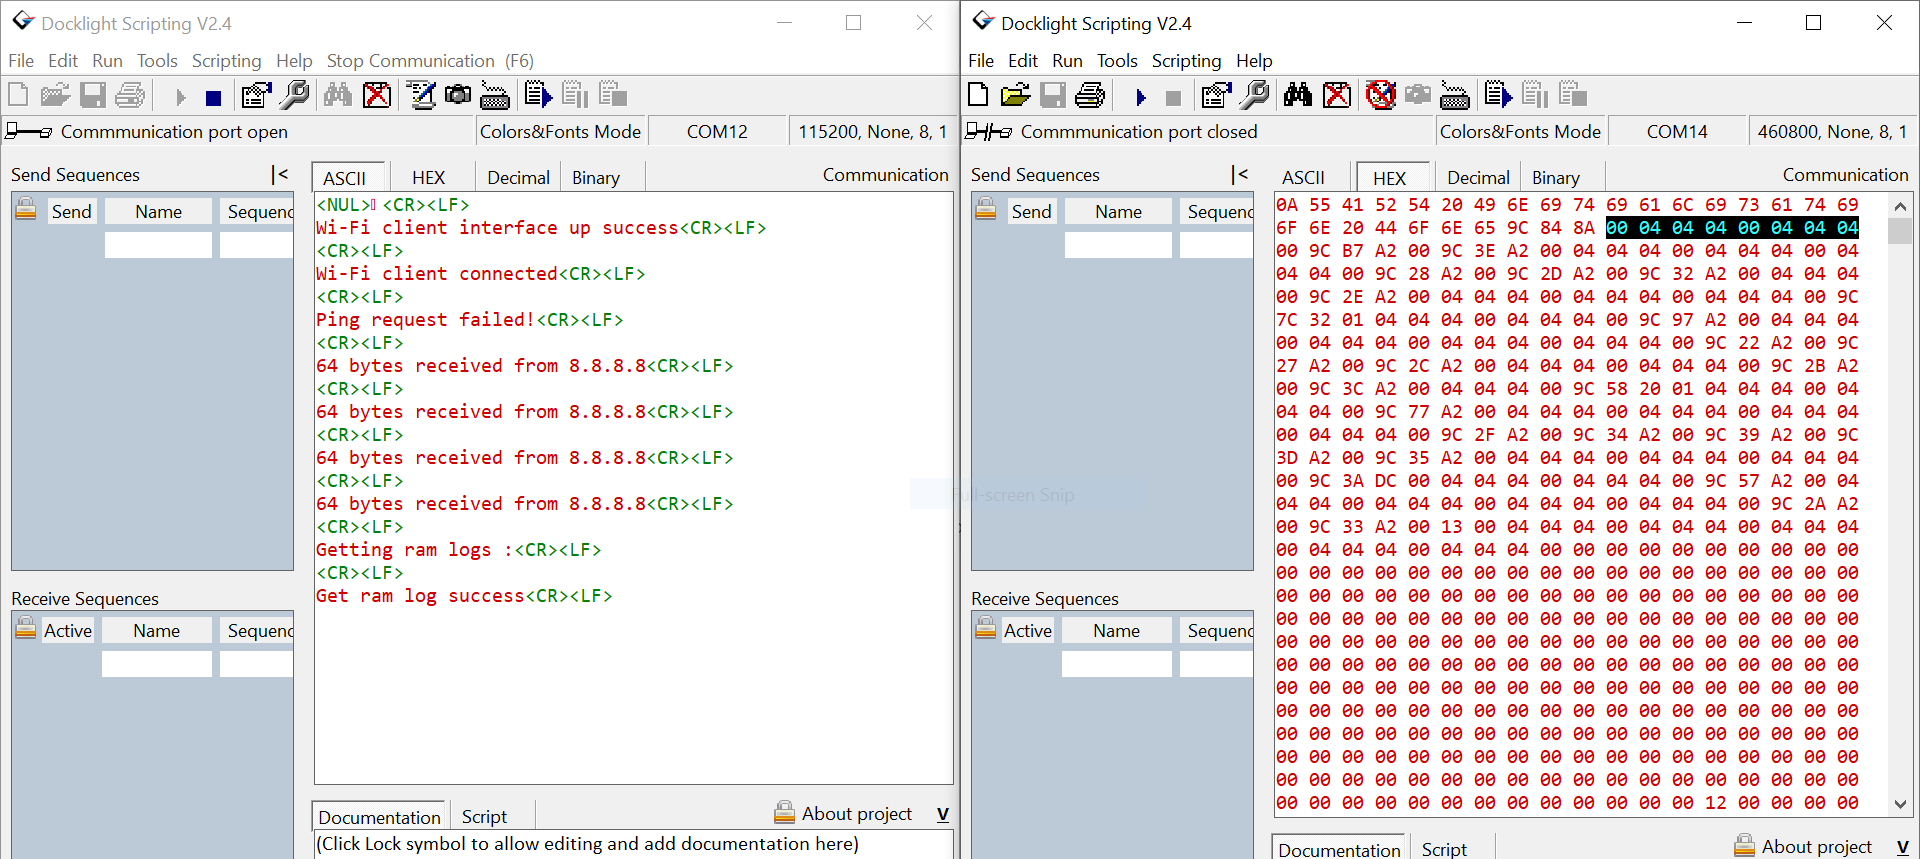
For a valid RAM dump, the recurring pattern of 00040404 00040404 can be observed in the dump data captured in the docklight logs. This pattern can also be seen in the saved hex file.
Retrieving NWP Thread Program Counter and Register Values#
NWP runs with four threads. When an issue occurs, capturing the Program Counter (PC) value and the register values for each thread helps in identifying the source of the problem.
Program Counter Values for NWP Threads#
Each thread has a specific PC located at a calculated address. The following formula is used to retrieve the PC values for each thread.
Program Counter Address (PC):
The Program Counter address in the NWP is calculated using the thread number (thread_no), with four available threads (0, 1, 2, 3).
Calculate the Program Counter address based on the thread number using the following formula, and use this address with the
sl_si91x_get_ram_logAPI to capture the Program Counter value for the respective thread.
program counter address = 0x22000420 + (0x80 * thread_no)API is called to retrieve the Program Counter value:
program counter value = sl_si91x_get_ram_log(Program counter address, 4);
Note: The Program Counter for each thread is 4 bytes in size.
Register Values for NWP Threads#
To calculate the register values stored at specified addresses for each NWP thread, the following approach is used:
Register address:
`0x2200047c + (0x80 * thread_no)`Threads 0, 1, 2, and 3 are used in the NWP.
Register content address:
`0x22000440 + (0x80 * thread_no) + (Register Number * 4)`API is called to retrieve the register values.
sl_si91x_get_ram_log(Register address, 4);
Note: Each thread contains 16 registers (R0-R15), with each register being 4 bytes in size.
The R15 register works as a Stack Pointer (SP).
Considerations for NWP Hang#
If NWP gets stuck (hang) and no further responses are received from the
sl_si91x_get_ram_logAPI call, it will not capture the RAM dump.
Conclusion#
By following this procedure, you can capture essential debugging information such as RAM dumps, program counter values, and register values for all NWP threads. This information helps in re-engineering the debugging process, and resolve issues more efficiently. Further, enable debug logs, filter specific log types, and monitor key components such as frames, error logs, sockets, and internal queues to more easily identify and address issues within the SDK.
Platform Application Debugging Guide#
Powersave Application Debug#
Introduction#
Power-save mode debugging is a specialized process for analyzing and troubleshooting applications designed to minimize power consumption on microcontrollers like the Cortex-M4. These applications often operate in ultra-low-power states, transitioning between active and sleep modes to conserve energy. Debugging in such scenarios requires careful attention to avoid disrupting the low-power functionality.
Key challenges in power-save debugging include:
Limited Debug Control: Accessing the microcontroller without causing wake-ups or interrupting the power-save state.
Sleep/Wake Transitions: Ensuring the application properly enters and exits low-power modes.
Peripheral Behavior: Verifying peripherals are correctly configured to shut down or remain functional as required.
To address these challenges, developers employ techniques such as using energy-efficient debugging interfaces (for example, SWD and, ITM), monitoring power consumption with energy profiling tools, and analyzing system behavior using hardware or software breakpoints. Additionally, firmware instrumentation and external tools like oscilloscopes can provide valuable insights.
By leveraging the right tools and methods, debugging power-save modes ensures optimal power efficiency while maintaining application reliability.
Debugging Modes#
GPIO-based Debugging#
Debugging in power-save applications presents unique challenges due to the limited availability of traditional debugging interfaces in low-power states. To address these limitations, GPIO-based debugging techniques provide an efficient and reliable alternative. By leveraging GPIOs that remain operational across various power states, developers can trace program execution and monitor critical events without disrupting the application's low-power operation.
This approach involves initializing specific GPIO pins at the start of the application and using them strategically to signal, log, or trace key events or transitions during execution. With proper configuration, GPIOs can serve as versatile tools to gain insights into program flow, identify bottlenecks, and resolve issues while maintaining the integrity of power-saving features.
In this document, we explore practical techniques and use cases for employing GPIOs in debugging power-save applications, ensuring developers can maintain performance and efficiency throughout the debugging process.
#define PIN_NUMBER 0 // This is the UULP pin number being used for debugging
MCU_RET->NPSS_GPIO_CNTRL[PIN_NUMBER].NPSS_GPIO_CTRLS_b.NPSS_GPIO_MODE = 0; // Mode 0 as GPIO
MCU_RET->NPSS_GPIO_CNTRL[PIN_NUMBER].NPSS_GPIO_CTRLS_b.NPSS_GPIO_OEN = 0; // Configuring direction as output
MCU_RET->NPSS_GPIO_CNTRL[PIN_NUMBER].NPSS_GPIO_CTRLS_b.NPSS_GPIO_OUT = 1; // This is to set/clear GPIO levelAdd GPIO control logic In sleep wakeup path at rsi_deepsleep_soc source file, before and after wakeup to identify system is in sleep or wake up.
MCU_RET->NPSS_GPIO_CNTRL[PIN_NUMBER].NPSS_GPIO_CTRLS_b.NPSS_GPIO_OUT = 0; // Indicating device in sleep state
/*Enter sleep with retention*/
if (sleepType == SLEEP_WITH_RETENTION) {
/*If retention mode is enabled save the CPU context*/
RSI_PS_SaveCpuContext();
} else {
/*Clear RAM retentions*/
RSI_PS_ClrRamRetention(M4ULP_RAM16K_RETENTION_MODE_EN | TA_RAM_RETENTION_MODE_EN | M4ULP_RAM_RETENTION_MODE_EN
| M4SS_RAM_RETENTION_MODE_EN);
/*do not save CPU context and go to deep sleep */
__asm("WFI");
}
MCU_RET->NPSS_GPIO_CNTRL[PIN_NUMBER].NPSS_GPIO_CTRLS_b.NPSS_GPIO_OUT = 1; //indicating device in wakeup stateIn the above scenario a GPIO logic HIGH indicates that the device is in an active state, allowing the user to connect any debugging tool and trace the application. Conversely, if the GPIO is at logic LOW, it signifies that the device is not accessible for debugging, as the debugging interface is unavailable.
Debugging tickless idle application is difficult as it trigger sleep function when device in idle state. To debug the pre-condition status before entering sleep mode, add GPIO controls in the sl_si91x_low_power_tickless_mode source file to investigate
// Checking the pre-sleep conditions. If these conditions are met, the core does not enter sleep mode.
if ((eTaskConfirmSleepModeStatus() == sl_eAbortSleep) || (sl_si91x_power_manager_is_ok_to_sleep() == false)) {
xExpectedIdleTime = 0;
// Enable the NVIC interrupts.
__asm volatile("cpsie i" ::: "memory");
MCU_RET->NPSS_GPIO_CNTRL[PIN_NUMBER].NPSS_GPIO_CTRLS_b.NPSS_GPIO_OUT = 0; //indicating pre sleep condition false
} else {
// Disable the chip level interrupt
MCU_RET->NPSS_GPIO_CNTRL[PIN_NUMBER].NPSS_GPIO_CTRLS_b.NPSS_GPIO_OUT = 1; //indicating pre sleep condition true and triggers sleepThe two scenarios mentioned above are provided as examples, but you can utilize these controls for further debugging since these GPIOs remain functional across all power states.
UART-based Debugging#
Debugging power-save applications presents unique challenges, especially when traditional debugging interfaces are unavailable in low-power modes. UART-based debugging techniques offer a valuable solution, allowing developers to monitor and trace application behavior without compromising the device’s power-saving features. By using UART communication, developers can transmit debug information such as error logs, status messages, and execution traces, all while the device operates in low-power states.
This approach involves configuring the UART interface to send critical information during key events, enabling efficient monitoring and troubleshooting. UART-based debugging ensures minimal impact on power consumption, making it an ideal choice for applications that require both performance optimization and real-time debugging.
In this document, we explore the key techniques, benefits, and best practices for using UART in power-save applications to enhance the debugging process and streamline development.
Note: The Si91X features a ULP UART that remains available in all active and standby states, except for sleep and shutdown modes. You can utilize this interface to debug low-power states such as PS2 and PS1. After the device enters sleep mode, the UART must be reconfigured by the user once it wakes up.
You can implement printing the status information of any API or register status in their application by simply adding the following code snippet
#include "rsi_debug.h" //this requires only in files where you wants to print the data through DEBUG_UART uint32_t reg_status= P2P_STATUS_REG; DEBUGOUT("\r\n P2P reg Status:%ld\r\n", reg_status); // printing the P2P status register statusYou can determine where the code is blocked or halted during execution by using a printf statement, as shown below:
Note:
sl_si91x_power_manager_sleep()is deprecated in WiSeConnect SDK v4.1.0. For new power-save applications, use the Power Manager service and tickless idle integration rather than calling this API directly. See Migrating from v4.0.2.printf("%s,%d\r\n",__FILE__,__LINE__); // Prints file name and line number of code it executed sli_iot_power_set_expected_idle(xExpectedIdleTime); printf("%s,%d\r\n",__FILE__,__LINE__); // Prints file name and line number of code it executed expected_sleep_ticks = xExpectedIdleTime; total_slept_os_ticks = 0; sl_si91x_power_manager_sleep(); printf("%s,%d\r\n",__FILE__,__LINE__); // Prints file name and line number of code it executed sl_power_manager_sleep_on_isr_exit(); ```
Using J-Link Commander#
J-Link Commander is a tool provided by SEGGER that allows low-level interaction with Cortex-M4 microcontroller using a J-Link debug probe. It is particularly useful for debugging power-save applications because it provides fine-grained control and debugging capabilities without disrupting the microcontroller's low-power states.
Here’s a step-by-step guide on how to use J-Link Commander for this purpose:
1. Install J-Link Software#
Download and install the SEGGER J-Link Software and Documentation pack from the SEGGER website.
Ensure you have the latest version for optimal support.
2. Launch J-Link Commander#
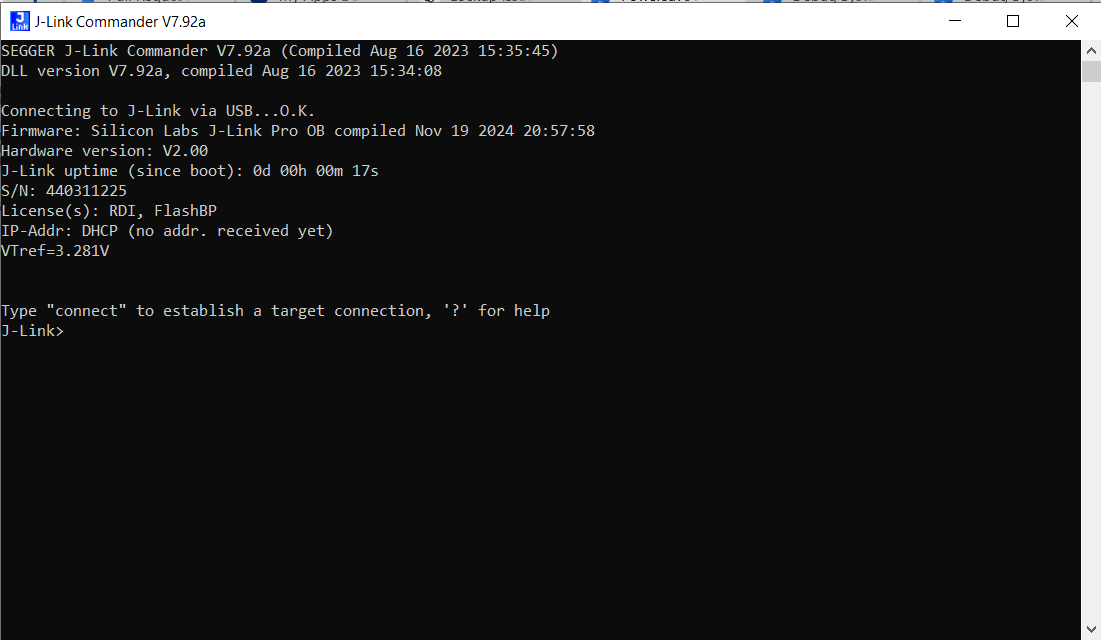
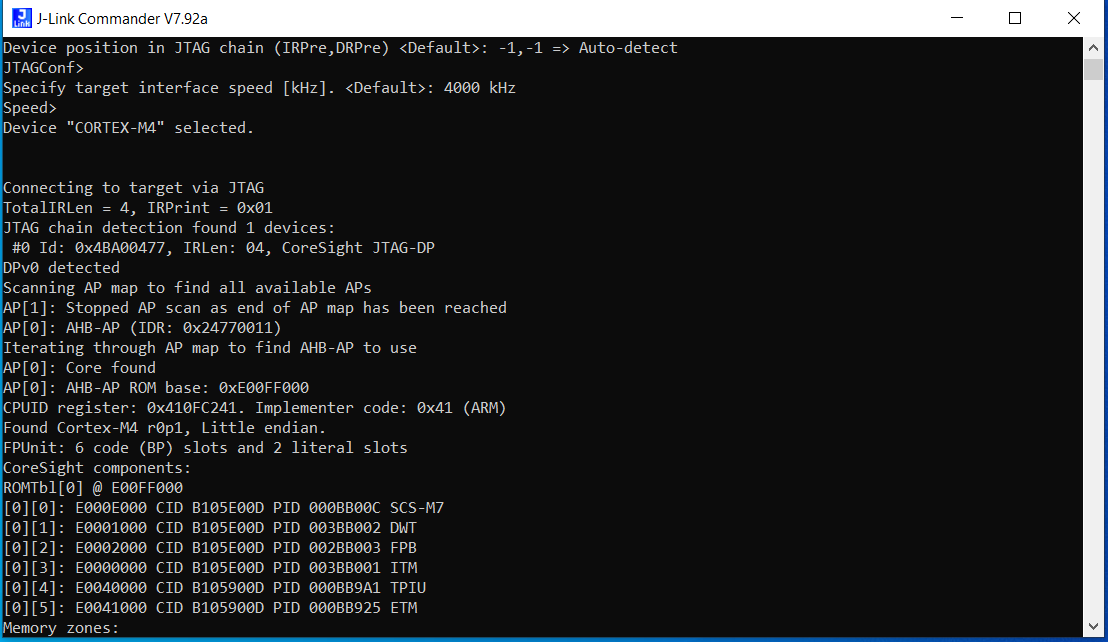
Connect your J-Link probe to the target microcontroller and to your PC via USB. Open J-Link Commander app and enter then we will see below prompt for connecting.
3. Connect to the Target Device#
Enter connect command to establish connection with target device. Once after establishing the connection it prompts you to select device
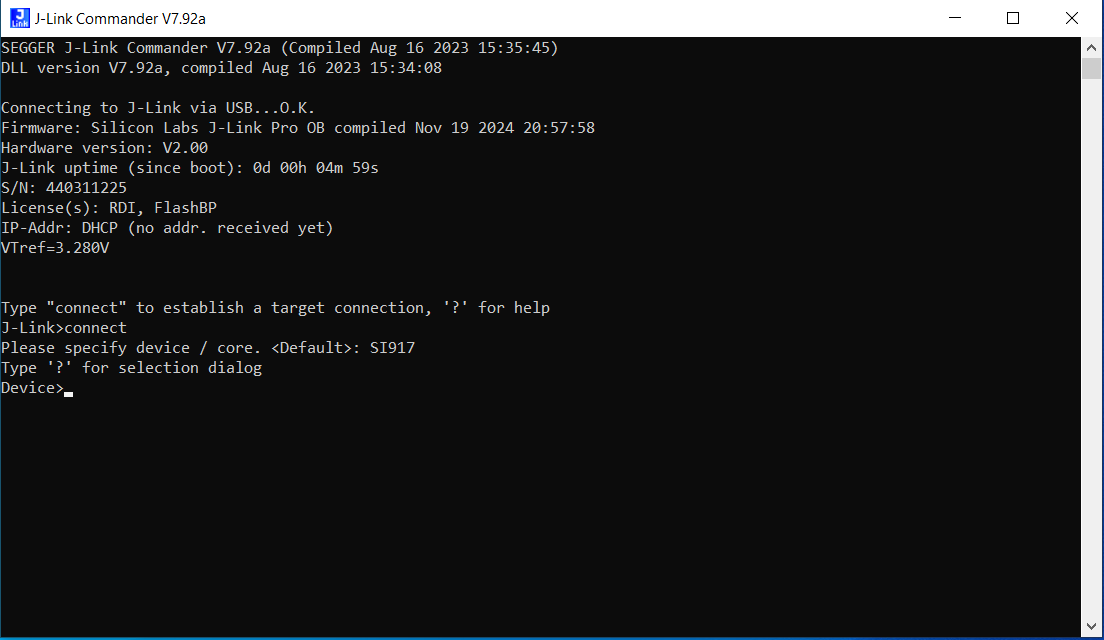
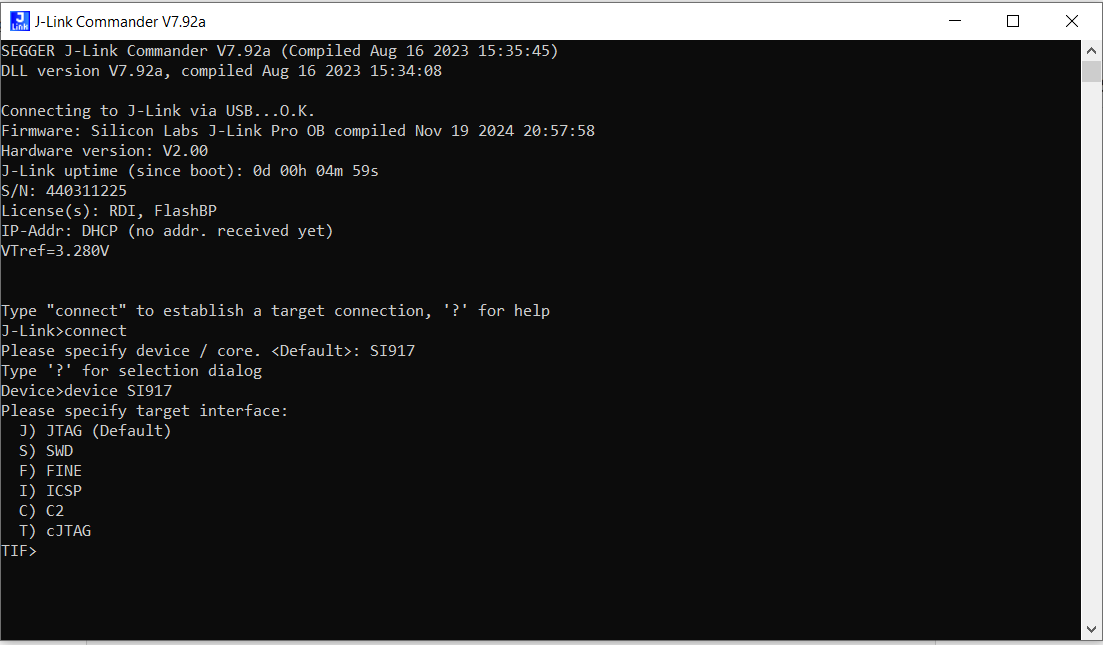
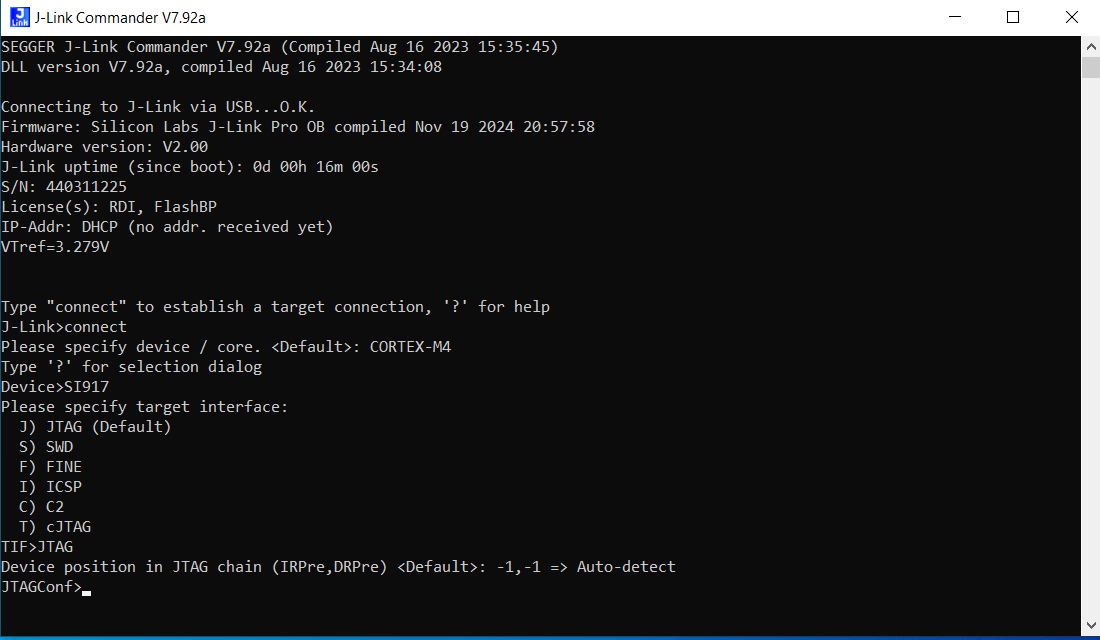
Specify the target device and interface by typing the following command, by default it is SI917, if we require other device/core we need to enter "device < NAME >" in commander
4. Monitor CPU current states#
Use the halt command to stop the CPU and inspect its current state.
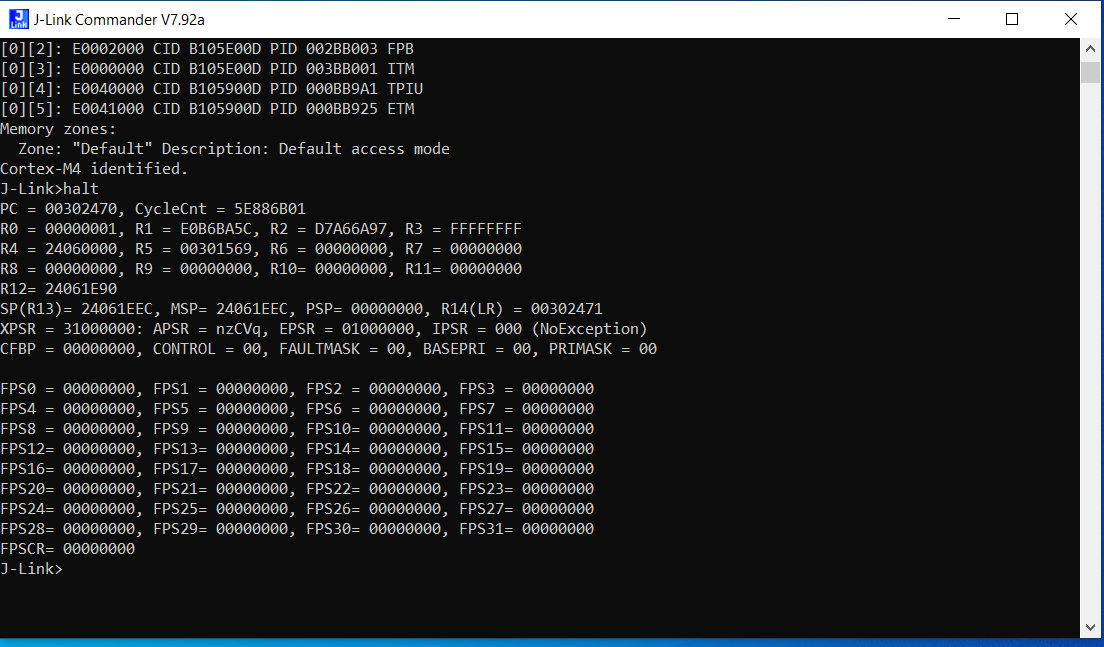
Use the regs command to view CPU registers, including control registers for power management.
Use the mem command to inspect specific memory locations, such as power configuration registers or peripheral states.
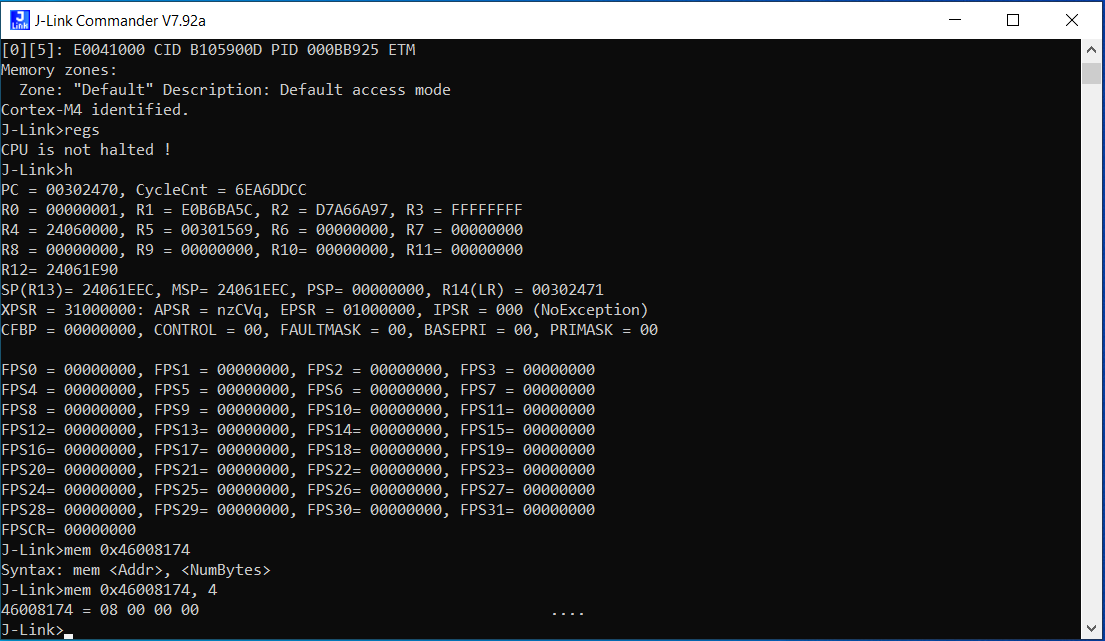
By utilizing commands such as step, which executes a single instruction, and go, which resumes CPU execution, we can proceed with debugging.
When device halts after wake up and doesn't proceed further please investigate below memory/reg locations through mem32 command through J-Link Commander
mem32 0x46008174 1
BIT 0 ----- M4_WAKEUP_TA This bit is used to wake up NWP from sleep.
BIT 1 ----- M4_is_active This bit is used to indicate NWP that MCU is active
BIT 2 ----- TA_wakeup_M4 This bit is used to indicate MCU that it should wakeup from sleep (read only)
BIT 3 ----- TA_IS_ACTIVE This bit is used to indicate MCU that NWP is active (read only)mem32 0x46008170 1
BIT 1 ------ RX_BUFFER_VALID This bit indicates TA that M4 is ready to accept incoming packets
BIT 3 ------ M4_USING_FLASH This bit indicates TA that M4 is using Flash and not off the Flash in common flash modeOzone Debugger#
Ozone Debugger is a powerful, full-featured debugging tool developed by SEGGER for use with J-Link debug probes. It is designed to help developers debug, analyze, and optimize embedded applications efficiently. Ozone supports a wide range of microcontroller architectures, including ARM Cortex-M, Cortex-A, RISC-V, and more.
Ozone Setup for SiWx917 SoC Debugging#
To debug the SiWx917 SoC using the Ozone IDE, follow these steps:
Manual Configuration#
Install Ozone
Download sl_si917.jdebug and SiWx917.svd files.
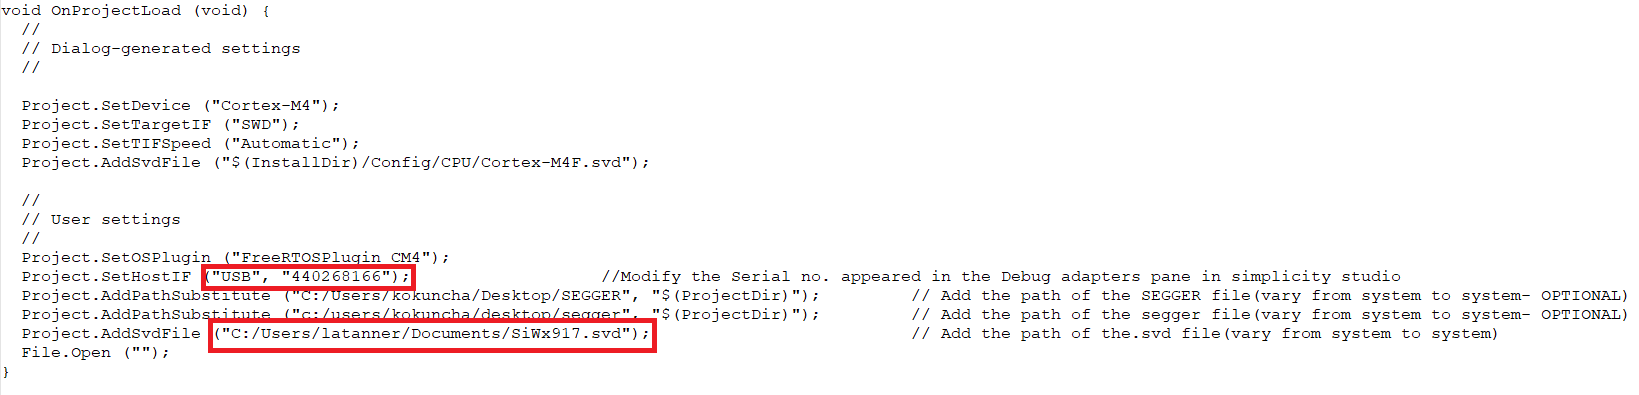
Ensure the neccessary adjustments to the "sl_si917.jdebug" file should be made as outlined below:
Update the path for the SiWx917.svd file and also the Serial no of the device which will appear in the DEVICES tab in Simplicity Studio.
Before starting the debugging process, flash the both TA firmware and the Application binary which you intend to debug onto the SiWx917 SoC using Simplicity Commander.
Note: Check the following procedure for flashing TA and Application binary.
Steps to Configure the SiWx917 SoC on the Ozone Debugger#
Launch Ozone.
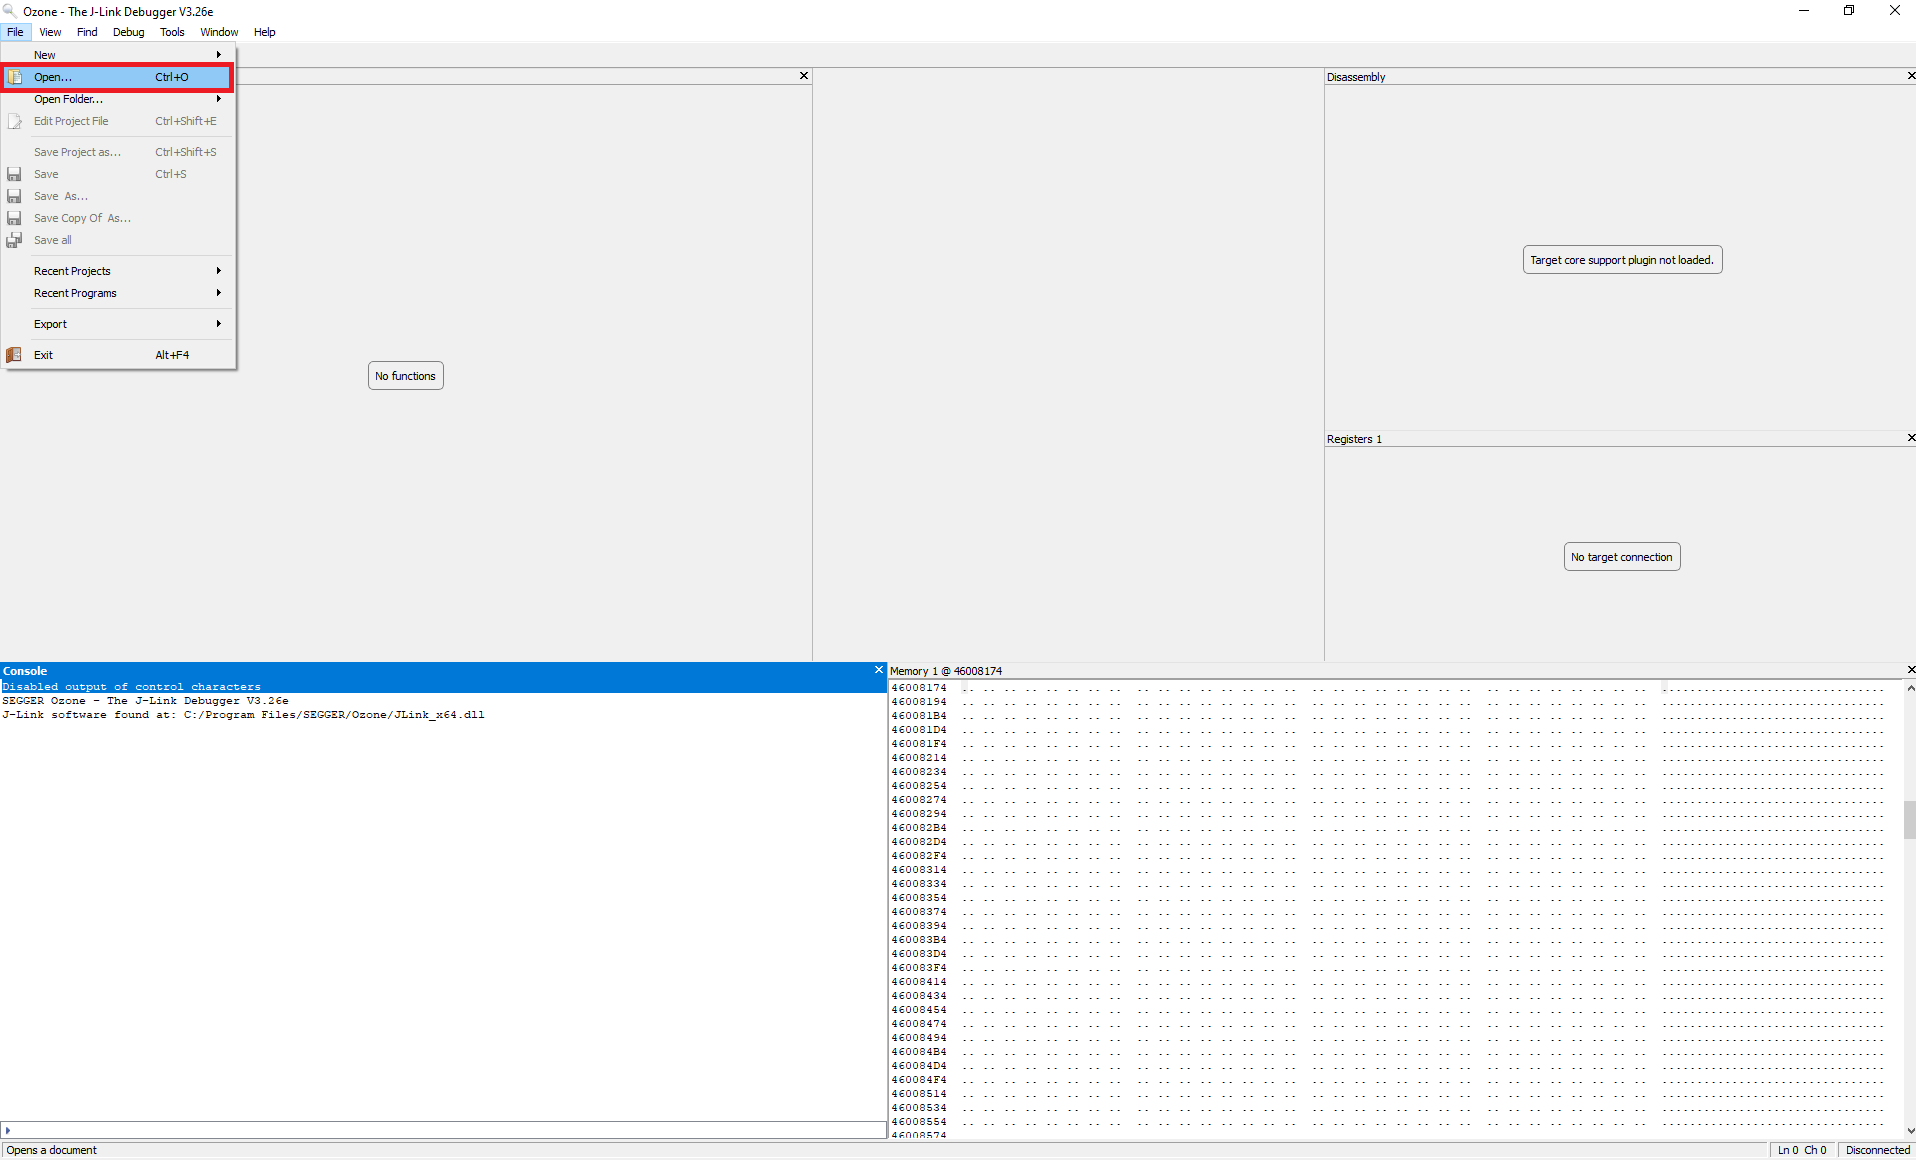
Open the sl_si917.jdebug file from the File tab.
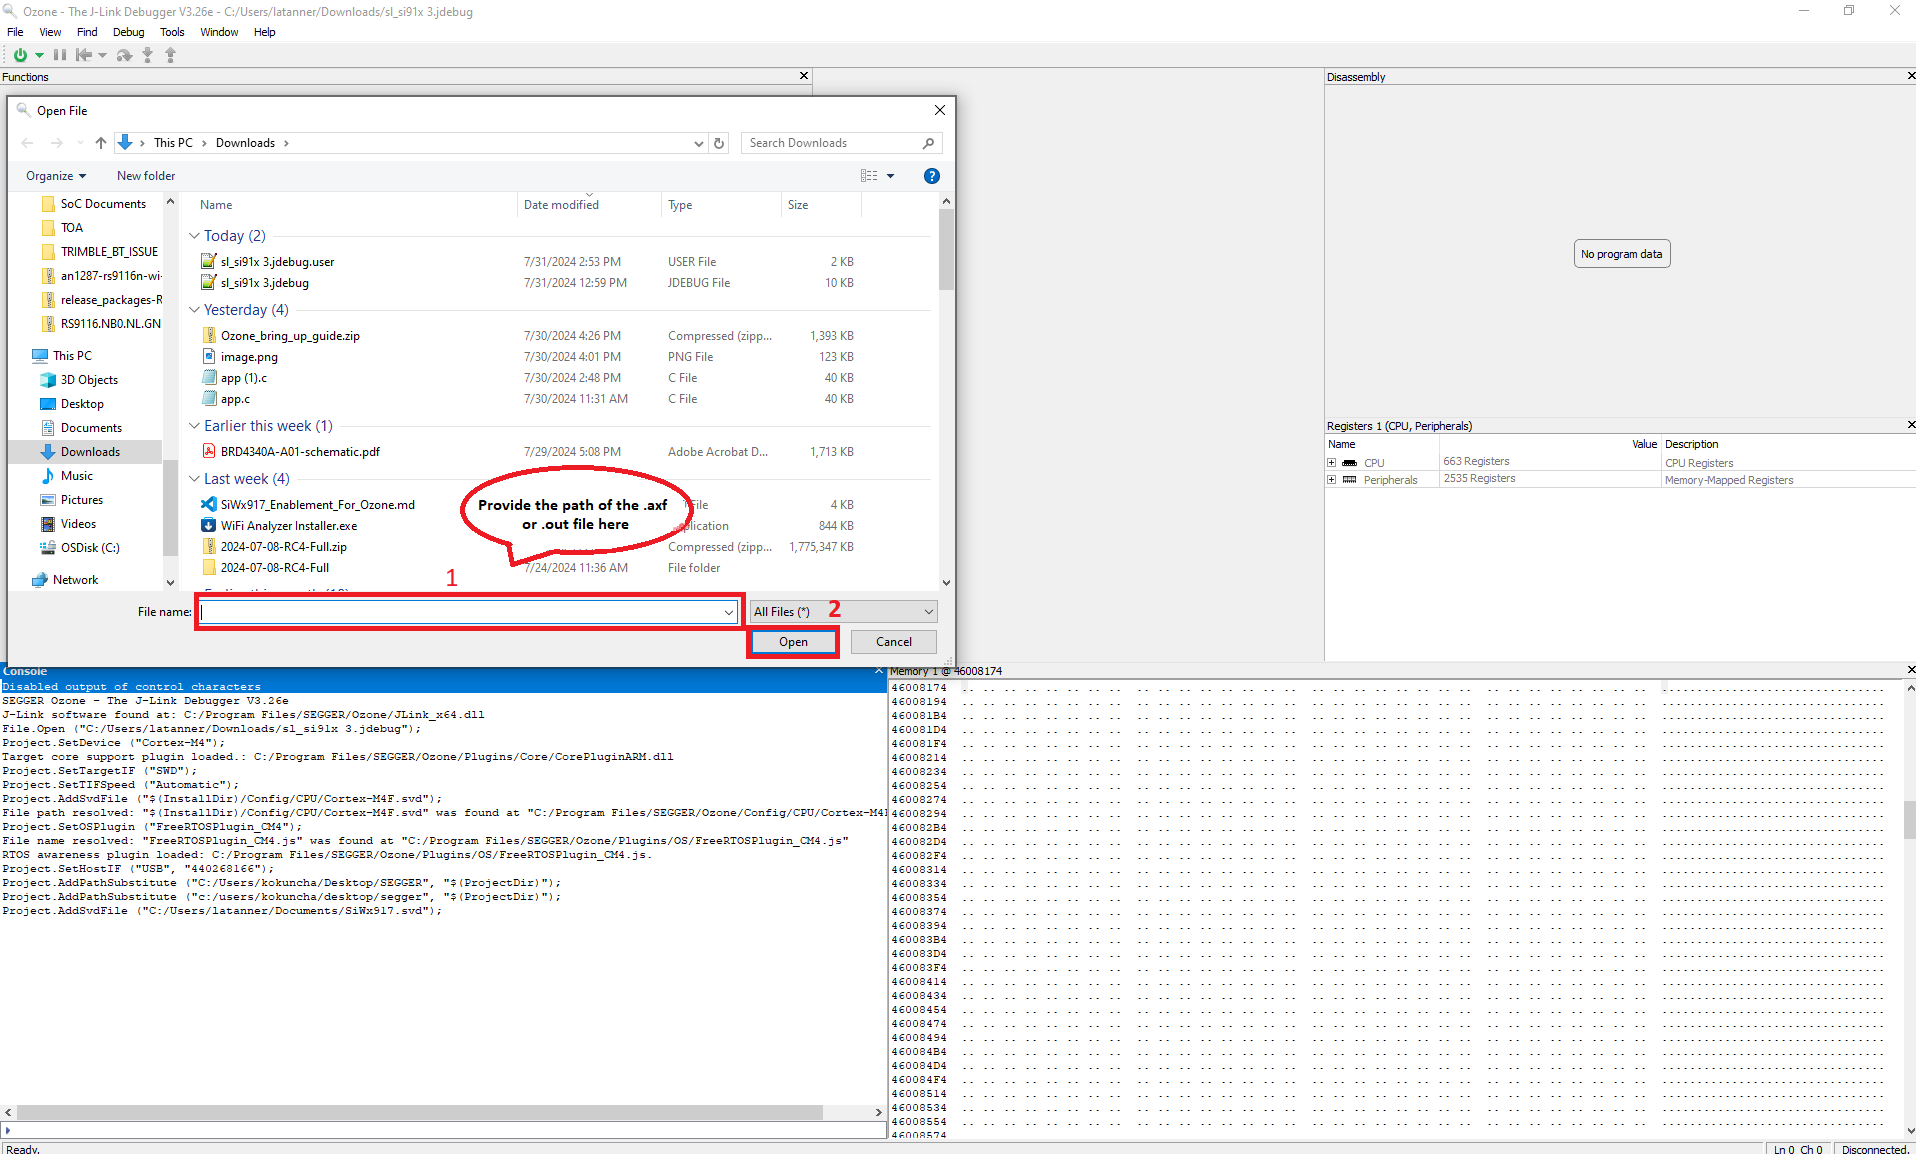
A window prompts you to open either the .axf or .out file for debugging the SiWx917 SoC example.
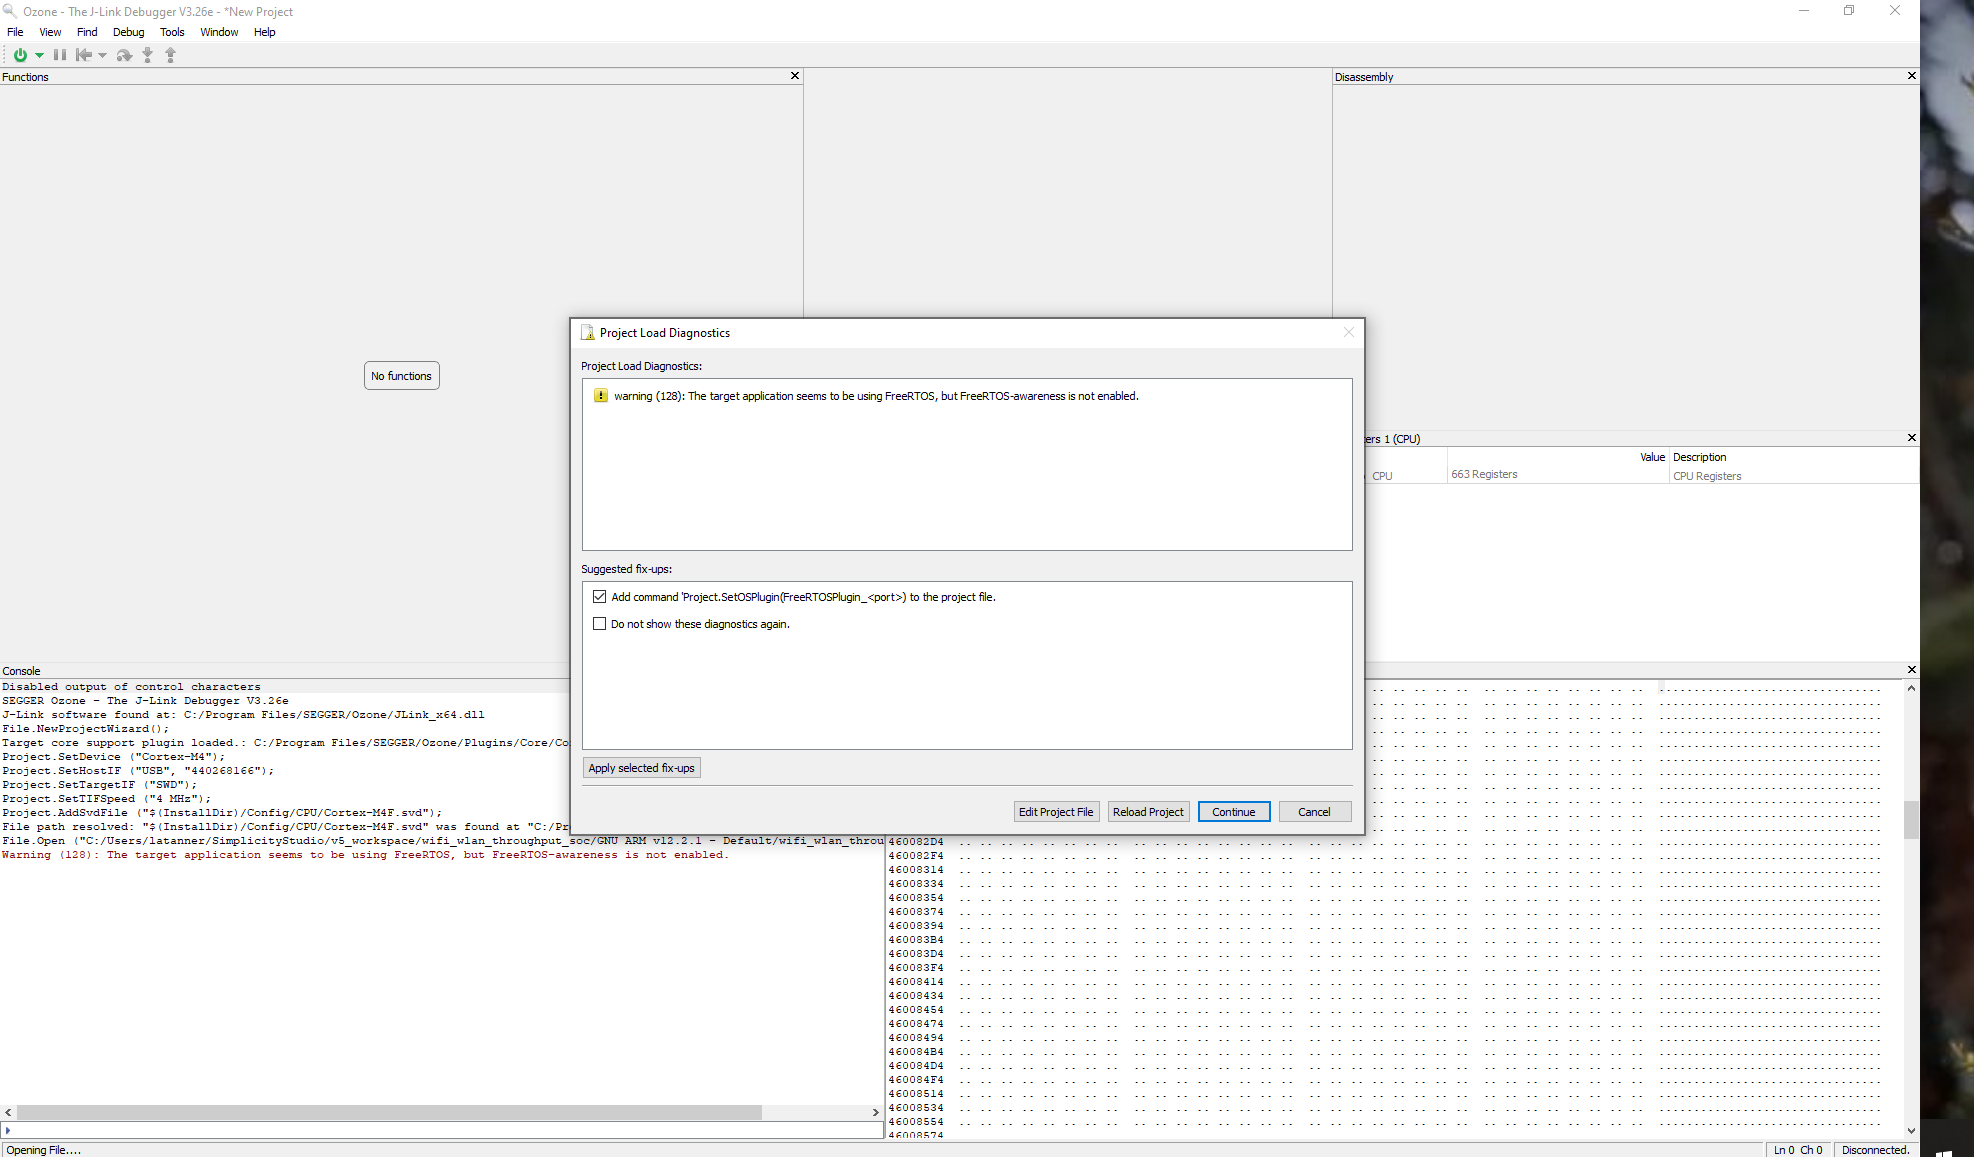
If any Diagnostics Warning may be displayed about FreeRTOS being detected. Click Continue.
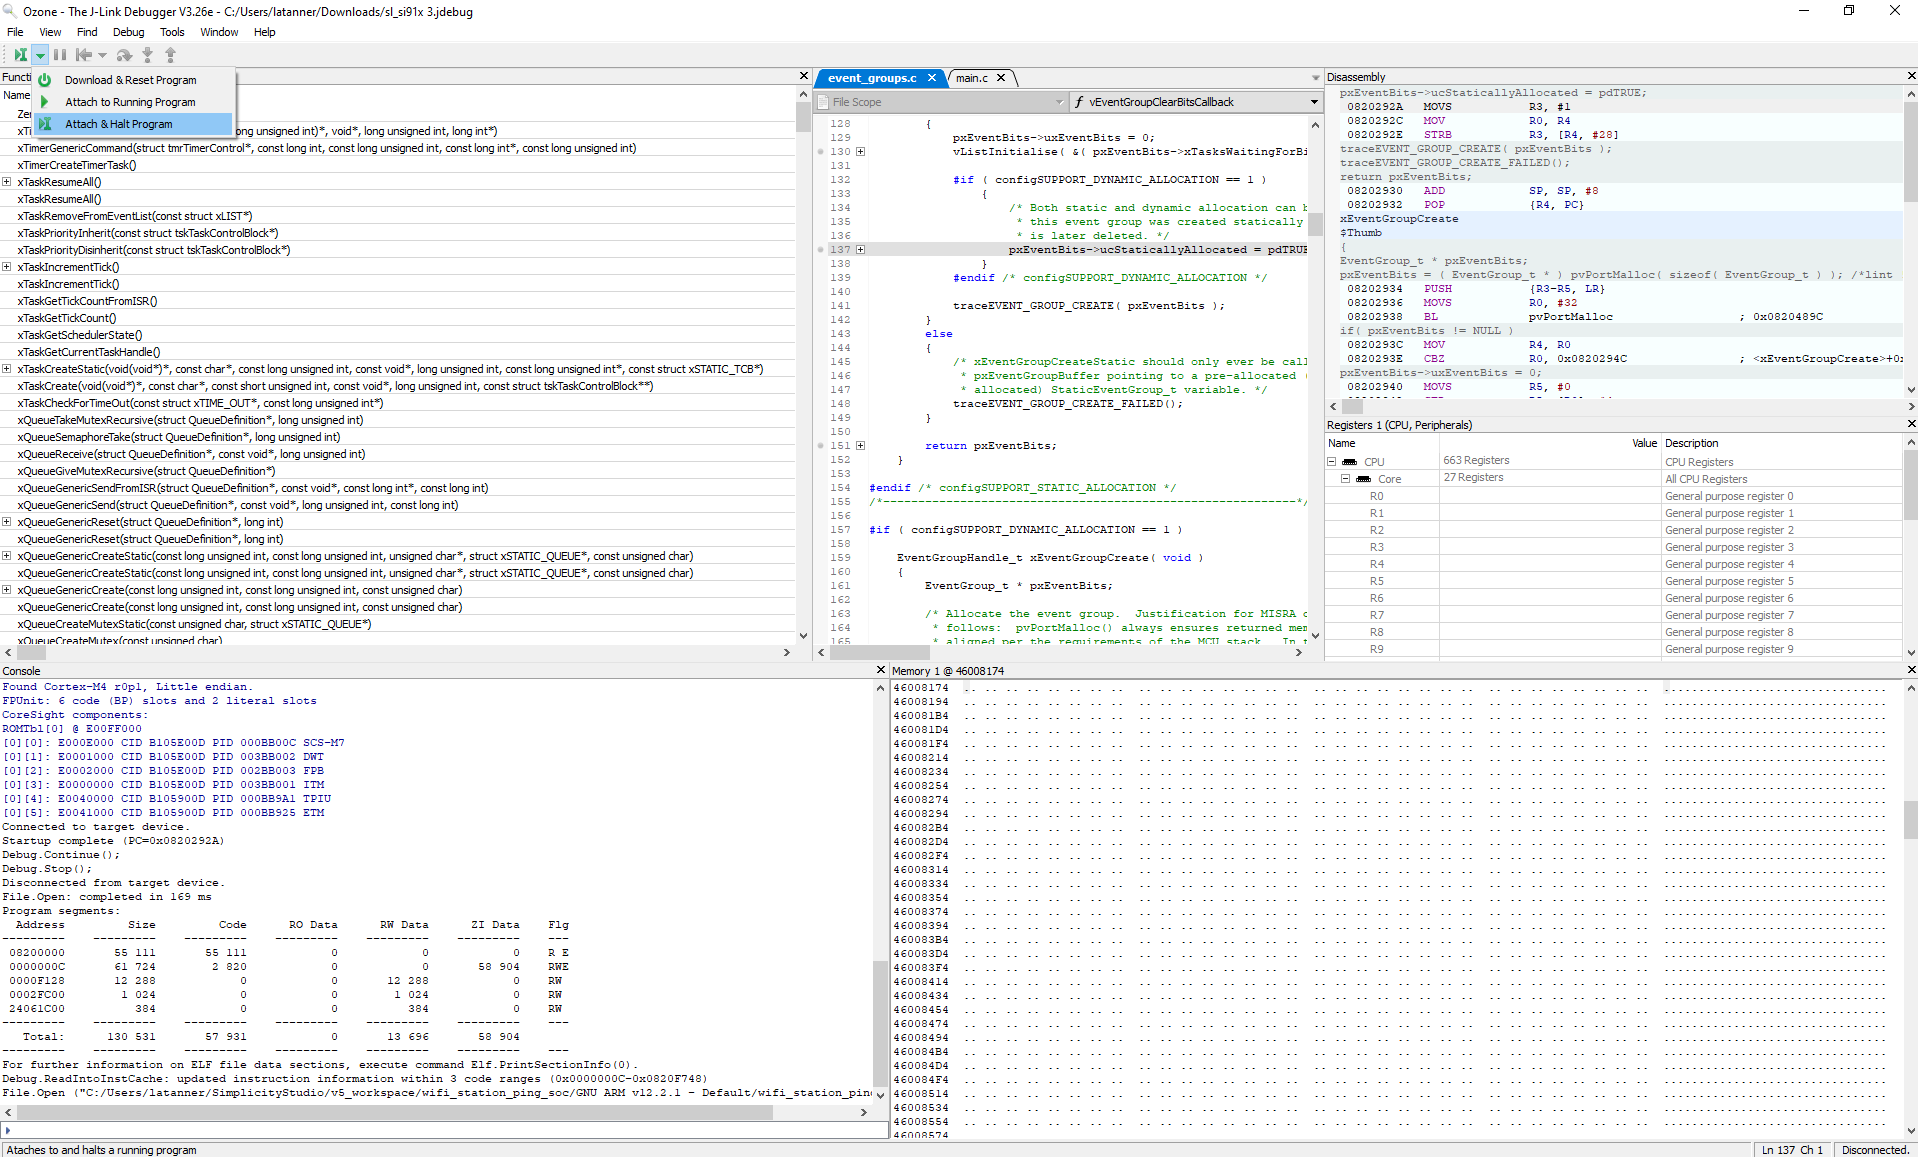
Select Attach & Halt program in the dropdown next to the Power button on the top-left hand corner of the page.
Click Reset & Break at symbol next to the Play/Pause button on the top-left hand corner of the page.
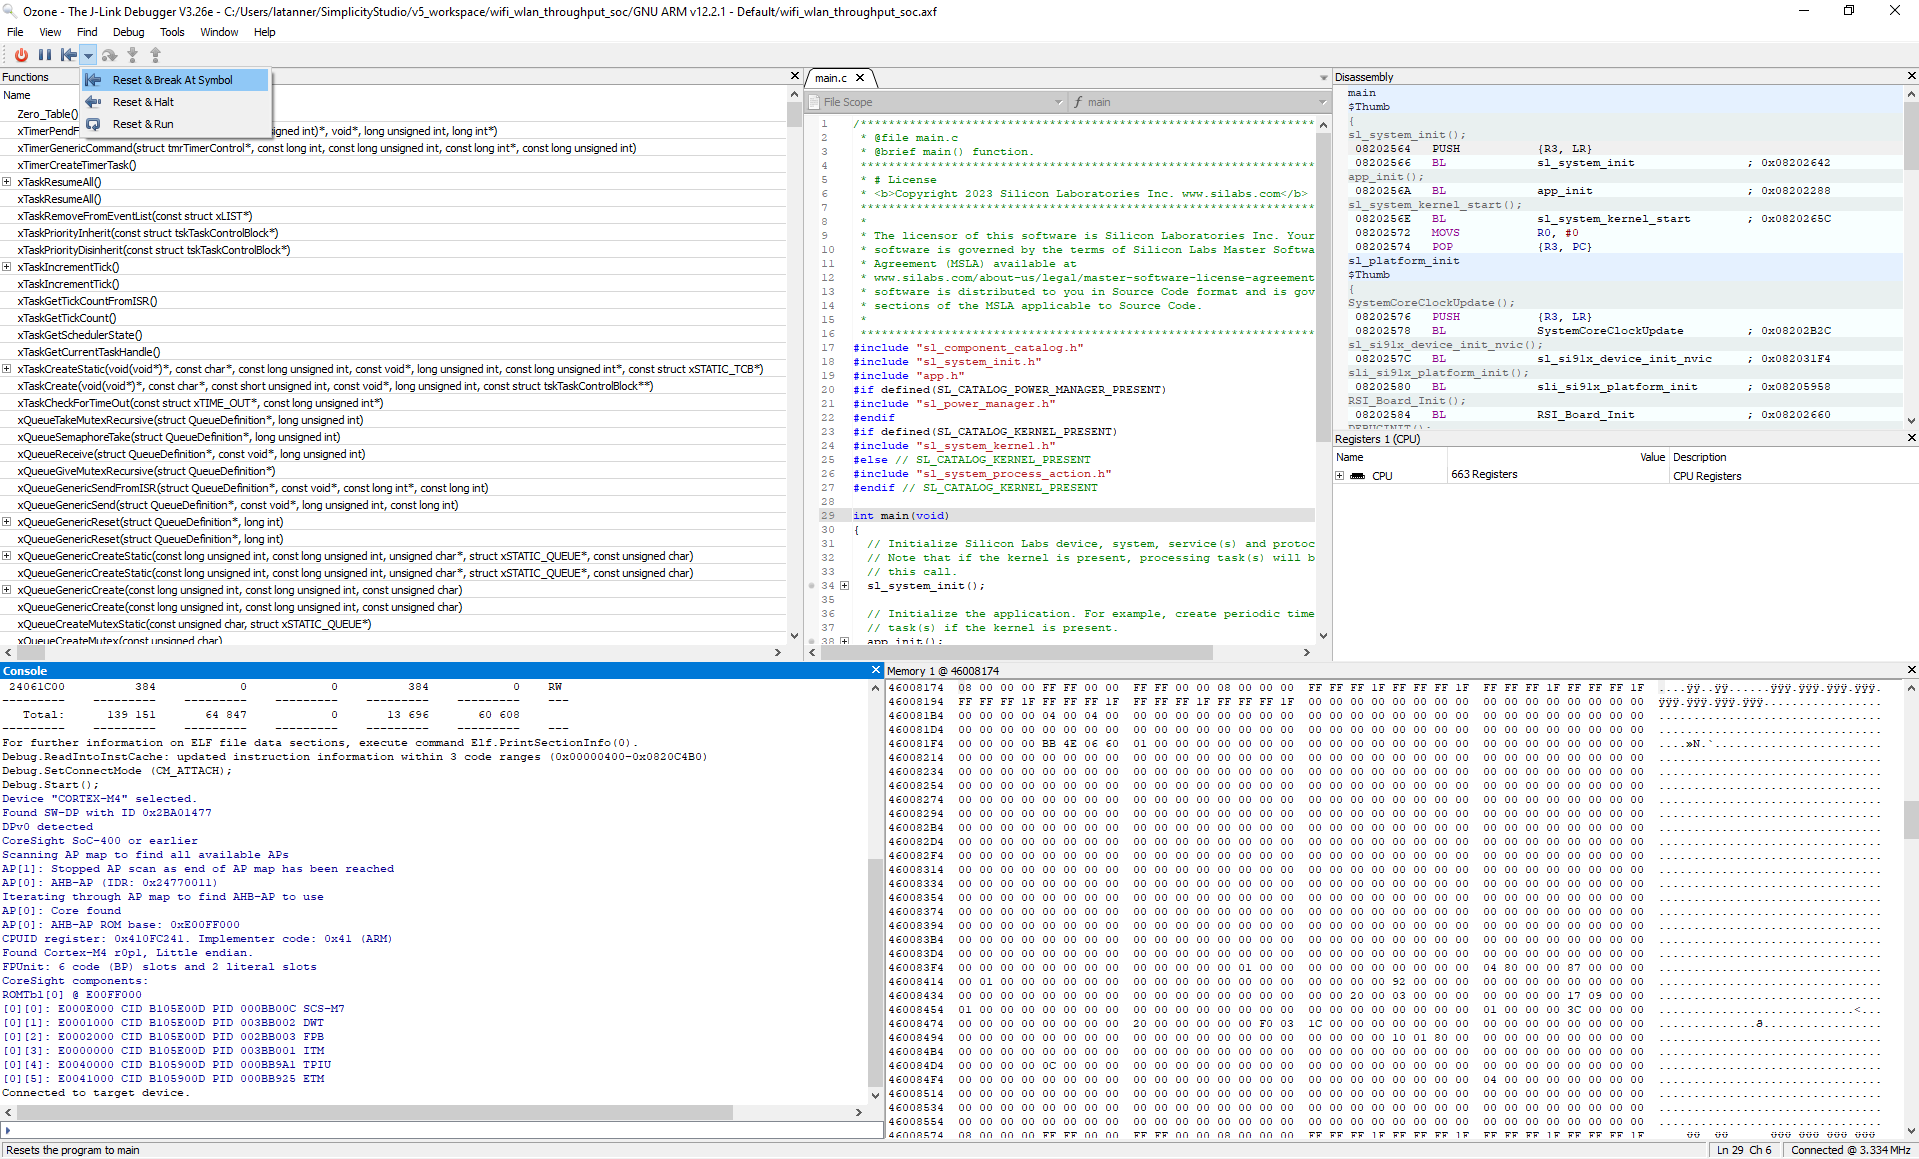
Note: This resets the MCU.
Run the image by clicking the Resume/Halt button on the top-left hand corner of the page.
Troubleshooting#
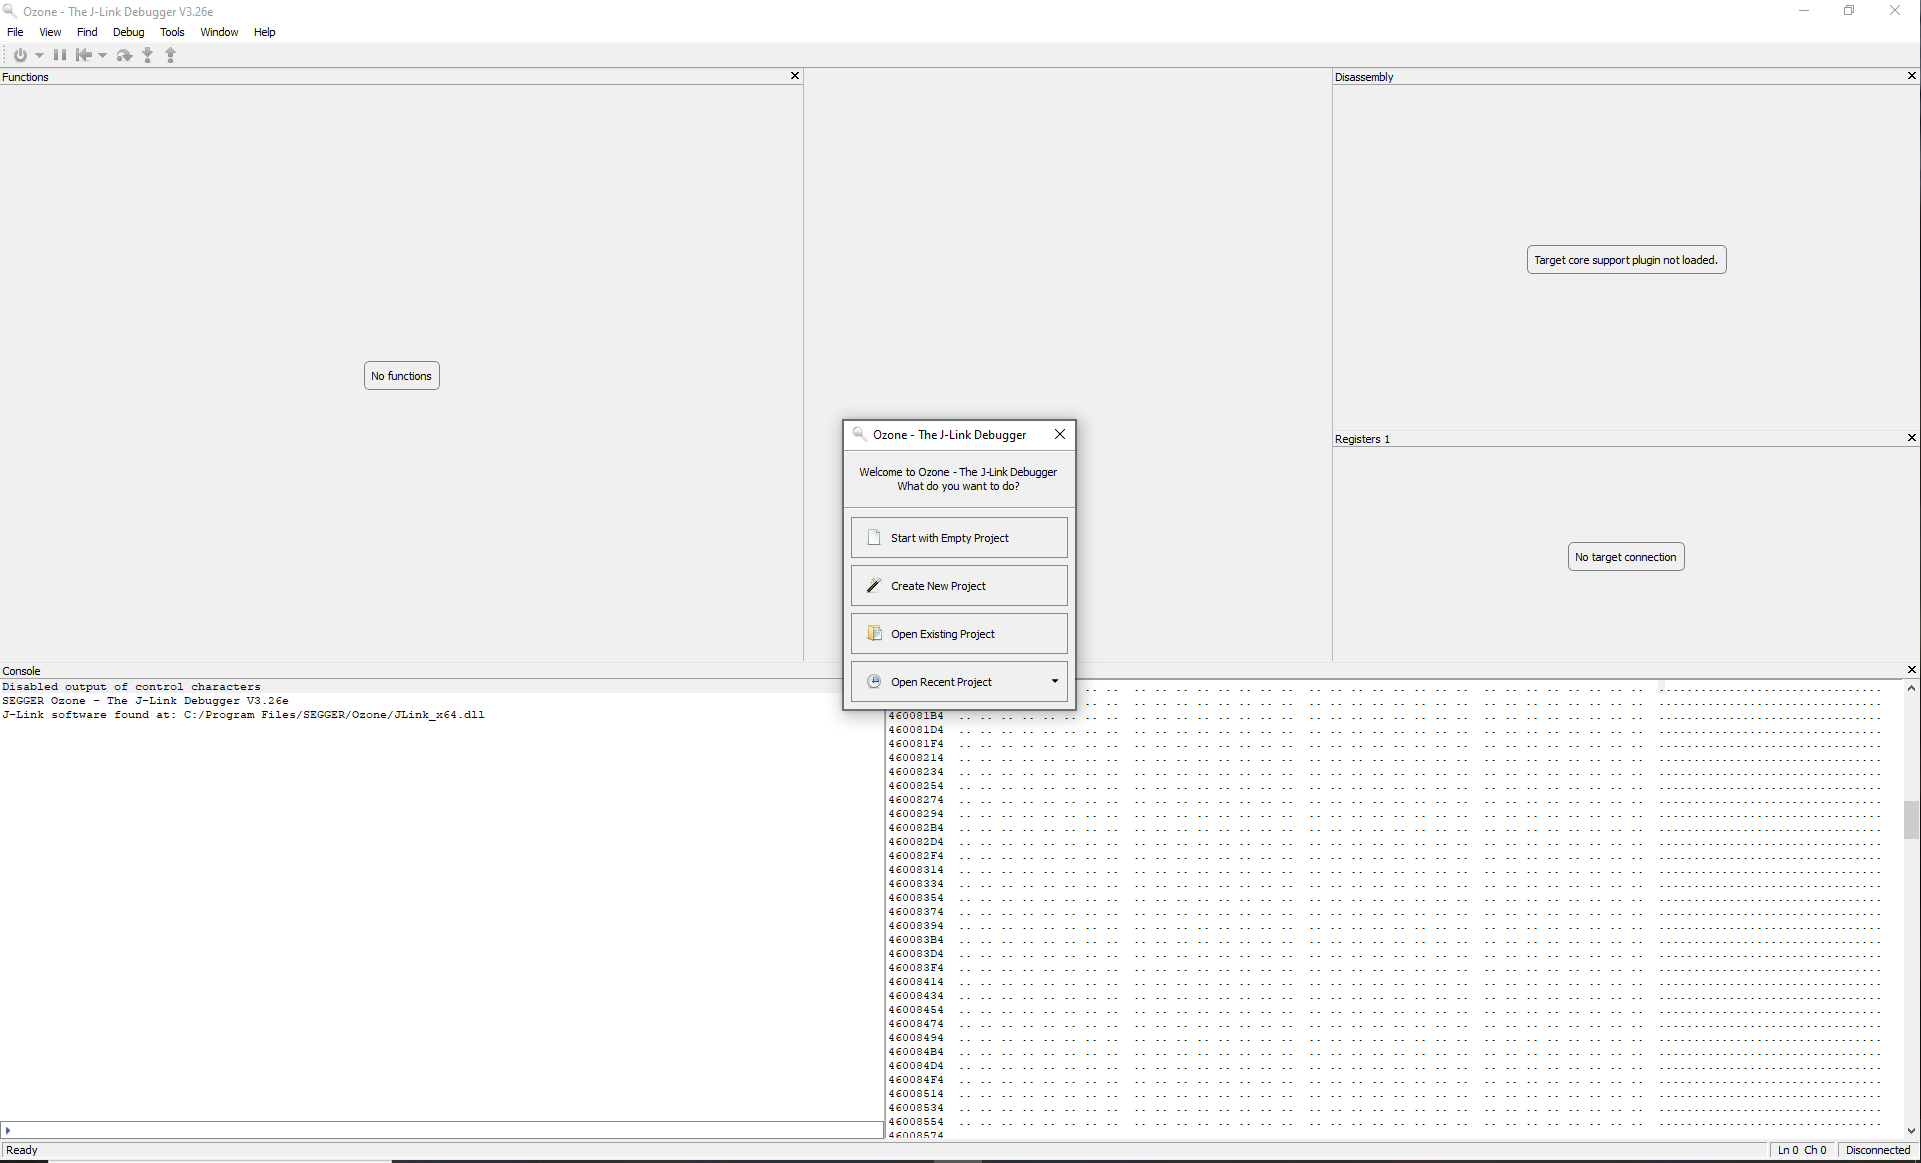
Ignore the following window while reopening the Ozone Application and follow from step 2 to check for the SiWG917 debugging.
ETM Debugging on SiWx917#
Overview#
The Embedded Trace Macrocell (ETM) is a specialized hardware block in some ARM processors. It's designed to assist in debugging and performance analysis of software running on the processor. The Embedded Trace Macrocell (ETM) is a valuable tool for software developers working with ARM processors. An Embedded Trace Macrocell(ETM) is a real-time trace module providing instruction execution flow and data access patterns, for debugging and optimization. The operating frequency of the ETM in SiWx917 is greater than or equal to 40 MHz. It is configured to operate at 120 MHz by default. The following page basically give an overview about ETM, and how to use it for debugging.
Functionality#
The primary function of the ETM is to capture trace information about the program's execution as it runs on the processor. This trace information includes details about the instructions executed, the order in which they were executed, and sometimes additional data such as memory accesses and events.
Features#
Instruction Trace: The ETM captures a trace of the instructions executed by the processor. This allows developers to reconstruct the program's execution path.
Branch Trace: It provides information about branches and other control flow changes in the program. This helps to understand the program behavior and optimize its performance.
Timestamps: Some ETM implementations include timestamp information, which helps correlate events with specific points in time during program execution.
Data Trace (Optional): In some configurations, the ETM also captures data accesses, providing insight into memory reads and writes during execution.
Debugging Support: ETM greatly aids in post-mortem debugging. When a program crashes or exhibits unexpected behavior, the trace data can be invaluable for understanding what led to the issue.
Hardware Requirements#
A Windows PC
Silicon Labs SiWx917 PK6030A SoC Kit which includes
BRD4001A/BRD4002A Wireless Starter Kit Mainboard
SiWx917 Radio Board Radio Board
Segger J-Trace Pro
Software Requirements#
Simplicity Studio 6.2.0
To download and install the Simplicity Studio IDE, refer to the Simplicity Studio IDE Set up section in Getting started with SiWx91x SoC guide.
SiWx917_WiSeConnect_SDK.x.x.x.x
Ozone Debugger and performance analyzer Download here.
Configuration and Execution of the Application#
The application can be configured to suit your requirements and development environment.
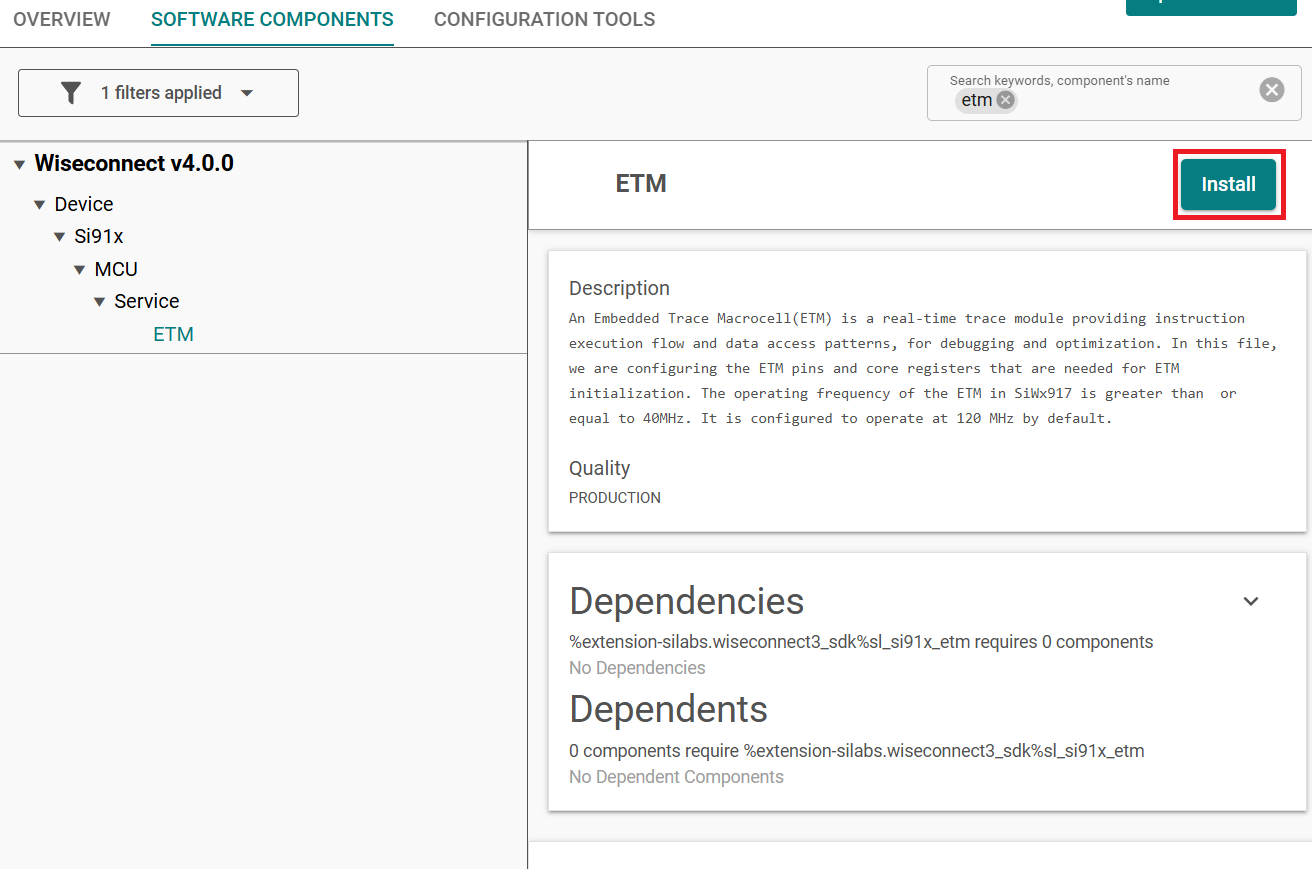
First, add the ETM component on the respective project. Open the .slcp file. Under software component search ETM.
Install the ETM component.
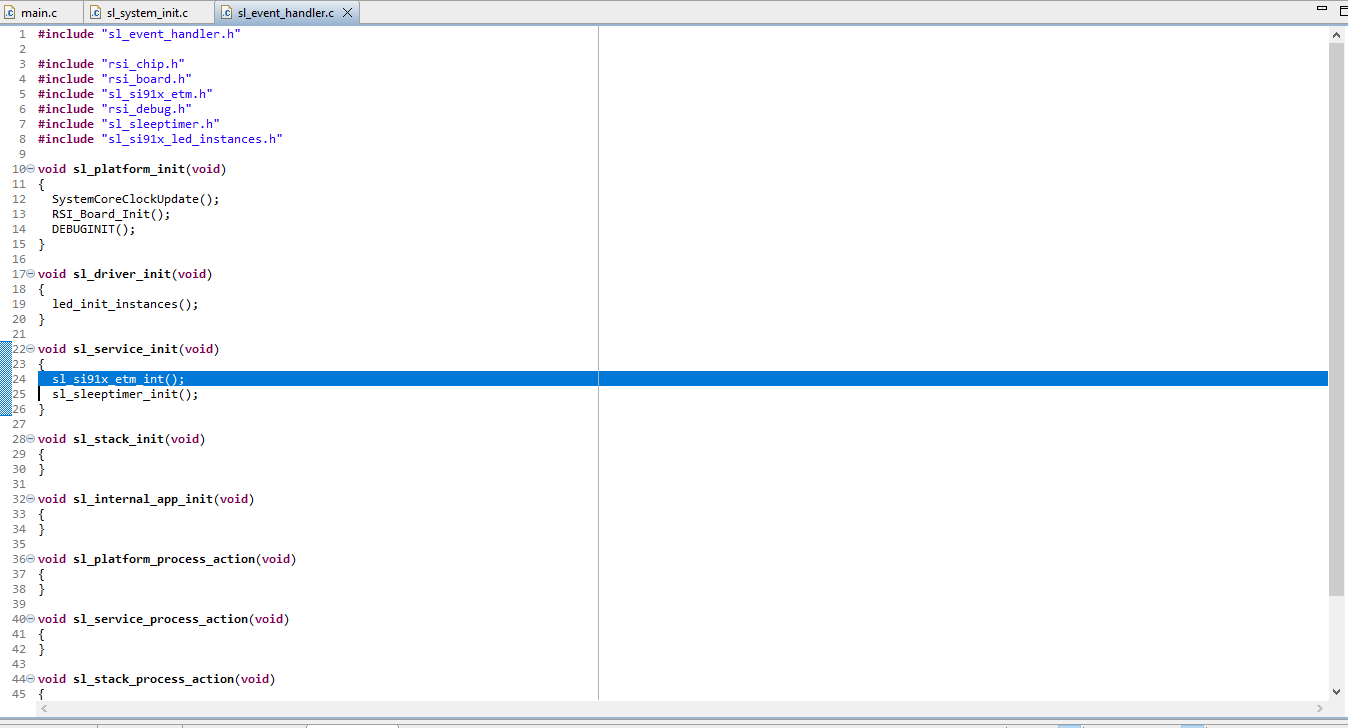
After installing the ETM component you will be able to see ETM initialization function under sl_service_init().
Build your application. For connecting the Ozone Debugger we need the .out file which is automatically generated upon building the application on simplicity studio.
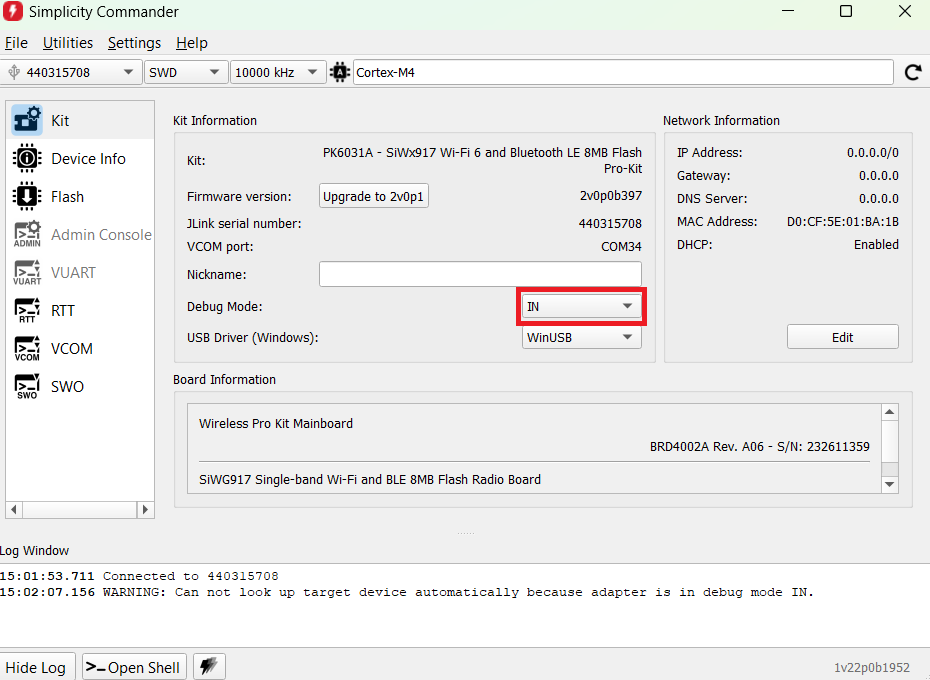
Make your board on "IN" mode.
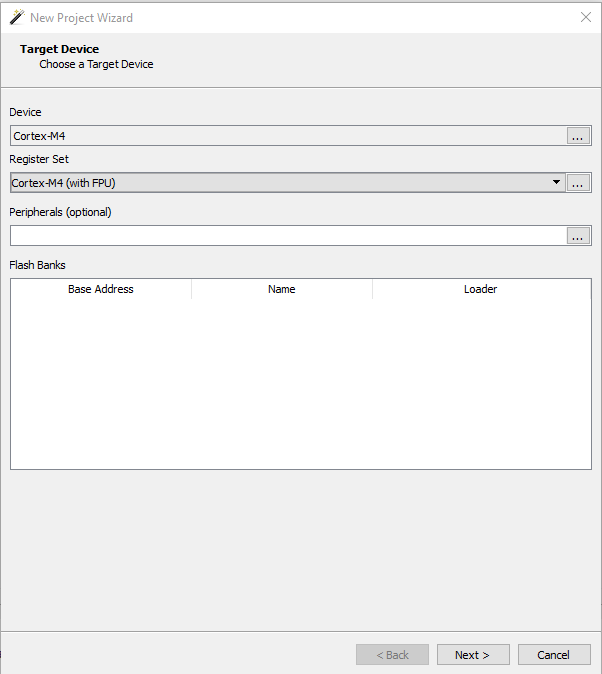
Open Ozone and you will see the following window. Click on Next.
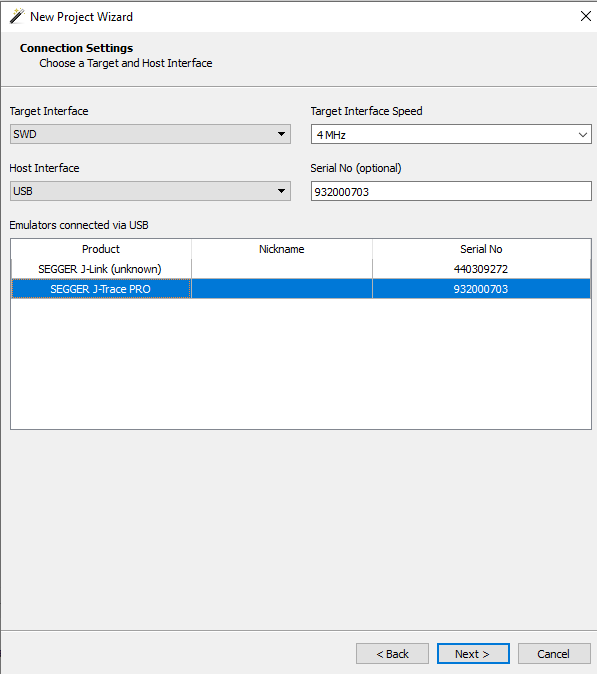
Choose your J-Trace PRO Cortex. Click on next.
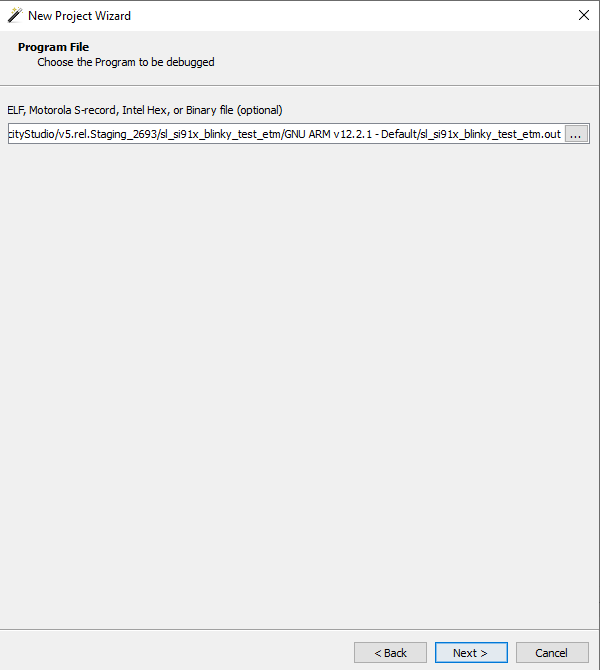
Give the path of your .out file which is generated upon building the application.
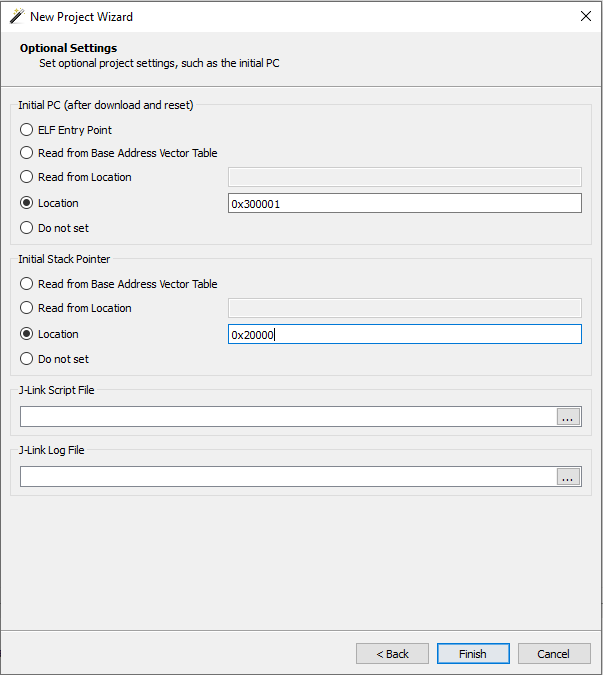
Add the location of PC as 0x300001 and Stack pointer as 0x20000
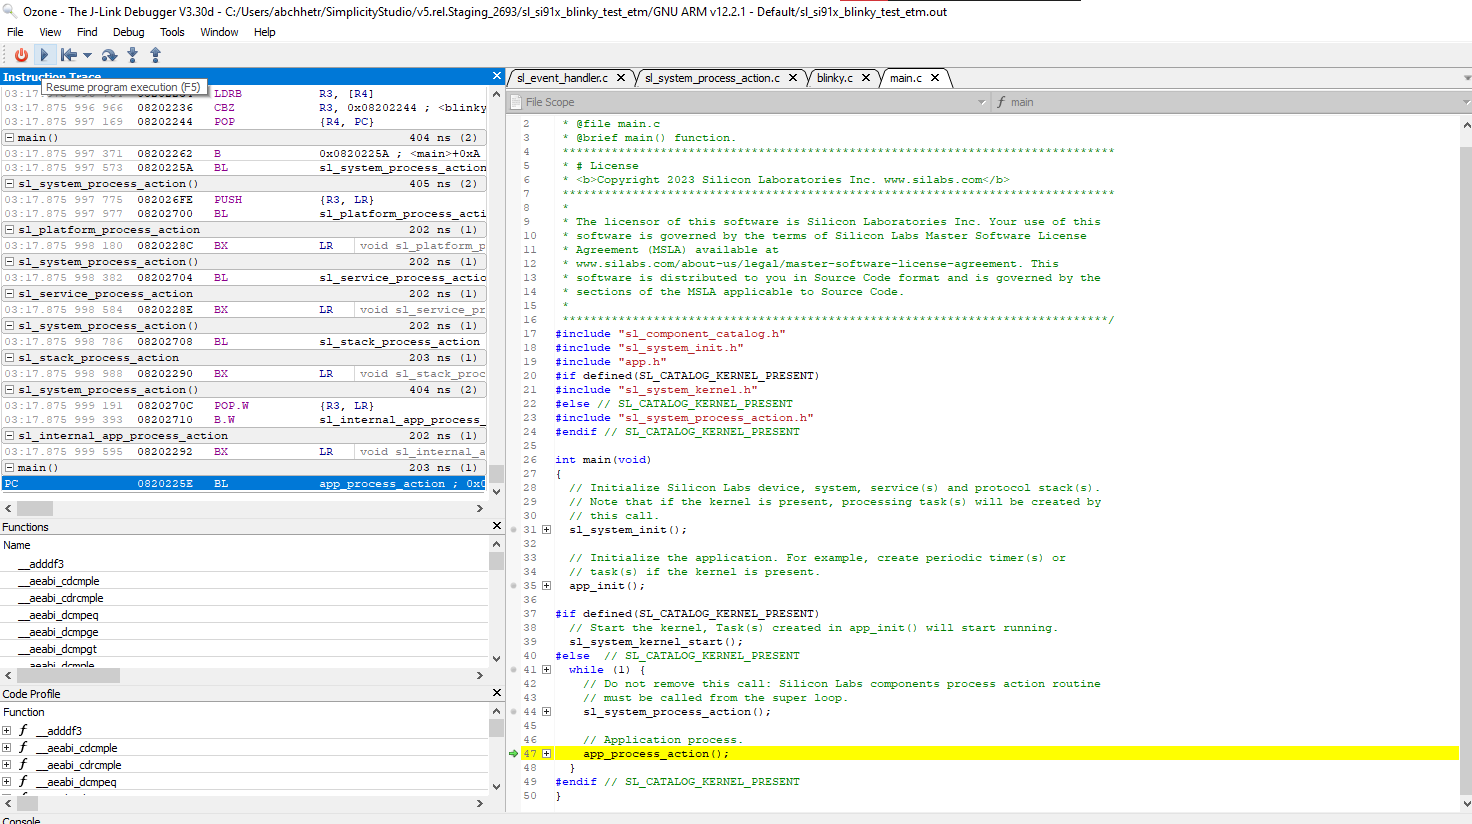
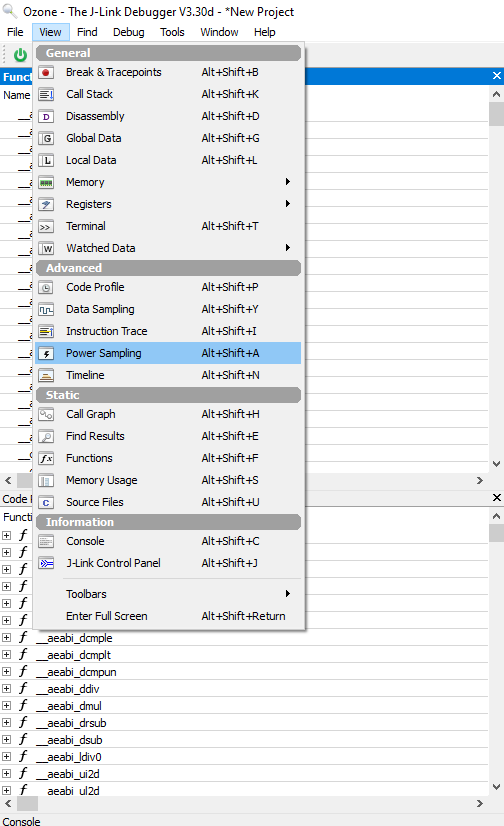
Now, click on View window and open the "Instruction Trace" window.
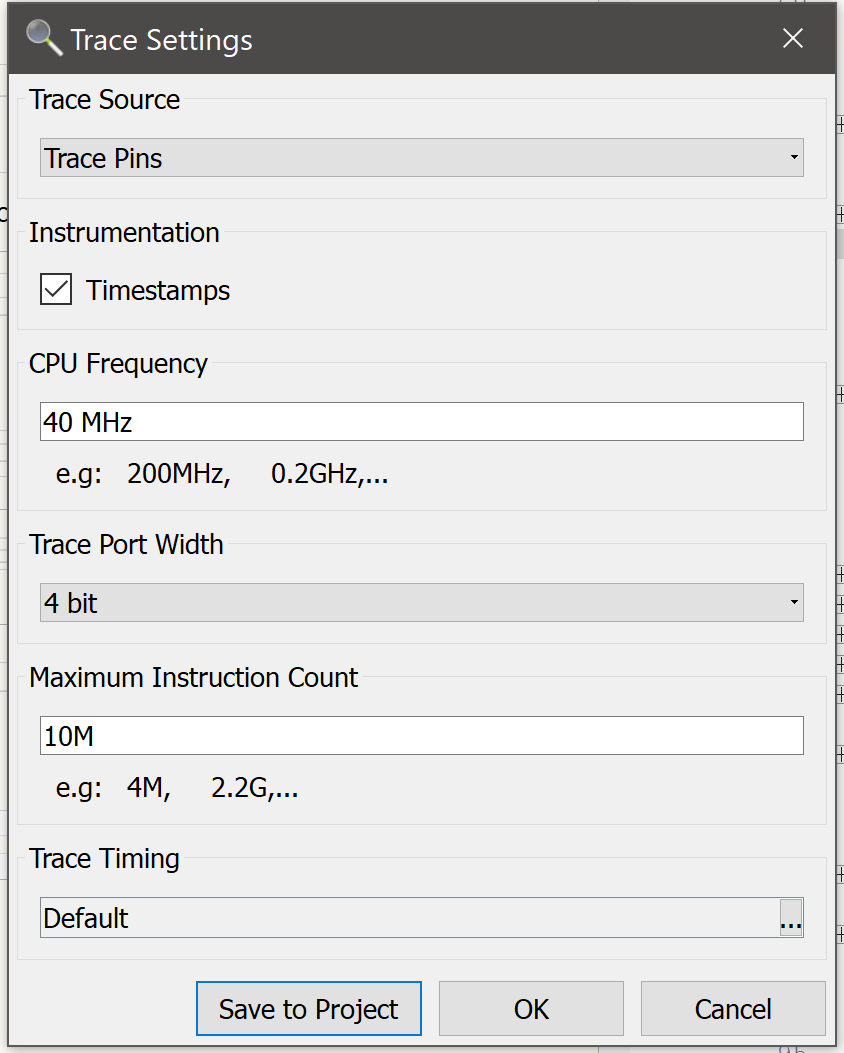
Now open the Trace Settings and add the following configuration as shown in the figure.
Now click on "Attach & Halt Program" option.
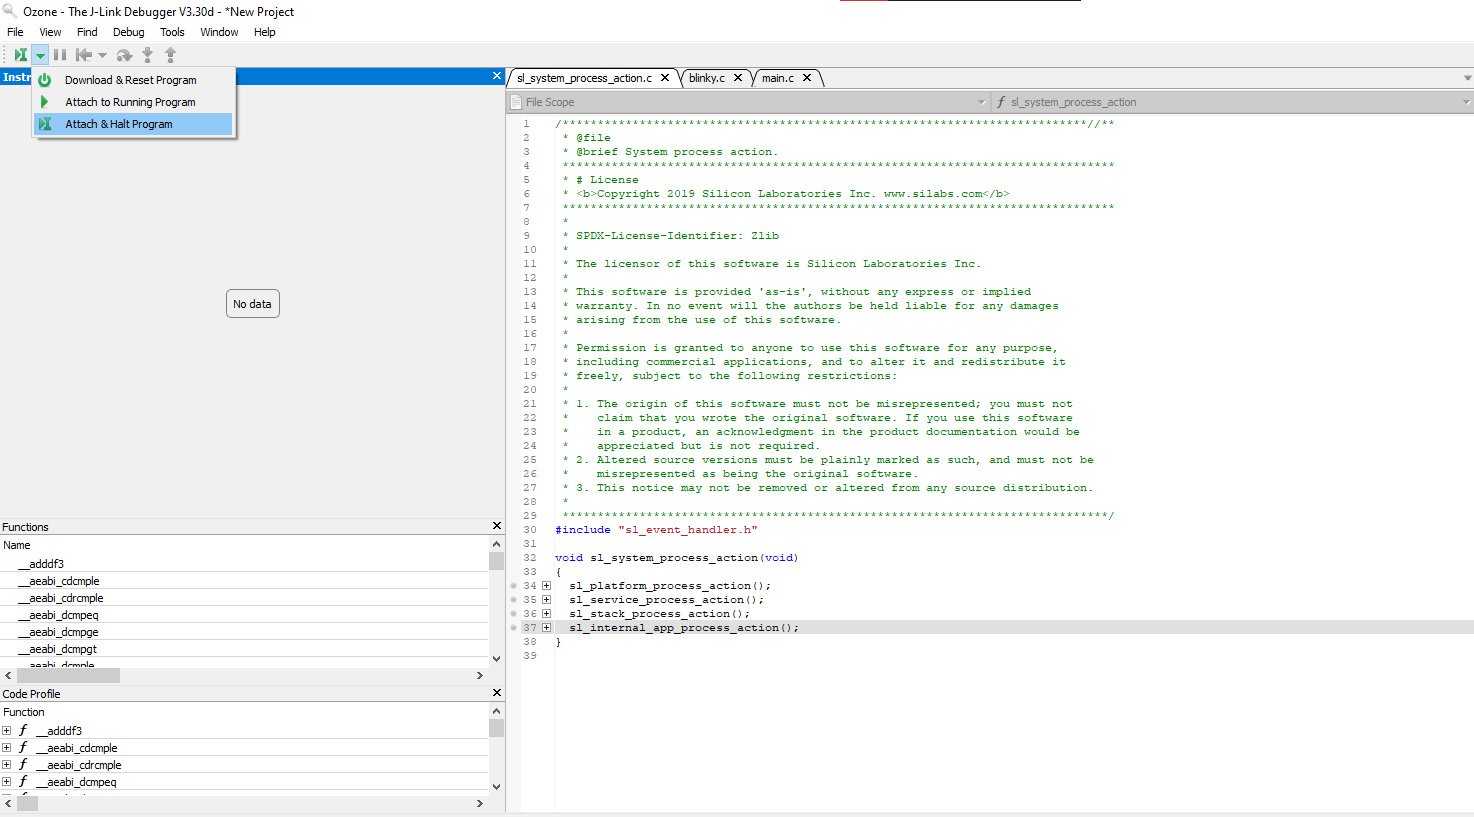
Now click on Play button. You will be able to see Instruction Trace as shown below.