Capture and Analysis of Z/IP Traffic#
This lab exercise explores how to capture and analyze Z/IP frames over IP using the Wireshark tool This exercise is the fourth exercise in the ‘Z-Wave Controller Training Course’ series. In it, you will learn how to do the following:
Install Wireshark
Capture traffic
Filter traffic
Decrypt traffic
Parse Z/IP Frames
Introduction#
This exercise demonstrates how to capture traffic on the IP interface decrypt the traffic and parse the payload.
Hardware Requirements#
2 UZB Controllers
1 Raspberry 3B (+)
1 SD card
1 IP Router with built in DHCP
1 WSTK Main Development Board
1 Z-Wave Radio Development Board: ZGM130S SiP Module
1 USB Zniffer
Software Requirements#
VNC and optionally SSH client https://www.realvnc.com/en/connect/download/viewer/ https://www.chiark.greenend.org.uk/~sgtatham/putty/latest.html
Simplicity Studio v4
Z-Wave 7 SDK
Z-Wave PC Controller
Z-Wave Zniffer
Prerequisites#
Familiarize yourself with the protocol by referring to the following items:
https://www.silabs.com/support/training/z-wave-700-series
Videos 1-3 and
exercise 6,7 and 10 will be relevant.
Further, the participants should have completed
Controller training session 1
Controller training lab exercise 1
Controller training session 2
Controller training lab exercise 2
Controller training session 3
Controller training lab exercise 3
Controller training session 4
Participants should be familiar with connecting to the Raspberry Pi.
Installing Wireshark for Packet Capture#
$ sudo apt install wireshark
Enable non-root users to capture packets when prompted. By default, not all users are allowed to capture traffic, so the current user needs to be added to the Wireshark group:
$ sudo usermod -a -G wireshark $USER
Next, log out of the Raspberry Pi from the start menu and log in again to activate the changes made to user groups.
Capture First Packets#
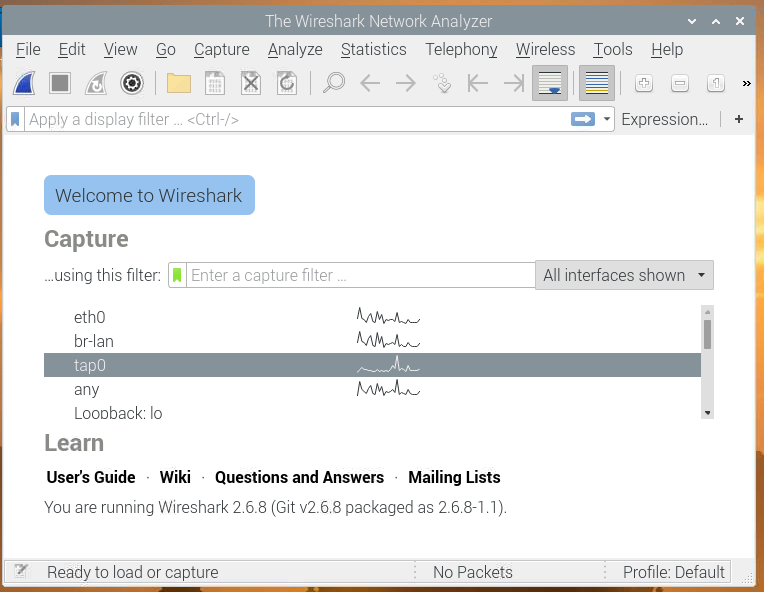
From the Raspberry Pi start menu, select “Internet” and “Wireshark”. On the initial screen, double click the “tap0” interface to start capturing traffic:
As the tap interface is bridged through br-lan to the Ethernet interface, a lot of traffic will be captured, while none of it is relevant. This is because all the broadcast traffic received on the Ethernet interface is also forwarded to the network bridge, and hence tap0. To keep the amount of data manageable some filters must be applied.
Basic Filtering Wireshark Trace#
Wireshark allows for extensive filtering of data, to filter out irrelevant data in a long trace. The traffic can be filtered, based on the properties of the Z/IP frames:
Z/IP frames ...
... are sent using UDP
... are encrypted
... uses UDP port 41230 and unencrypted uses UDP port 4123
... use DTLS encryption
The IPv6 of Z/IP Gateway itself is known (typically fd00:aaaa::3)
The IPv6 prefix of the Z-Wave nodes is known (typically fd00:bbbb::)
It is known whether the Z/IP client is using IPv4 or IPv6
Filtering on Frame Type#
The trace can easily be filtered down by entering:
udp
In the “display filters” field in Wireshark. While it reduces the trace significantly, a lot of irrelevant traffic remains. It can be filtered by instead using:
dtls
However, this still shows all DTLS traffic which may be more than required.
Filtering on IPv6 Addresses#
If using IPv6, the LAN and PAN prefix are preset, and the filter can be based on those parameters. As both starts with fd00:: in the default configuration, the following filter can be applied:
ipv6.addr==fd00::/16
However this may still show non-Z/IP traffic, as other host may also have addresses beginning with the prefix fd00::.
Instead, a narrower filter can be used:
ipv6.addr==fd00:aaaa::3 or ipv6.addr==fd00:bbbb::/32
Here, the filter specifically filters on Z/IP Gateways IP or the prefix of the Z-Wave PAN. This results in just the traffic coming from or going to the Z/IP Gateway and the Z-Wave nodes. Proceed with this filter.
Filtering on Ports#
Even with the narrow filter from above, more traffic than just the Z/IP traffic may still be seen, as Z/IP Gateway also handles mDNS, DHCP and many other protocols. It may be practical to narrow the filter even further. To do this filter the ports specifically use for Z/IP Traffic:
udp.port == 41230 or udp.port==4123
Merge this with our previous filter
(ipv6.addr==fd00:aaaa::3 or ipv6.addr==fd00:bbbb::/32) and (udp.port == 41230 or udp.port==4123)
This leaves an entirely blank trace. Now, the frames are certainly filtered out. To generate some Z/IP traffic, start libzwaveip:
$ ./reference_client -s fd00:aaaa::3Libzwaveip will immediately DTLS handshake with Z/IP Gateway:
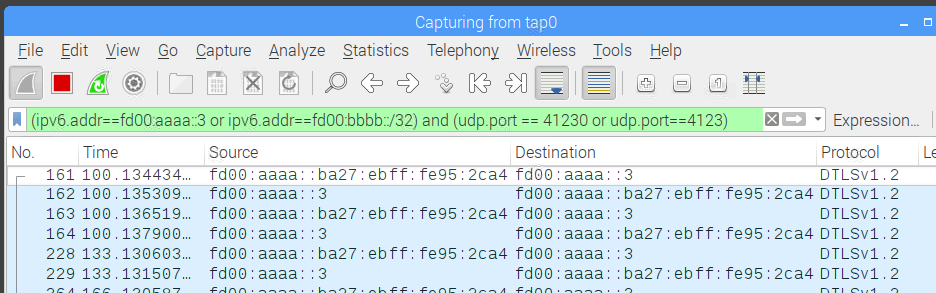
The filter is working as intended.
The frames seen are only the initial DTLS handshake, and not carrying any Z/IP payload. To see a payload, send the following command with libzwaveip:
(ZIP) send "Static Controller [f0c4d187-001-000]" COMMAND_CLASS_NETWORK_MANAGEMENT_PROXY NODE_LIST_GET 00
(ZIP) Transmit OK
(ZIP)This triggers a lot more traffic, however there is a problem. If selecting one of he frames carrying “application data”, the actual payload cannot be seen, only the encrypted payload.
Setting up Decryption#
To decrypt the traffic in Wireshark, copy the DTLS PSK from zipgateway.cfg. In Wireshark, go to “Edit” -> “preferences...”. Expand “Protocols” and scroll to “DTLS”:
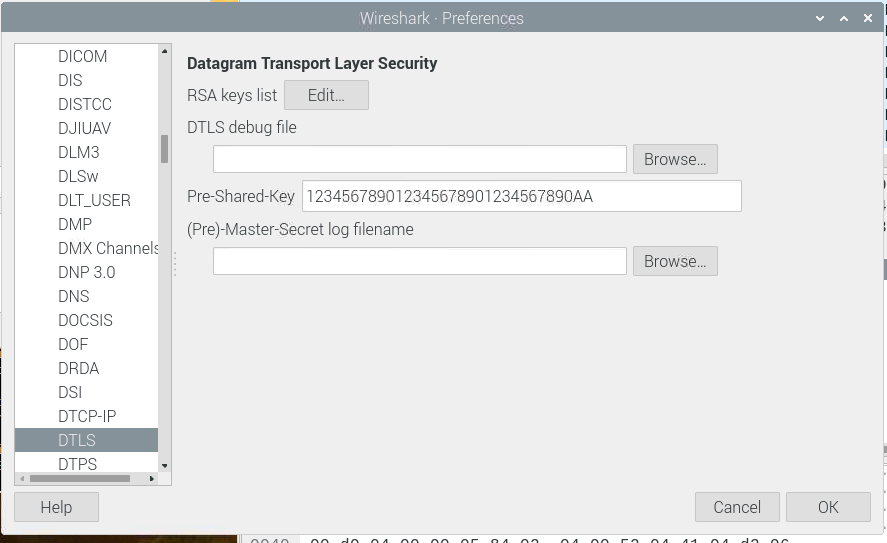
Here, the DTLS PSK should be entered in the “Pre-Shared-Key” field. Click “ok”. Wireshark will immediately reparse the trace to decode any DTLS frames. The data field is now also visible on the DTLS frames.
By expanding the data field, the payload can now be seen:
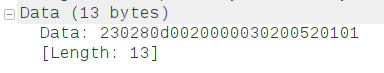
Filtering on Payload#
You can now see the actual payloads of all Z/IP frames, which allows you to apply even further filtering. There are two types of Z/IP frames, 0x02 and 0x03. The later are “keep alives”, which are used to prevent the DTLS session from timing out, but typically not interesting for debugging purposes.
Try to append the following to the filter:
data.data[0:2] == 23:02
Resulting in:
(ipv6.addr==fd00:aaaa::3 or ipv6.addr==fd00:bbbb::/32) and (udp.port == 41230 or udp.port==4123) and data.data[0:2]==23:02
This filter checks that the first two bytes of the payload are 0x23 0x02, a Z/IP encapsulation frame. Now, you are only seeing the Z/IP traffic, nothing else.
Many more filters can be devised based on the actual payload, such as filtering for specific command classes, or even specific values within a specific command class, allowing a huge trace with thousands or even millions of frames to be broken down very fast.
Parsing Z/IP Frames#
Wireshark itself does not understand Z/IP payloads and there tools are not available for parsing them yet. Instead, the frames have to parsed by hand: The first frame after clicking connect in PyZIP has the following payload:
23 02 80 50 a3 00 00 52 01 01From SDS13784-9 section 4.10.3 the format of the Z/IP packet is available: https://www.silabs.com/documents/public/miscellaneous/SDS13784-Z-Wave-Network-Protocol-Command-Class-Specification.pdf
The frames payload can be parsed byte for byte:
23 COMMAND_CLASS_ZIP
02 COMMAND_ZIP_PACKET
80 Ack request
50 Z-Wave cmd included ||secure origin
a3 Sequence number
00 Source endpoint
00 Destination endpointLeaving the Z-Wave payload:
52 01 01The payload is parsed easiest using the command class header, included in the Z/IP Gateway SDK. First, unzip the source:
$ tar -xvf zipgateway-7.13.01-Source.tar.bz2
$ cd zipgateway-7.13.01-Source/usr/local/Z-Wave/include/Search for the first byte, identifying the command class, inside ZW_classcmd.h:
$ grep '0x52' ZW_classcmd.hYou will get the following response:
#define MFG_ID_REMOTEC 0x5254 //Remotec
#define COMMAND_CLASS_NETWORK_MANAGEMENT_PROXY 0x52Because the payload is a command class, not a manufacturer ID, the latter makes more sense: COMMAND_CLASS_NETWORK_MANAGEMENT_PROXY. Knowing the command class, the command within that class can be found. Knowing the format, search for the command class name, and the following 10 lines, and within this scope search for the command identifier:
$ grep -A 10 'NETWORK_MANAGEMENT_PROXY' ZW_classcmd.hHere, the commands can be seen or the computer can find the command as follows:
$ grep -A 10 'NETWORK_MANAGEMENT_PROXY' ZW_classcmd.h | grep '0x01'
#define NETWORK_MANAGEMENT_PROXY_VERSION 0x01
#define NODE_LIST_GET 0x01Because this is a command, go with NODE_LIST_GET.
The COMMAND_CLASS_NETWORK_MANAGEMENT_PROXY NODE_LIST_GET is described in SDS13784-9 section 4.5.4.1, where it can be seen that the last byte is a sequence number.
To the above command, the Z/IP Gateway returns two responses:
23 02 40 00 a3 00 00
23 02 00 d0 05 00 00 05 84 02 04 00 52 02 01 00 01 21 00 00 00 00 00 00 00 00 00 00 00 00 00 00 00 00 00 00 00 00 00 00 00 00 00 00 00 00Parse each of these frames.
Capturing Traffic to Z-Wave Nodes#
Include a node to the Z-Wave network and try sending basic get to the device using libzwaveip:
(ZIP) send "Switch Binary [d21b2f63-006-000]" COMMAND_CLASS_BASIC BASIC_GET
(ZIP) Transmit OK
(ZIP)In this case, the frame is sent to the node ID 6.
Next, look at the Wireshark trace:
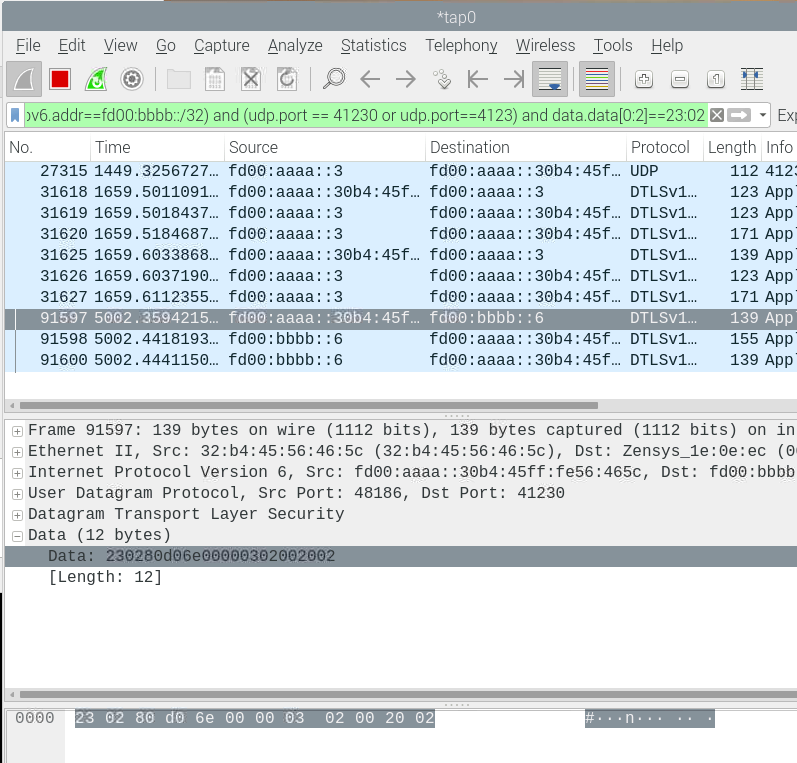
When looking at the very last byte of the IPv6 address of the node you are communicating with, it is identical to the node ID. This allows easy cross referencing of Zniffer traces and Wireshark traces and specific nodes can be filtered out in the Wireshark trace.
Try modifying the filter to only show traffic to and from the slave device.
Conclusion#
At this point, Wireshark should be a familiar tool. You should know how to capture Z/IP traffic, decrypt the frames, and parse the contents.