Analyzing Network Analyzer Session Files#
Simplicity Studio's Network Analyzer debugging tool provides a rich and flexible interface to Silicon Labs embedded networks, which helps you develop and debug new network applications.
This chapter shows how you can use the Simplicity Studio Network Analyzer tool to analyze and debug network behavior.
In this section, "debug adapter" means a WSTK board for the EFR32.
Network Analyzer Environment#
The Network Analyzer environment contains the following work areas:
Devices view - lists all debug adapters and their connected hardware that are accessible to Network Analyzer.
Capture sessions - contain data captured from a node or set of nodes.
Editor panes - display the data of a given capture session.
Adapters View#
On startup, Simplicity Studio automatically discovers and lists all debug adapters that are connected to the local subnet. You can also configure Simplicity Studio to discover debug adapters on other subnets.
Capture Sessions#
Network Analyzer can display one or more capture sessions. Each capture session stores data that it receives from one or more nodes, and displays it in the editor panes.
Network Analyzer supports two types of capture sessions:
Live sessions display data as it is captured; the display is continuously refreshed as new data arrives. Network Analyzer maintains one live session at a time.
Saved sessions contain captured data that has been saved to permanent storage in a named .isd file. You can load a saved session and play it back at any time.
Editor Panes#
Editor panes provide different views of capture session data. Up to five editor panes can be open at any one time:
Map provides a graphical view of the network, where nodes are displayed with their network identifiers. The map also displays network activity.
Transactions displays high-level node interactions that might comprise multiple events.
Events displays information about all packets transmitted and received during a capture session.
Event Detail displays the decoded contents of the packet that is currently selected in the Events pane.
Hex Dump displays the data of the selected event in raw bytes. Network Analyzer highlights bytes that map to the data currently selected in the Event Detail pane.
Capturing and Saving Data#
You can capture data from the nodes of any connected debug adapters, either from one node at a time, or from multiple nodes simultaneously. You can also capture all network traffic over the current channel by capturing data from a connected sniffer node.
Note: The types of data captured depend on the capabilities of the node's radio chip and debug adapter.
Capturing from a Sniffer Node#
A sniffer node has a sniffer application loaded on its wireless SoC, which enables it to capture all over-the-air transmissions between nodes over the designated channel. When you start capturing from a sniffer node, it captures all packets that are exchanged by the nodes on the designated channel.
Note: As of this writing, the EFR32 does not have a sniffer application.
Capturing from Multiple Nodes#
You can capture data from multiple nodes simultaneously. This is typically done for nodes that belong to the same network.
Network Analyzer captures all incoming and outgoing packet data through the selected debug adapters, whether or not the host nodes have sniffer applications. The data includes failed transmissions, and debug messages from node applications that are compiled in debug mode.
Perfect Trace Session#
Capturing from all nodes in a network yields a perfect trace session. The session data compiles all incoming and outgoing data from each node in chronological real time, providing a richly layered view of all activity within a network. This can be especially useful for debugging a network while it undergoes development.
Note: A sniffer capture intercepts all over-the-air transmissions among network nodes; however, the sniffer cannot detect any data transmissions that are known only to their senders such as messages that fail to arrive at their destination, and debug data such as API traces. These are captured in a perfect trace session.
Reviewing Capture Session Events#
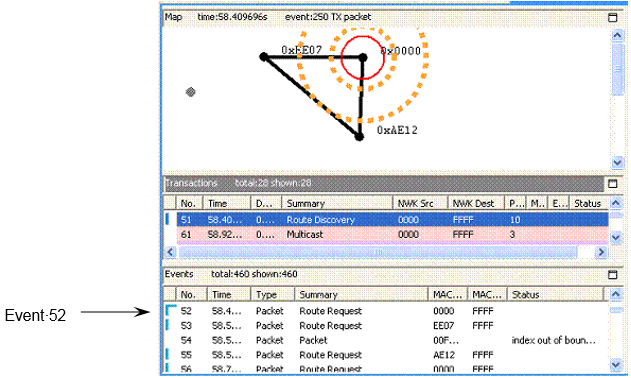
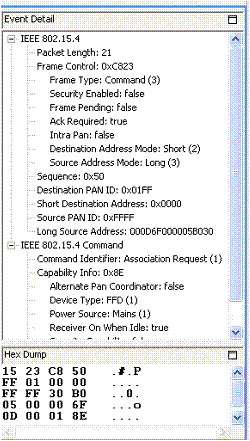
The following figure shows part of a capture session, where events 16 through 23 make a single Association transaction (shown in detail in the following table). The transaction begins with a node's request to a coordinator node to join its network. Each message is paired with an 802.15.4 acknowledgement from the message recipient. The transaction ends when the requesting node acknowledges receipt of the coordinator's Association response:
Event | Summary | Description |
|---|---|---|
16 | Association request | Node requests permission to join the network from the network coordinator. |
17 | 802.15.4 Ack | Coordinator acknowledges message receipt. |
19 | Data request | Node requests network data. |
20 | 802.15.4 Ack | Coordinator acknowledges message receipt. |
22 | Association response | Coordinator permits joining. |
23 | 802.15.4 Ack | Node acknowledges message receipt. |
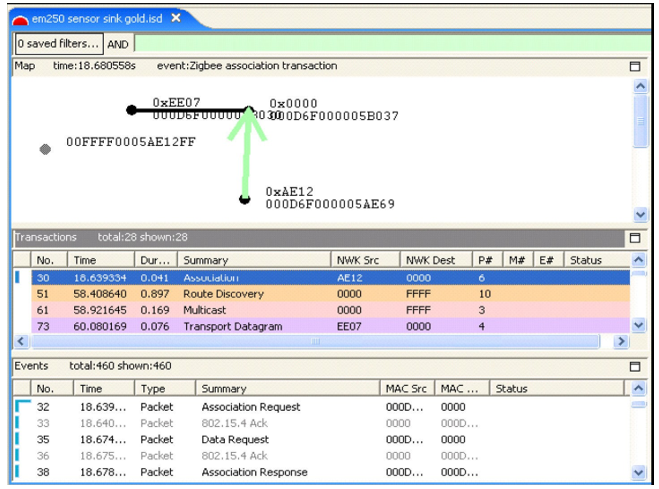
Viewing Connectivity#
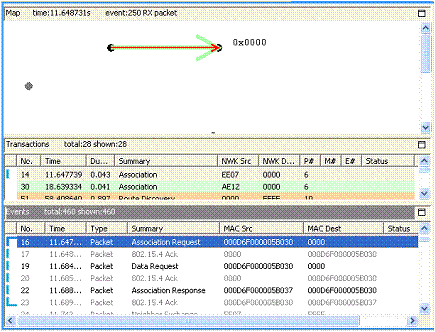
The toolbar's link connectivity button lets you view connections between network nodes. The connectivity diagram shows cumulative connections up to the current event. The following figure shows connections that were established between the network's three-nodes as of Event 52:
Viewing Packet Data#
You can view the contents of an individual packet in the Event Detail and Hex Dump editor panes. These display packet data in decoded format and raw bytes, respectively. For example, Network Analyzer shows the Association Request data for Event 16 in the following figure.
Filtering Captured Data#
By default, the Events pane displays all session events. You can build and apply filters that constrain Network Analyzer to show only events that are of interest. By filtering events, you can analyze results more efficiently.
Setting Filters#
Each capture session has its own filter settings. When you change a session's filters, Network Analyzer immediately refreshes the display. When you exit Network Analyzer, all session filters are cleared and must be reapplied when you restart.
Network Analyzer provides two ways to edit filters:
Filter Manager: Maintains a set of saved filters that you can review and edit. You can also add new filters. You specify any of the saved filters for display on the Filters menu, where they are accessible for use in one or more sessions.
Filter Bar: An editor that attaches to a given session, where you can enter one or more filter expressions on the fly. Network Analyzer discards filter bar expressions for all sessions when it exits.
Quick Filters#
Network Analyzer also provides several preset context-sensitive quick filters that are available from the Transactions and Events editor panes. You access these filters by right-clicking on an event or transaction and choosing a context menu option.
The quick filter options that are available depend on the transaction or event you select. You can specify to hide all events/transactions of the selected type, or to show only that type. Further, if you select an event such as a neighbor exchange that has a source and/or destination address, the context menu also contains options that let you filter events according to that address. This lets you isolate data for a given node.
Filtering Message Types#
It is often useful to hide messages that are not relevant to the current analysis. For example, you typically don't need to view neighbor exchanges-stack-level messages that are exchanged among nodes.
By default, the Filters menu has a single saved filter option, Hide Neighbor Exchange, which the Filter Manager defines as follows:
!isPresent(neighborExchange)By choosing this option, Network Analyzer hides all neighbor exchange messages from the Events pane. You can customize the Filters menu to include other saved filters. You can also set filters manually in the filter bar.
Isolating Node Data#
You might want to isolate all messages for a given node, for one of the following reasons:
Evaluate the amount of traffic between it and other nodes.
Analyze traffic pattern anomalies.
Determine whether and when it stopped sending or receiving messages.
To show only traffic for a given node:
Right click on a message that specifies a source and destination.
From the context menu, choose one of the following options:
Show only destination: node-short-ID
Show only source: node-short-ID
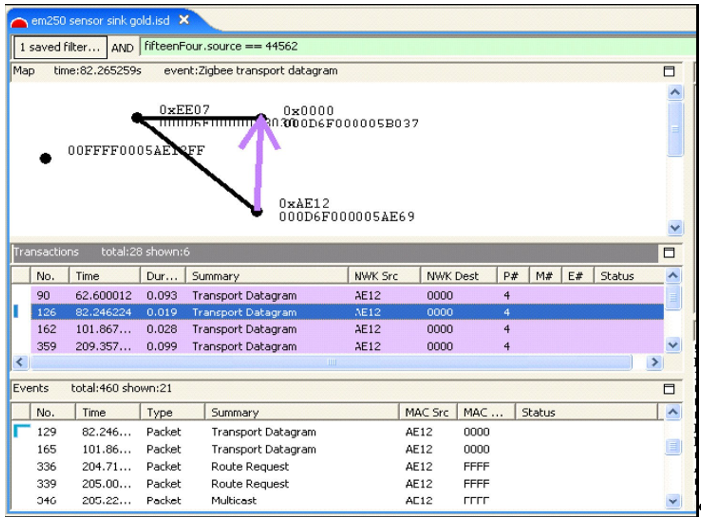
For example, to view only events from node AE12, as shown in the following figure:
Right-click on transaction 30.
From the context menu, choose Show only source AE12.
The filter bar shows a filter expression like this:
fifteenFour.source == 44562
You can further refine the filter by ANDing it with other conditions.-For example, you can specify to hide all neighbor exchange messages from this node by choosing the menu option Filters | Hide Neighbor Exchange, as shown in the following figure.
By doing this, you can determine node-specific data, such as how many non-neighbor exchange events originate from that node and the intervals between them. After analyzing data for that node, you can clear all current filters and set filters on other nodes, in order to compile their data and activity.
Note: Filters are helpful for isolating network issues-for example, quickly ascertaining when a node stops sending data. However, to analyze an event in the context of network operations, you must clear all filters.
Enabling Debug Output in Simplicity Studio#
Debug output from your application can be added to your compiled image. Once debug output is included in your compiled application image, it can be turned on and off at runtime in your running application. To compile debug output into your application in the Simplicity Studio IDE, in EmberZNet 6.10.x and lower, go to the Printing and CLI tab in your application configuration. Check the Enable Debug Printing checkbox, which turns all of the debug printing output on or off globally (all areas). The Debug Configuration section lists the functional areas available to produce debug output from the code. Functional areas include General Purpose debug printing, such as security or reporting, individual plugin debug printing, and application-specific debug printing. In EmberZNet 7.0 and higher, to compile debug output into your application, install the Debug Print Component under Zigbee > Utility. In the Debug Print configuration, you can enable/disable the different functional areas, Stack, Core, App, and ZCL.
Once you have selected the sections of the debug code that you wish to compile into your application, take a look at the generated <application>.h header file. This generated file contains the defines with associated mask values for the debug areas you have chosen to include. Some frameworks provide a means of turning specific debug areas on or off at any time from the command line. For example, the EmberZNet ZCL application framework provides a debugprint command for this purpose. The debugprint command is documented along with all the other CLI commands in the Application Framework API Reference.
For example, if you compile in debug printing for Core, Application, and Attributes you will see a section in the <application>.h header file as shown:
// Global switch
#define EMBER_AF_PRINT_ENABLE
// Individual areas
#define EMBER_AF_PRINT_CORE 0x0001
#define EMBER_AF_PRINT_APP 0x0002
#define EMBER_AF_PRINT_ATTRIBUTES 0x0004
#define EMBER_AF_PRINT_BITS { 0x07 }
#define EMBER_AF_PRINT_NAMES { \
"Core",\
"Application",\
"Attributes",\
NULL\
}
#define EMBER_AF_PRINT_NAME_NUMBER 3If your framework's CLI provides the debugprint command, you can then use the value 0x0004 in this example to turn attribute printing on and off on the command line using the following command lines:
> debugprint on 0x0004
> debugprint off 0x0004Please note that you may only turn on and off debug printing that has previously been compiled into the application. There is no way to turn debug printing on and off for a specific debug printing area if that area has not been compiled into the application in advance.
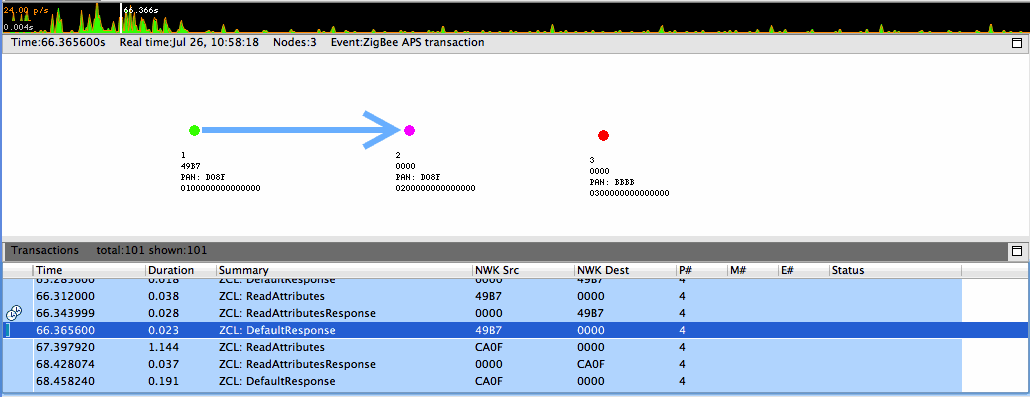
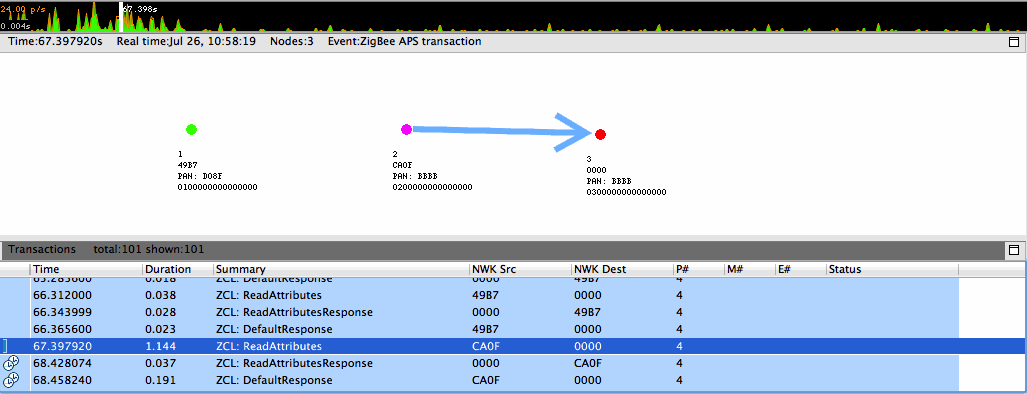
Multinetwork Considerations#
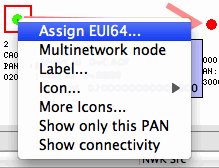
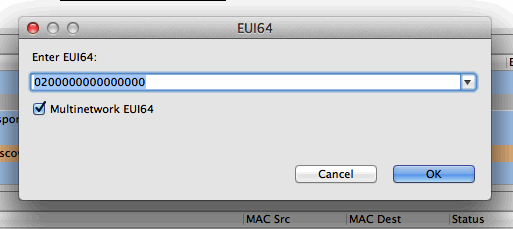
If your application uses nodes operating on multiple networks, this information can be reflected when reviewing capture sessions. Currently, however, Network Analyzer cannot auto-detect multinetwork nodes. At the onset, unless all traditional, conceptual nodes constituting the multinetwork node are assigned EUI64s, each conceptual node shows up as a separate node in the Map editor pane. Each such node must be assigned the same EUI64 by right-clicking on the node in the Map editor pane and selecting "Assign EUI64…" A dialog pops up that facilitates the assignment, and a checkbox indicating "Multinetwork EUI64" must be checked to inform Network Analyzer that the node is indeed a multinetwork node. This sequence is illustrated in the following two figures.
Once all the constituent conceptual nodes have been assigned the same EUI64, Network Analyzer coalesces them into one node in the Map editor pane. Alternatively, if the all the conceptual nodes know the EUI64 or all have been coalesced but Network Analyzer has not been informed that the node is multinetwork, the "Multinetwork node" menu item, seen in Figure above, can be toggled. Once a node is known to Network Analyzer to be multinetwork, it is indicated as such by being colored magenta in the Map editor pane, as seen in the following two figures. These figures also demonstrate the multinetwork capabilities of the Network Analyzer Map editor pane by illustrating events involving the same node on multiple PANs.