Current Consumption Variation with TX Power#
Introduction#
This page discusses the current consumption for different TX power settings. The current consumption of the Blue Gecko device EFR32BG13 is measured during advertisement. The test result can be used as a generic guideline to set the TX power level in an energy-constrained system.
The SoC-iBeacon example running on EFR32BG13 radio board (BRD4104A) was used because it sets the device to broadcast in non-connectable mode, which means that only TX and sleep events are observed in the Energy Profiler.
Current Consumption Breakdown#
The total current consumption of a Bluetooth Low Energy (BLE) device may come from multiple sources such as the CPU, crystal oscillator, peripherals (for example USART, RTCC, PTI, and so on) and the current consumption of radio which typically has the largest energy footprint.
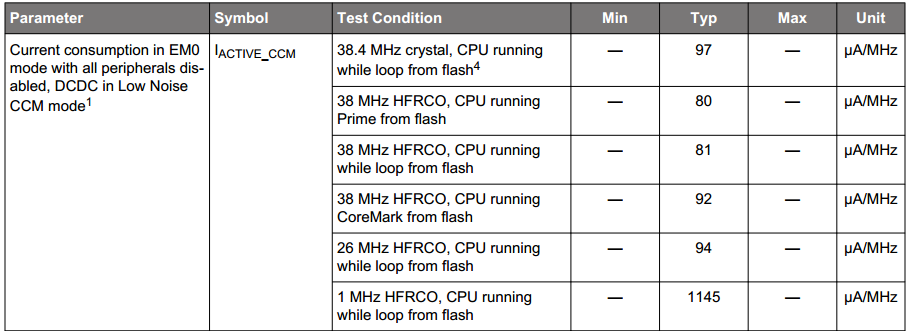
According to the EFR32BG13 data sheet, the current consumption of the CPU in EM0 mode with all peripherals disabled and DCDC in low noise CCM mode (default setting of DCDC in the test application) is 97 uA/MHz. Therefore, the active CPU core driven by 38.4 MHz HFXO will consume a total amount around 97*38.4 = 3.72 mA.

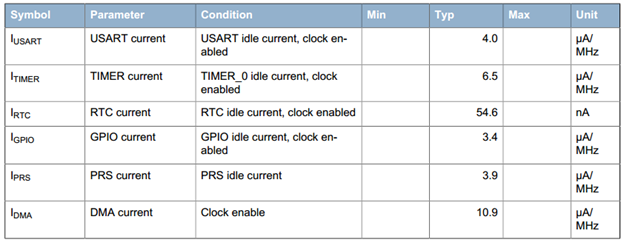
Also, typically the applications use multiple peripherals, such as RTCC, LDMA, PRS, USART, MSC, CRYPTO, and GPIO. EFR32BG13 data sheet does not provide detailed typical current consumption of each peripheral, however, the characteristics of EFM32LG can be used as a rough reference. Below are the electrical characteristics of digital peripherals from EFM32LG data sheet. Depending on their usage, they may contribute up to hundreds of microamps (uA) in total current consumption.

The power consumption of the radio depends on the TX power level and the amount of time that radio is active for transmitting and the active radio time affected by the PHY selection and the payload size.
The TX power level setting is always a trade-off between the required transfer range and current consumption. The distance that the radio signal can travel increases as a result of increasing the TX power level, but, as a consequence, the current consumption also increases. Note that, to improve the range performance of a bidirectional communication, both devices in the communication should increase the TX power level. Otherwise, the range is limited to the smallest of the link budgets in either direction.
Taking the EFR32BG13 for example, the current consumption of the device (MCU in EM1) with 3 dBm TX output power is around 16.5 mA. The value rises to around 26.0 mA while setting the TX power to 8 dBm.


Practical Results#
The Energy Profiler in Simplicity Studio is a software tool that works together with the Advanced Energy Monitoring (AEM) circuitry built into the WSTK main board. It allows measuring the current consumption of the test device in real-time.
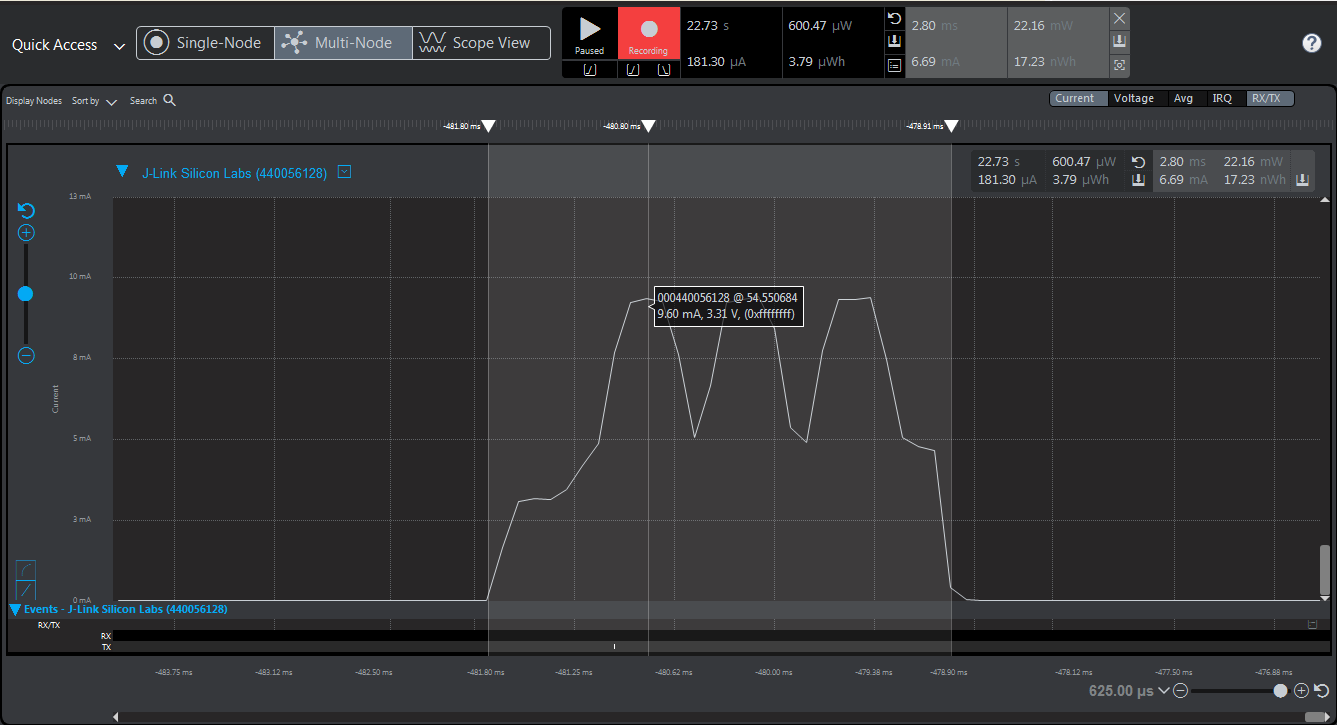
If the test device is programmed with the SoC-iBeacon example, it will broadcast a beacon every 100 ms with 0 dBm TX power level by default and the device will enter sleep mode (EM2) between each two broadcasting events.
The image of the Energy Profiler below shows the active portion of the test device EFR32BG13 while sending out the beacon. The measured average current consumption for the active portion is around 6.69 mA and the total average current consumption of the device is 181.30 uA, which includes both active and sleep periods.

The table below shows a summary of the current consumption measurements for different TX power levels.
The first column shows the maximum TX output power level.
The second columns shows the total average current consumption of the device
The third column shows the average during the beacon
The fourth column shows the RSSI detected by the smartphone near the test device


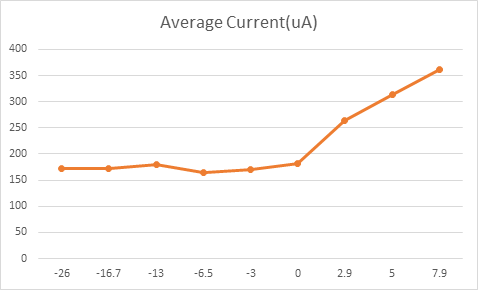
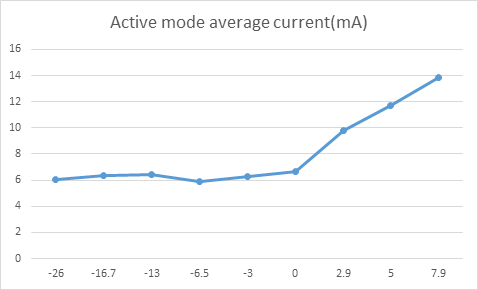
The two charts below illustrate the current consumption (Y-axis) from the table above, across the different TX power levels (X-axis). It is easy to identify that there is no notable difference when decreasing the TX power from 0 dBm down to -26 dBm.


Conclusion#
Based on the measured results, lowering the TX power is beneficial but not across the entire TX Power scale. At a given point, the TX current consumption will be much smaller in comparison with the other parts of the SoC (CPU, crystal) that any further reduction will not have a significant impact on the overall figure.
In the case of EFR32BG13 which was used in this practical test, it may enough to set the TX power level to around 0 dBm for saving power, but going below that will no longer affect the system current consumption significantly.
Example#
This guide has a related code example, here: Testing TX Power Levels
