Debug the Application#
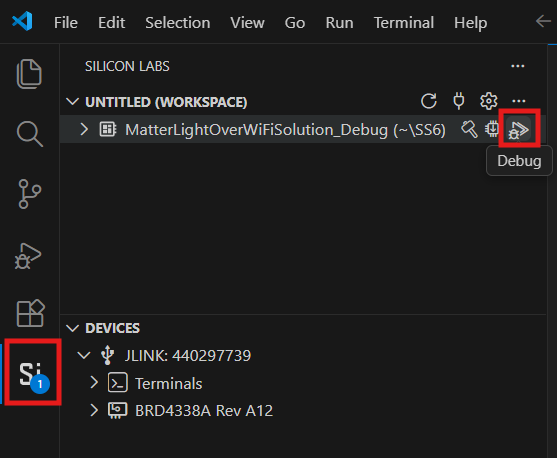
In the VS Code Extension, click the Debug icon beside your Project Name in Workspace.
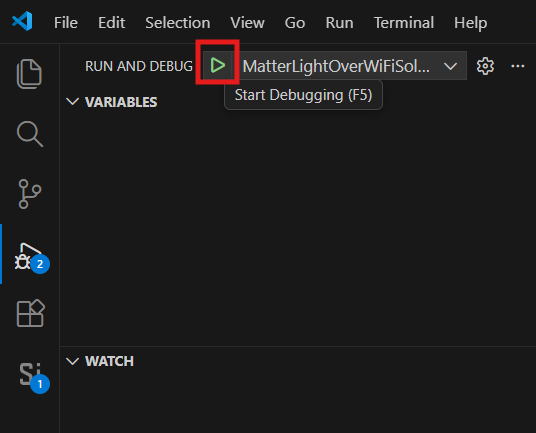
When the debug section starts successfully, the Run and Debug view displays. Click Start Debugging icon.
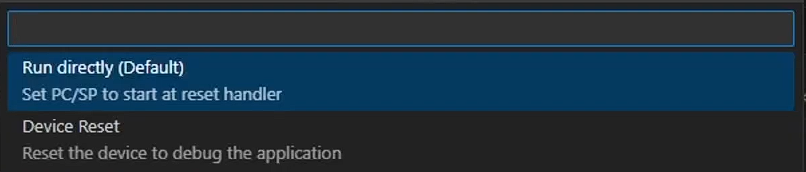
When starting a debug session for the first time, you’ll be prompted to choose one of two startup modes: Run Directly (default) or Device Reset.
The debug session will start and it will halt execution at the main() function in your application.
Add a break point in the desired location of the code using the yellow arrow beside line number, and click the Continue button (having an icon with a bar and play button).
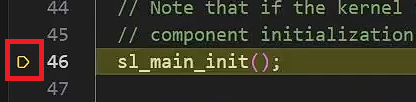
Execution will halt at the break point.
Use the following debug functions to direct the execution of the code:
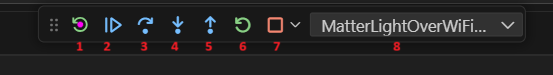
# | Option Name | Description |
|---|---|---|
1 | Restart | Restarts the debug session. |
2 | Continue | Resumes program execution. |
3 | Step Over | Executes next line, skips functions. |
4 | Step Into | Steps into function calls. |
5 | Step Out | Exits current function scope. |
6 | Reset Device | Resets the target hardware. |
7 | Stop | Terminates debugging session. |
8 | Select Instance | Switch between instances when running multiple debug instances. |
Note: For more detailed documentation, refer to Studio VS Code Extension Docs.