Development Tools#
Simplicity Commander#
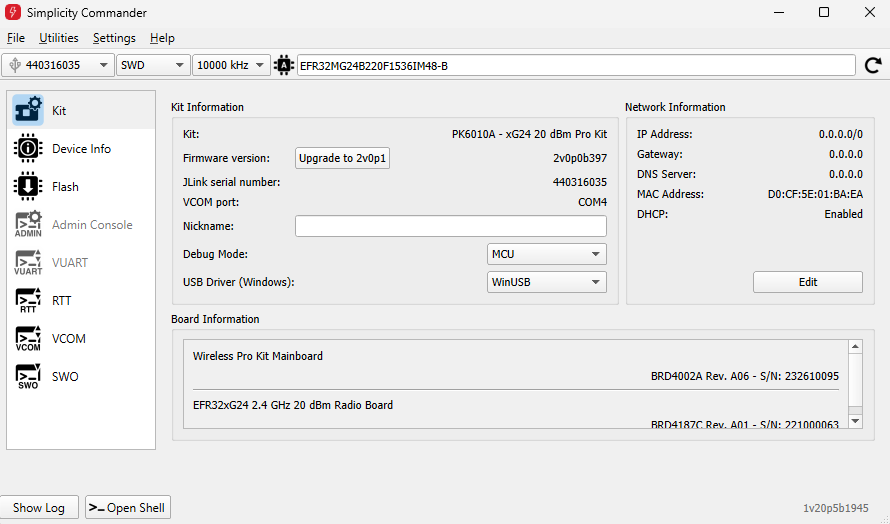
Simplicity Commander is a simple flashing tool which can be used to flash firmware images, erase flash, lock and unlock debug access, and write-protect flash pages via the J-Link interface. Both GUI and CLI (Command Line Interface) are available. See Simplicity Commander Reference Guide for more information.
Pin Tool#
Simplicity Studio offers a Pin tool that allows you to easily configure new peripherals or change the properties of existing ones. In the CONFIGURATION TOOLS tab, click Open on the Pin Tool card or double-click the file <project>.pintool in the Project Explorer view.
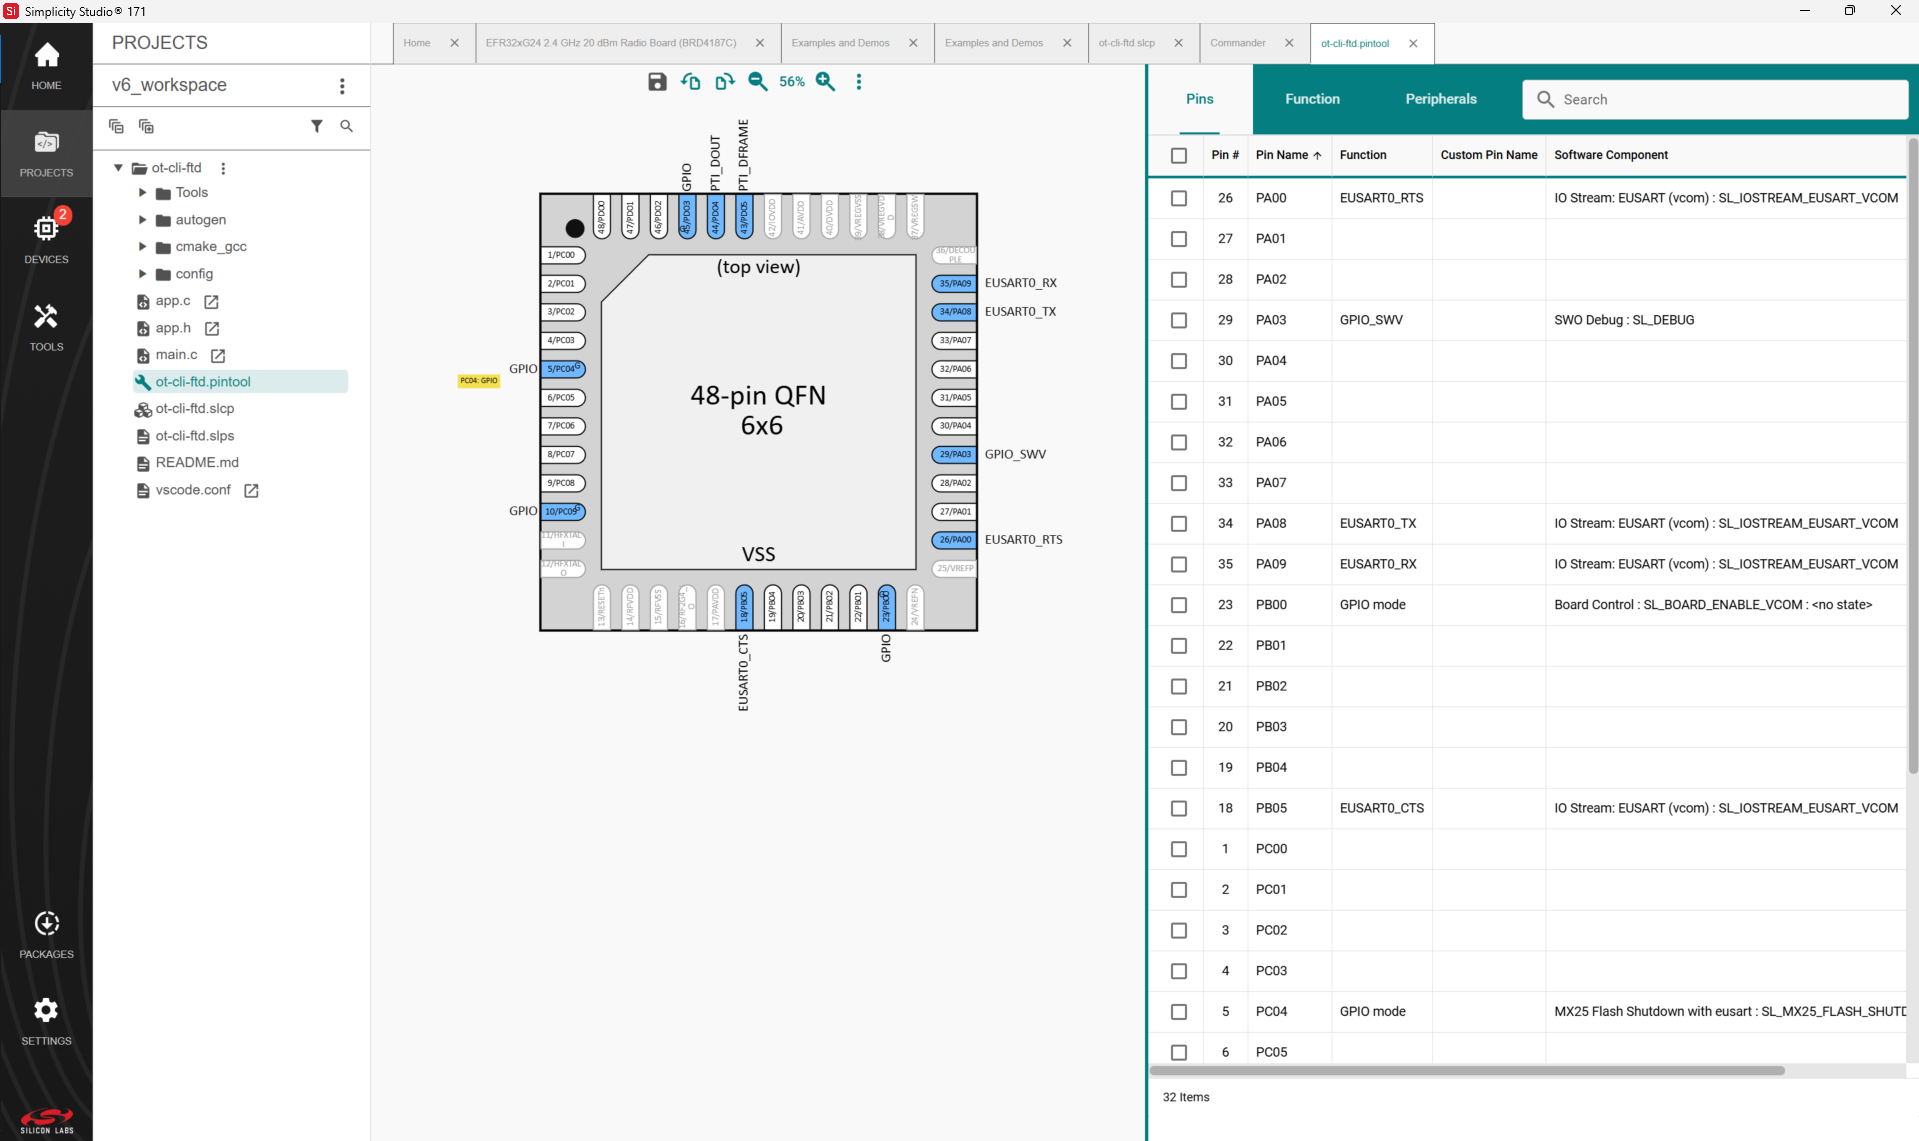
Double-click a software component to open the Component Editor and configure that function. Pin Tool does not autosave.
Multi-Node Energy Profiler#
Multi-Node Energy profiler is an add-on tool used to easily measure the energy consumption of your device in runtime. You can find peak and average consumption, and check for sleep mode current.
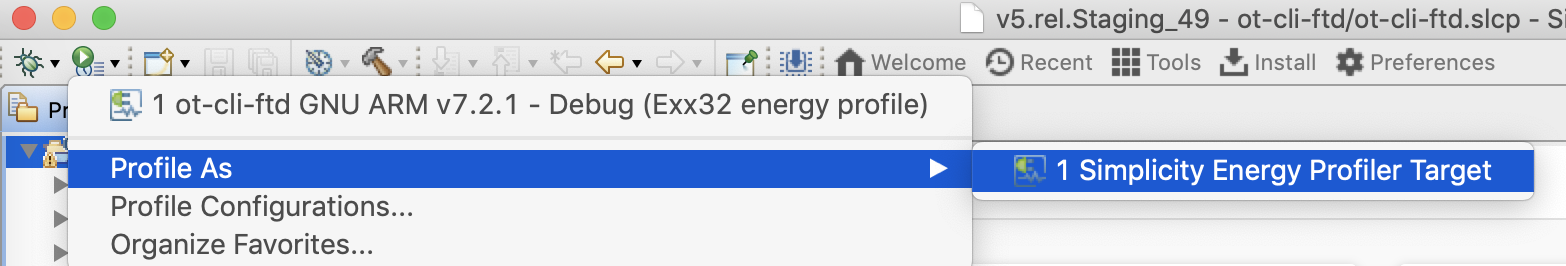
To profile the current project, drop down the Profile as menu in the Simplicity IDE perspective and select Profile as / Simplicity Energy Profiler target. This automatically builds your project, uploads it to the device, and starts Energy Profiler.
For details on how to launch the energy profiler or switch between Simplicity IDE and Energy Profiler perspectives, refer to UG343: Multi-Node Energy Profiler User’s Guide.

For a node running the ot-cli-ftd application, the Energy Profiler capture should be as shown in the following figure:
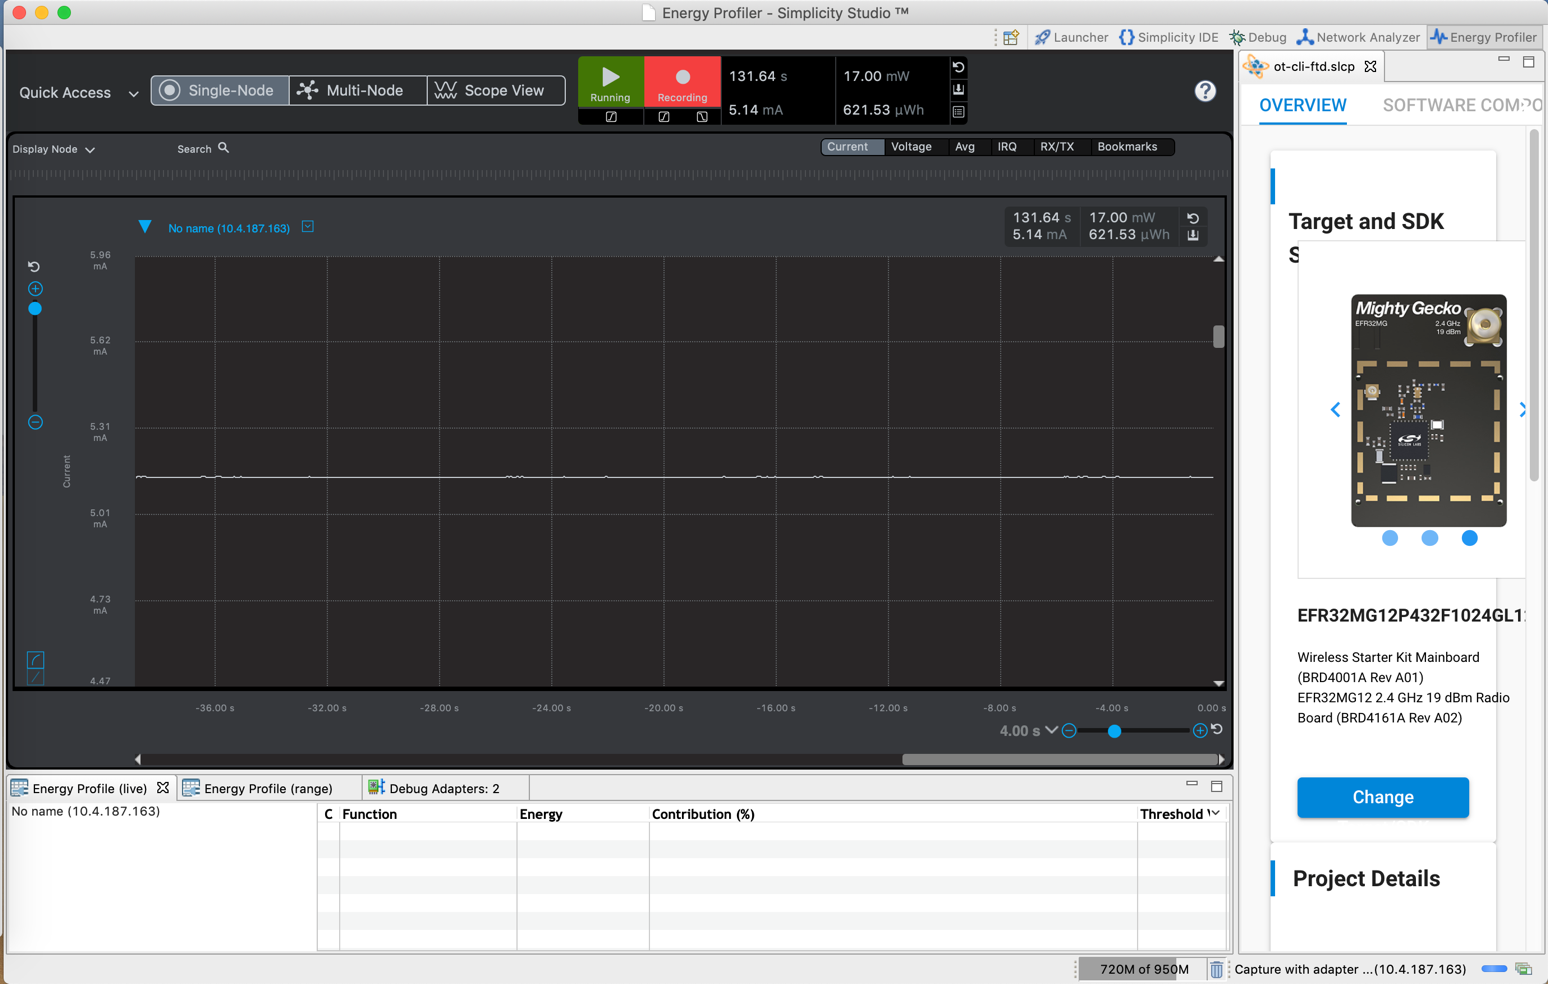
Please note that the energy consumption results you observe may differ as the peripherals and their energy mode are highly dependent on the specific device.
Energy Profiler with Sleepy-demo Applications#
While the energy profiler can be used on any running project, a good example is the OpenThread – SoC Sleepy Demo (MTD) application available with the Silicon Labs OpenThread SDK. It demonstrates Sleepy End Device (SED) behavior using the EFR32's low power EM2 mode.
For this exercise, you will create a two-node network using the OpenThread – SoC Sleepy Demo (FTD) and OpenThread – SoC Sleepy Demo (MTD) application and monitor the current consumption on the sleepy node.
To build the OpenThread – SoC Sleepy Demo (FTD) and OpenThread – SoC Sleepy Demo (MTD) example applications, either flash the precompiled demo applications as described in section Demos or build your own application as described in section Getting Started with Development.
Since the OpenThread – SoC Sleepy Demo (FTD) and OpenThread – SoC Sleepy Demo (MTD) applications are already configured with default network parameters, flashing the applications should automatically form a 2-node network (without specifying any additional commands). Accordingly,
On Node A, flash the OpenThread – SoC Sleepy Demo (FTD) application. This should cause Node A to form a network.
On Node B, flash the OpenThread – SoC Sleepy Demo (MTD) application. This should cause node B to attach as a Minimal Thread Device (MTD) to the network formed by Node A.
Try testing network connectivity by sending a ping from Node A(FTD) to Node B(MTD) as described in section Creating a Network.
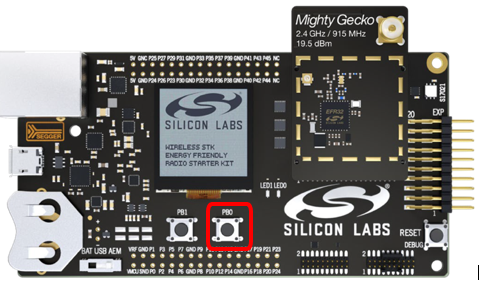
Launch the Energy Profiler, start a capture on Node B(MTD), and press button 0 Node B’s mainboard.
Pressing button 0 on the Node B(MTD) mainboard will cause the node to toggle between operating as a Minimal End Device (MED) and a Sleepy End Device (SED) with the RX off when idle. As the node uses EFR32's low power EM2 (deep sleep) mode, current consumption will significantly drop (from mA to µA range) as seen in the capture below.
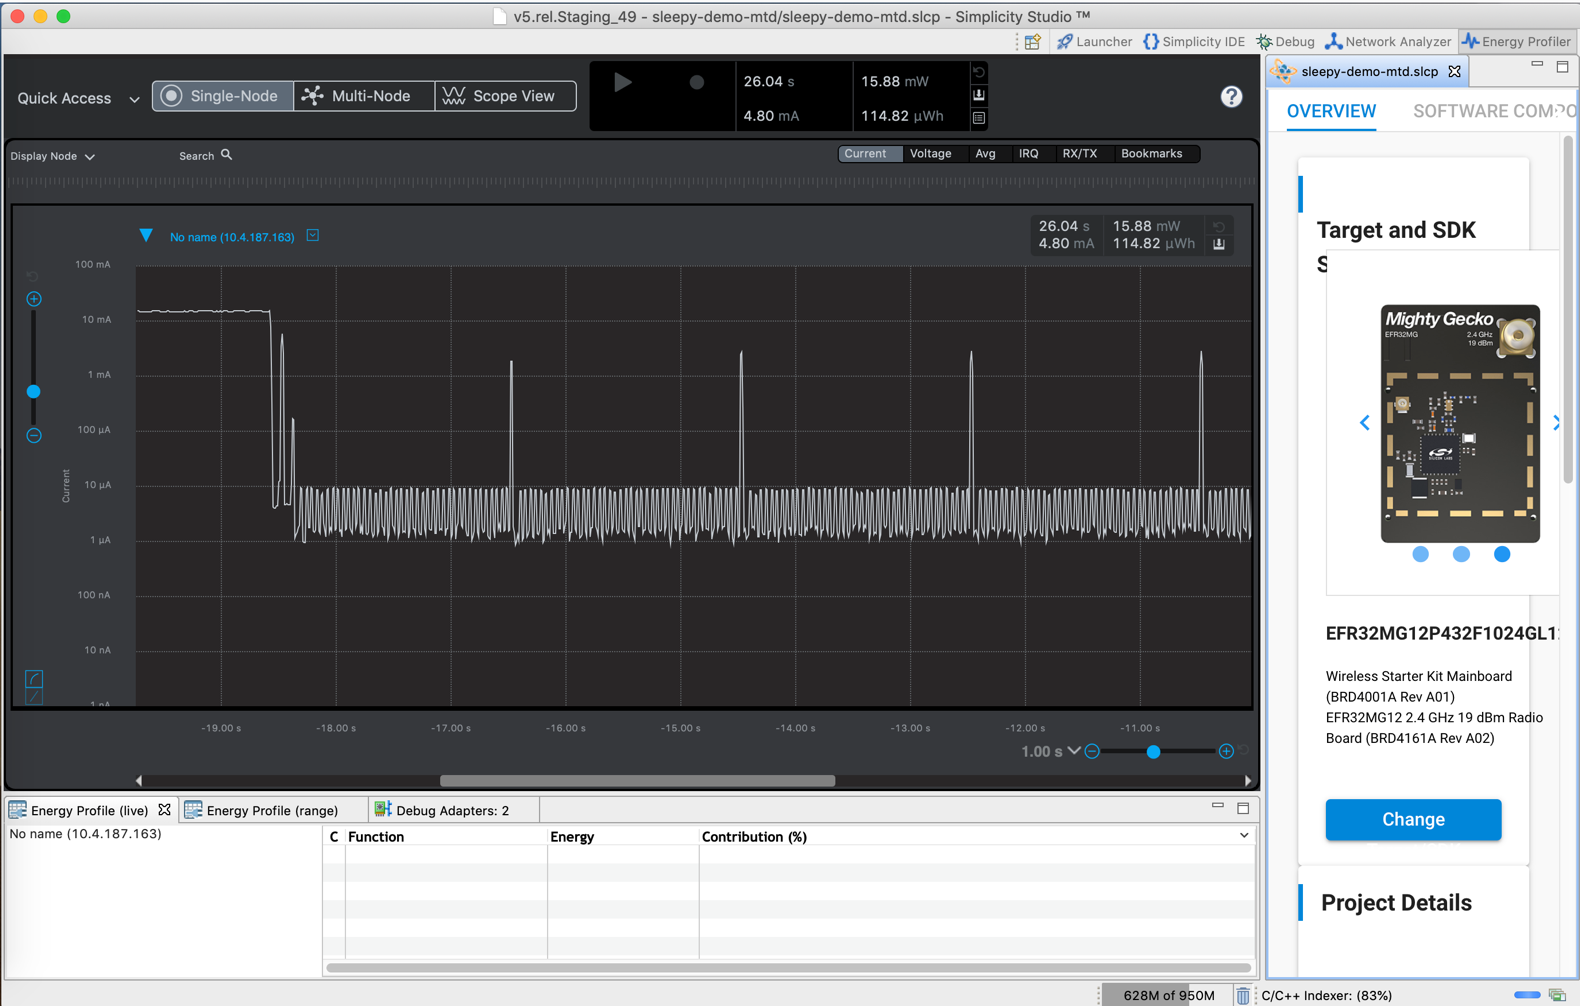
The regular spikes seen every 2 seconds (i.e. the sleep period) represents the tiny interval during which the node briefly wakes up to send a data poll message to its parent, after which it goes back to sleep.
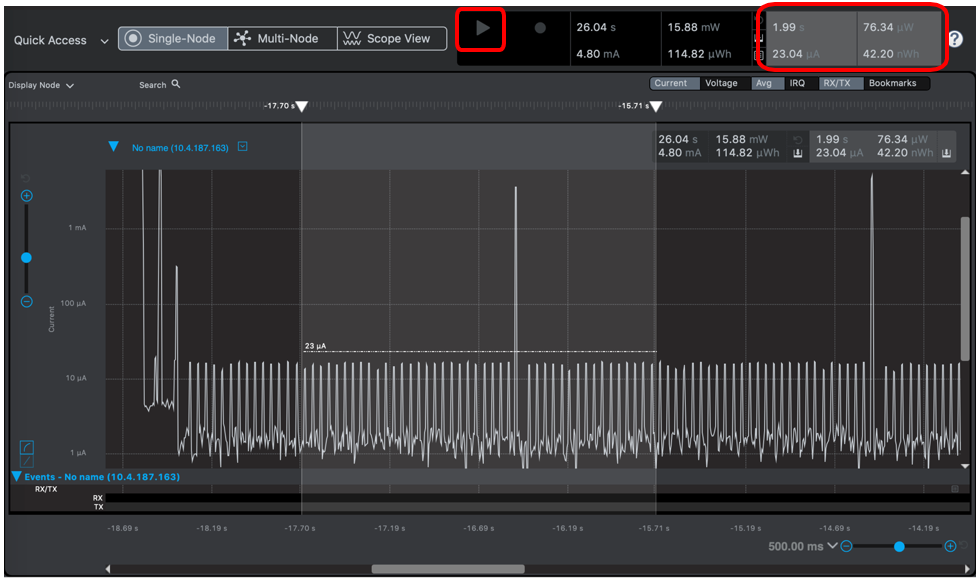
Profiling can be paused by clicking Play. For further analysis, click one of the peaks, and zoom in with time axis (x-axis) and the current axis (y-axis). Note that the maximum consumption may now be greater than it appeared on the diagram before you zoomed in. This is because in zoomed-out mode, the displayed values are averaged. If you need exact values, always zoom in. To measure average consumption, simply click and drag your mouse over a time interval. A new window appears in the upper right corner showing consumption information for the given interval.
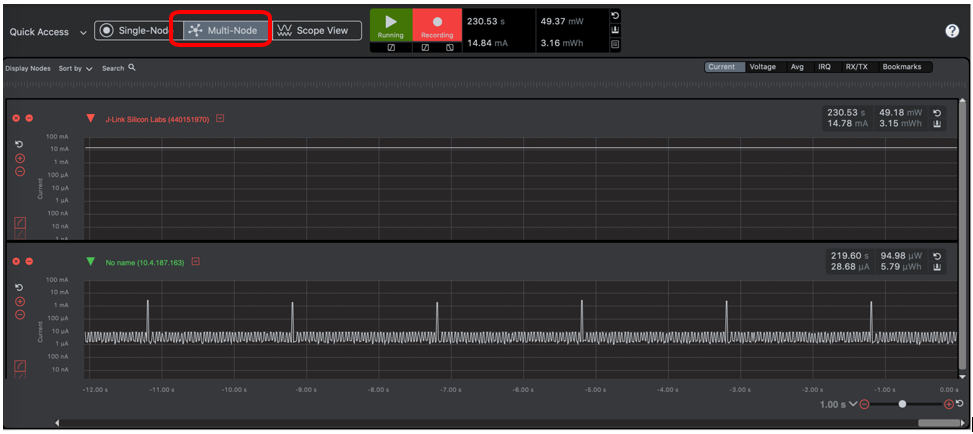
Multi-node Energy Profiler is also able to simultaneously measure the consumption of multiple devices. To start measuring a new device click the Quick Access menu (upper left corner), select Start Energy Capture and choose the Multi-Node View. To stop measuring, click the Quick Access menu, and select End/Save session.
To learn more about how to use this tool, see UG343: Multi-Node Energy Profiler User’s Guide.
Network Analyzer#
Silicon Labs Network Analyzer is a packet capture and debugging tool that can be used to debug connectivity between wireless nodes running OpenThread stack on EFR32 platform. It significantly accelerates the network and application development process with graphical views of network traffic, activity, and duration. See the online Simplicity Network Analyzer, available on https://docs.silabs.com/dev-tools for a guide to Network Analyzer.
The Packet Trace application captures the packets directly from the Packet Trace Interface (PTI) available on the Wireless Gecko SoCs and modules. It therefore provides a more accurate capture of the packets compared to air-based capture.
To capture OpenThread packets using the Silicon Labs Network Analyzer:
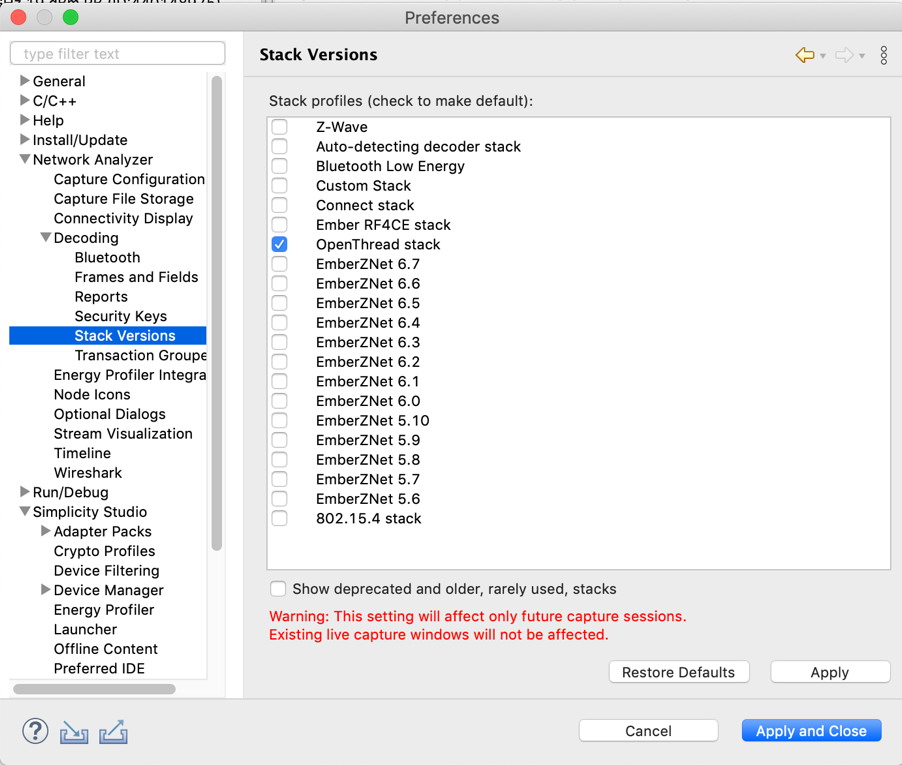
In the Preferences window (Simplicity Studio > Preferences) , under Network Analyzer > Decoding > Stack Versions, select the OpenThread stack option.
In the same Preferences window (Simplicity Studio > Preferences), under Network Analyzer > Decoding > Security Keys, verify the correct Network Master Key used by the Thread network has been added to the list of known keys.
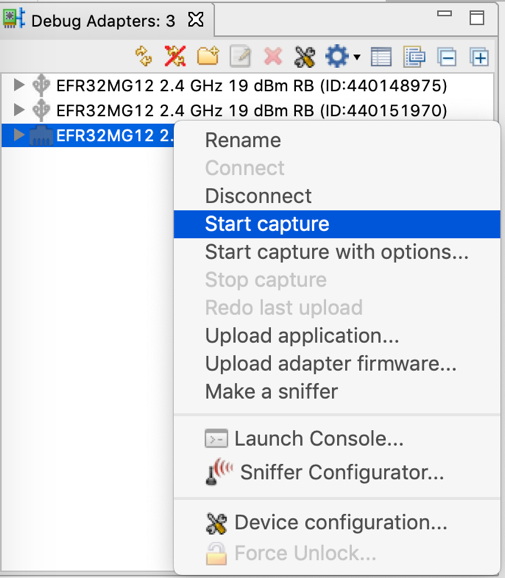
In the Debug Adapters view, right-click the device that is running on a Thread network and start capture.
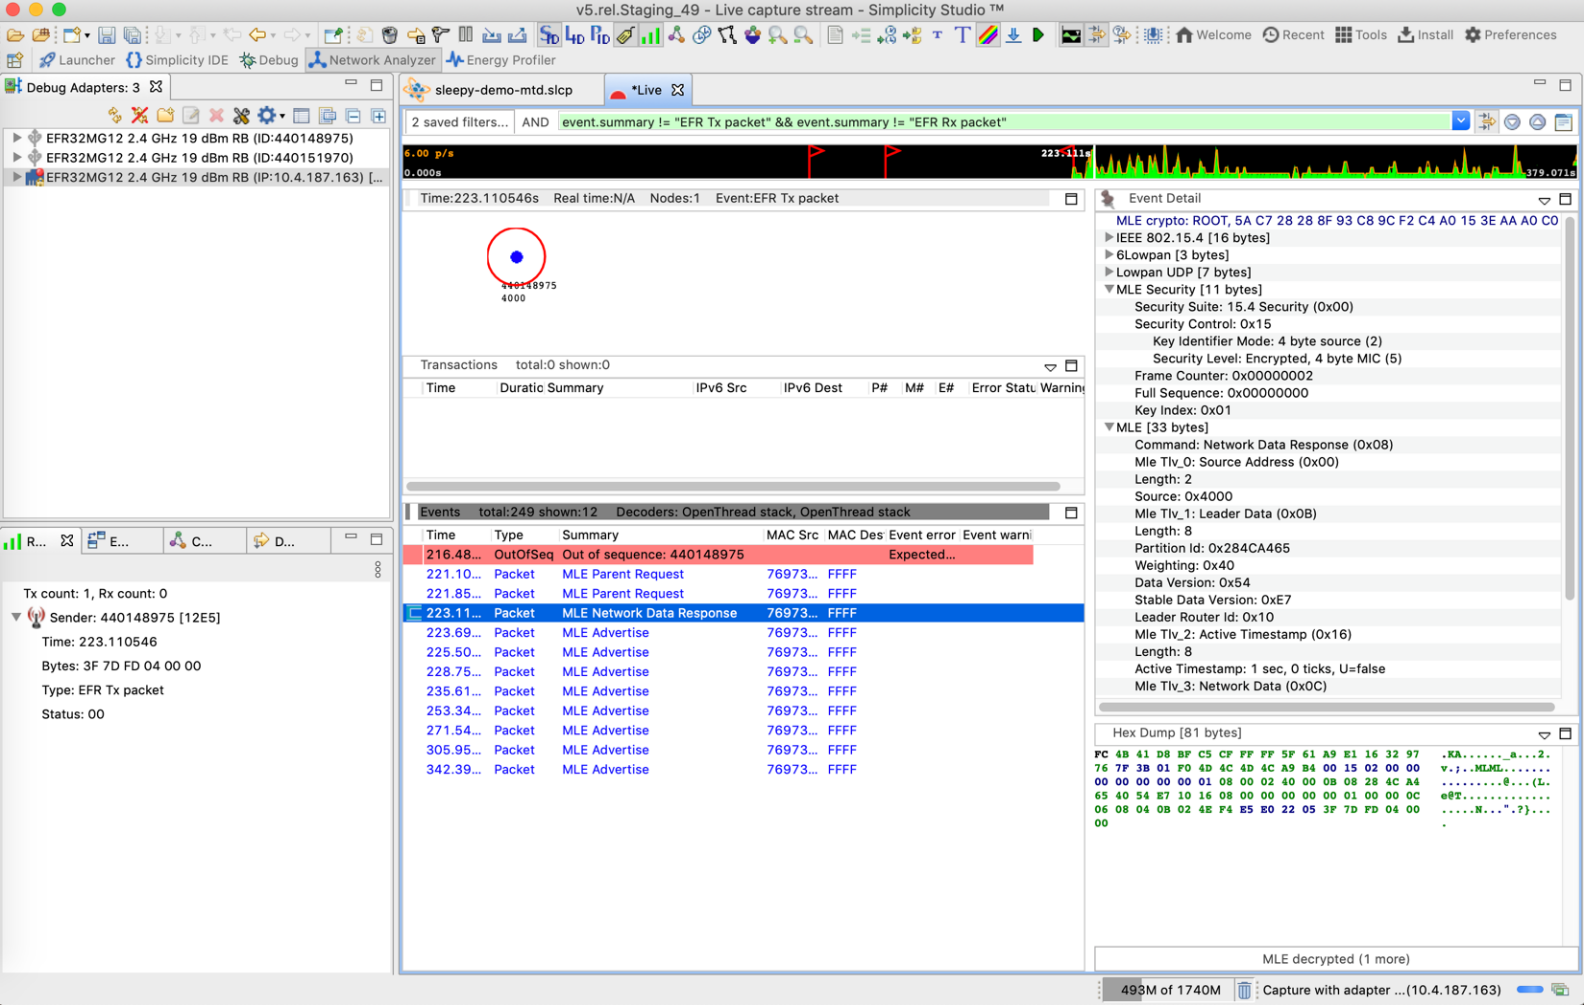
You should now be able to see the Thread traffic as shown below. Clicking the packets to see more details about its contents in the Event Detail view (on the right).
Crash Handler#
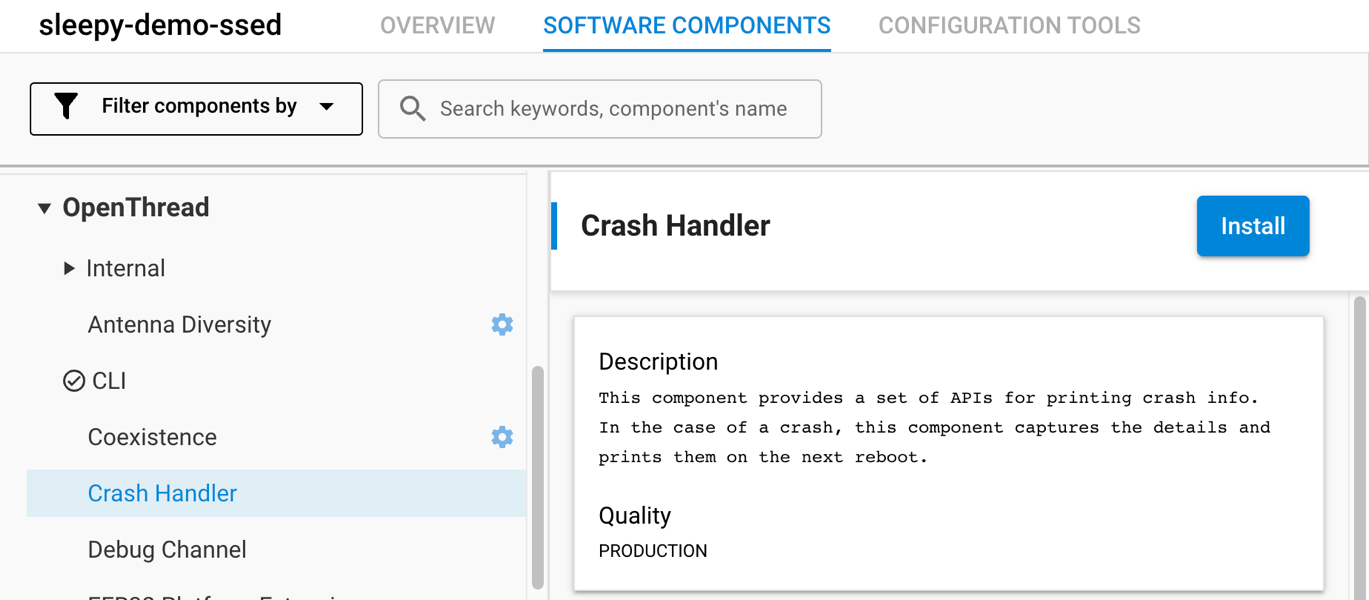
When debugging crashes it may be useful to have detailed information about core registers, information about the C stack, and reset information. This data can be automatically collected and printed on the next boot-up by including the OT Crash Handler in your project.
The crash data is printed using the OpenThread logging system, meaning the output location of the crash data can be controlled by modifying the value of the OPENTHREAD_CONFIG_LOG_OUTPUT configuration.
Example: Crash dump
[C] Platform------: Reset info: 0xa (FLT) [C] Platform------: Extended Reset info: 0xA04 (USG)
[C] Platform------: Thread mode using main stack (20000000 to 20001200), SP = 20001040
[C] Platform------: 1072 bytes used (23%) in main stack (out of 4608 bytes total)
[C] Platform------: No interrupts active
[C] Platform------: Reset cause: Usage Fault
[C] Platform------: Instruction address: 8009272
[C] Platform------: CFSR.UNALIGNED: attempted an unaligned memory access
[C] Platform------: R0 = 0x0804f518, R1 = 0x00000000, R2 = 0x00000000, R3 = 0xdeadb000
[C] Platform------: R4 = 0x00000000, R5 = 0x200012f8, R6 = 0x080092a9, R7 = 0x00000008
[C] Platform------: R8 = 0x20007923, R9 = 0xffffffff, R10 = 0x1fff1200, R11 = 0x00000000
[C] Platform------: R12 = 0x20007e2f, R13(LR) = 0xfffffff9, MSP = 0x20001040, PSP = 0x00000000
[C] Platform------: PC = 0x08009272, xPSR = 0x69000000, MSP used = 0x00000430, PSP used = 0x00000000
[C] Platform------: CSTACK bottom = 0x20000000, ICSR = 0x00000806, SHCSR = 0x000f0008, INT_ACTIVE0 = 0x00000000
[C] Platform------: INT_ACTIVE1 = 0x00000000, CFSR = 0x778fc80f, HFSR = 0x01000000, DFSR = 0x00000000
[C] Platform------: MMAR/BFAR = 0x00000000, AFSR = 0xe000ed34, Ret0 = 0x00000000, Ret1 = 0x080092b5
[C] Platform------: Ret2 = 0x08038d4f, Ret3 = 0x08016f17, Ret4 = 0x08028cff, Ret5 = 0x08010973
[C] Platform------: Dat0 = 0x08038c71, Dat1 = 0x7f33fbff,
OpenThread Diagnostics Support#
OpenThread diagnostic capabilities can be enabled for source and certification library project builds by installing the Diagnostics component.
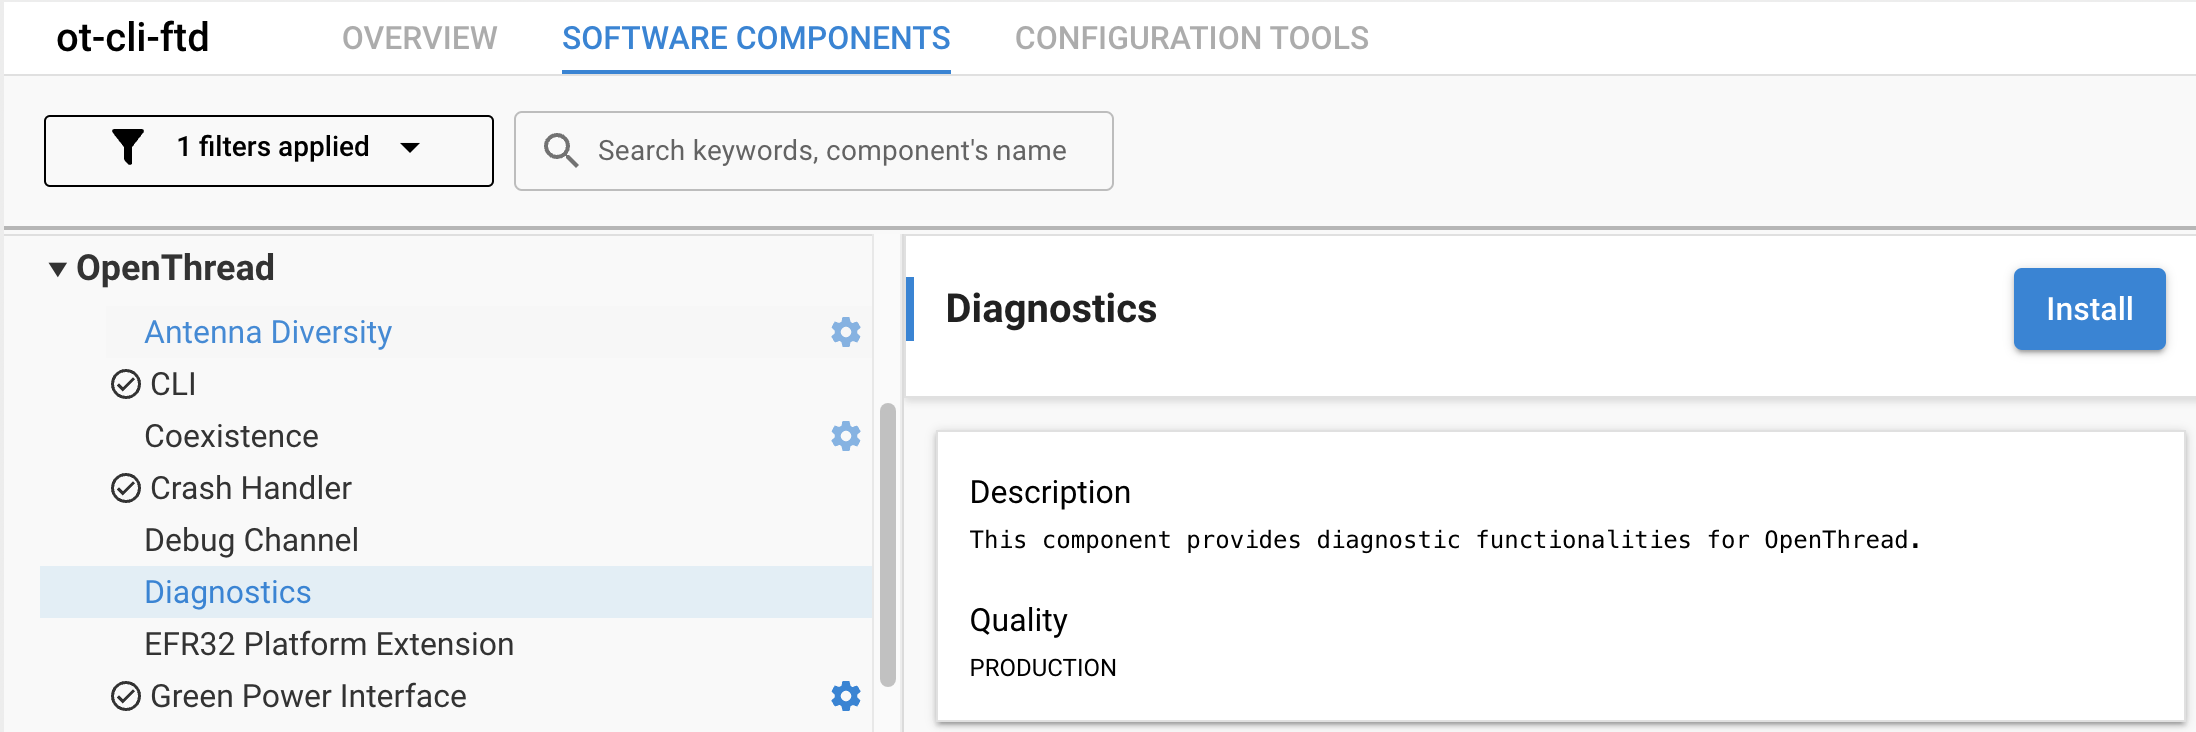
This component will enable the standard OpenThread Factory Diagnostics Module in the project and implement the diag command in the OpenThread CLI. See https://github.com/openthread/openthread/blob/main/src/core/diags/README.md for a detailed reference on the diagnostics CLI commands.