Channel Sounding Performance Metrics#
Accuracy#
Silicon Labs has conducted tests in an indoor office to show the accuracy performance in a real world environment where the RF environment can be challenging (Ex: mulitpath effects, high 2.4 GHz radio activity) for Channel Sounding. It is important to note that the purpose of the accuracy performance metrics provided on this page is to show the potential of the Channel Sounding solution and the impact on its accuracy in different measurement combinations. Therefore, they should be viewed as reference measurements only. The accuracy of the estimated distance may vary from one environment to another and should be evaluated case-by-case.
Test Environment & Configurations#
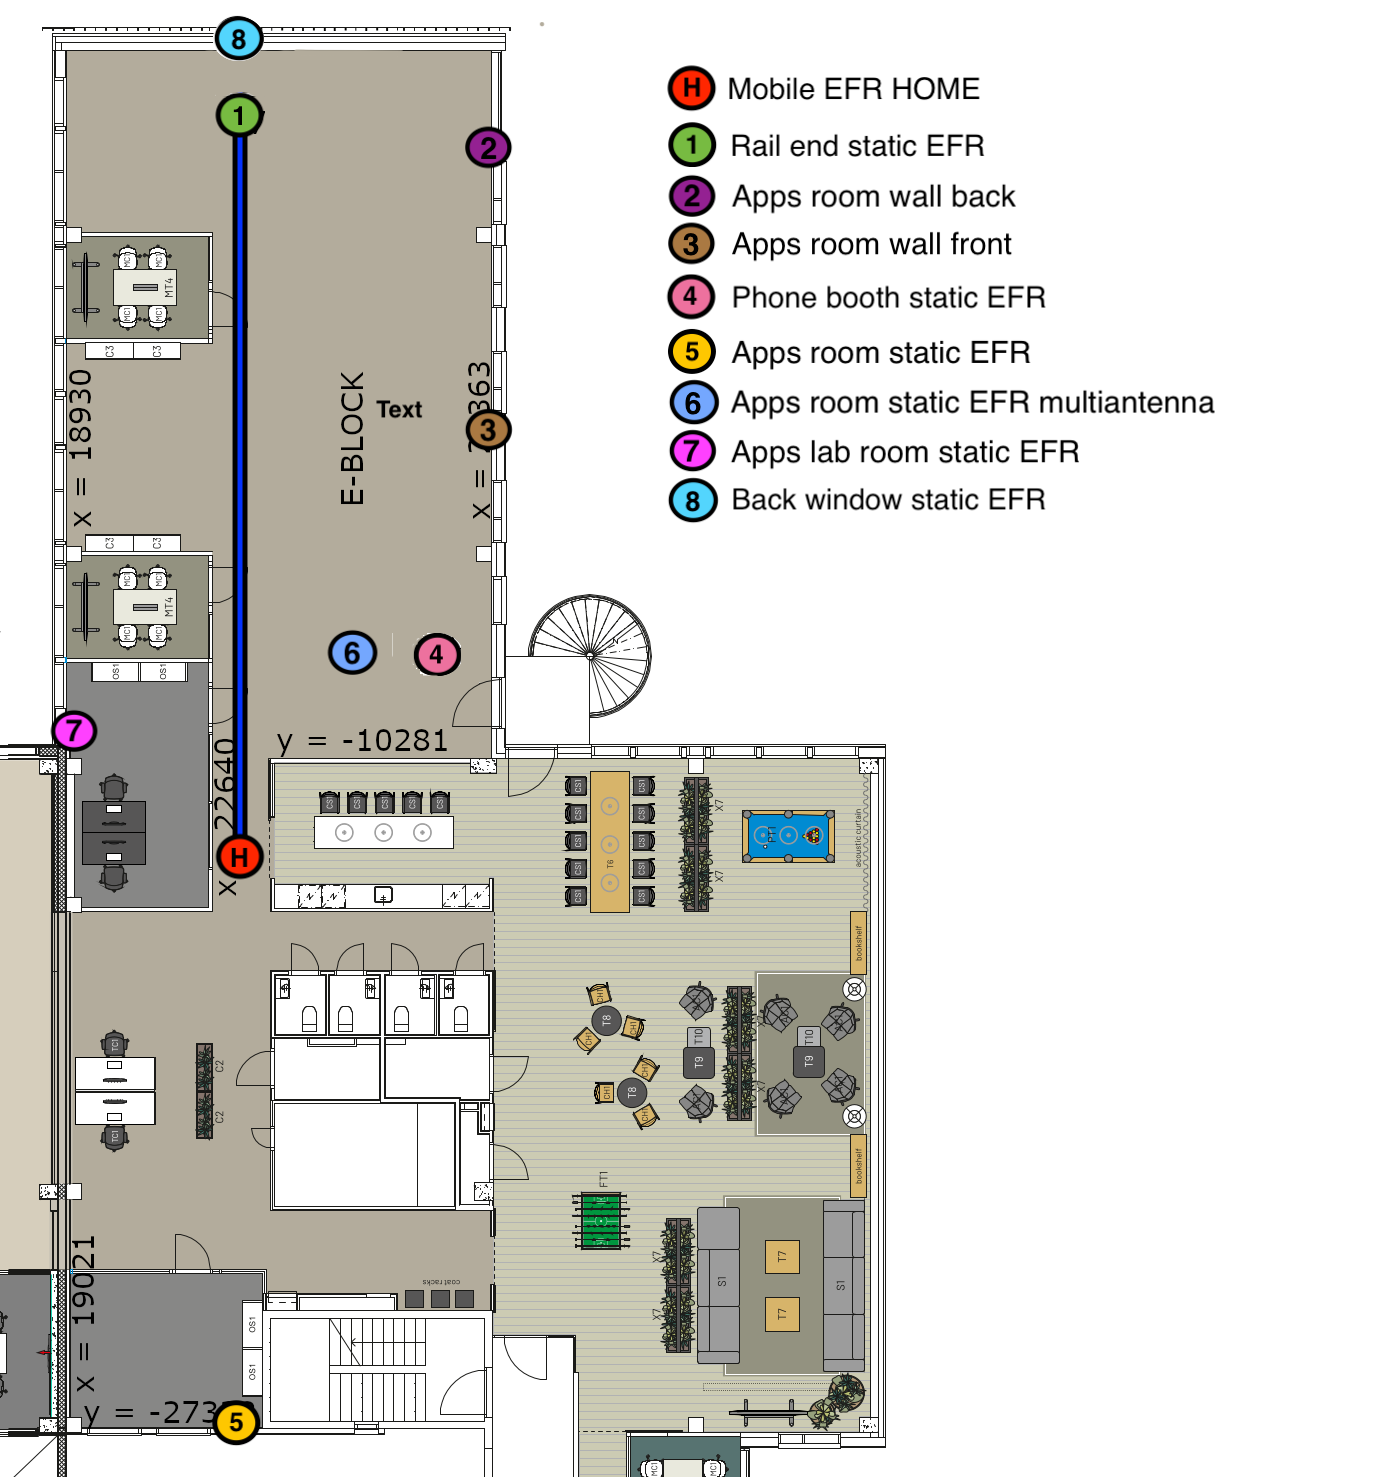
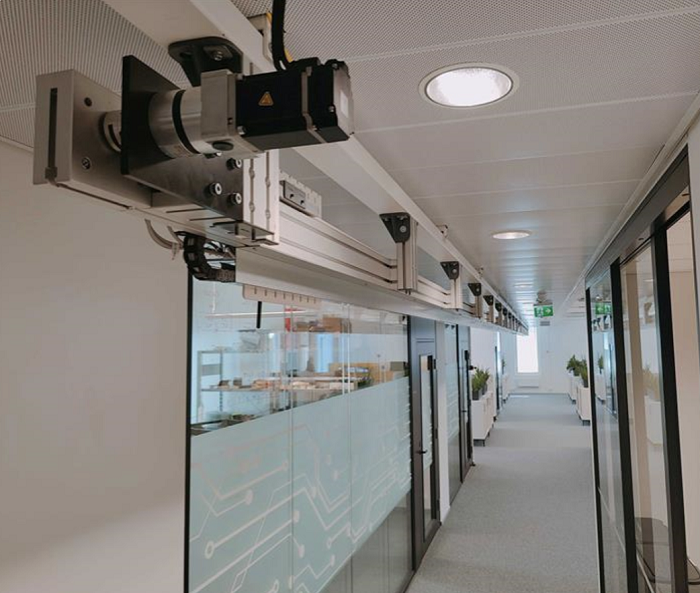
All tests are performed using 2 BRD4198A boards or 2 BRD2606A boards. The images below show the floor map of the office where the BRD2606A and BRD4198A boards are placed at 8 static locations and one mobile location. The BRD4198A and BRD2606A boards at locations H and 1 are mounted on a ceiling rail robot where the BRD4198A's antennas are pointing downwards and the BRD2606A boards are co-polarized. The devices at locations 2, 3, 4, 5, 6, 7, and 8 are either mounted on the ceiling or on the side walls at varying heights with random device orientations. Listed below are the heights at which the devices are placed in the office environment.
Device Position | Height (m) | |
|---|---|---|
BRD2606A | BRD4198A | |
H | 2.242 | 2.144 |
1 | 2.160 | 2.140 |
2 | 2.150 | 2.080 |
3 | 2.183 | 2.100 |
4 | 2.500 | 2.440 |
5 | 2.220 | 2.150 |
6 | 2.653 | 2.600 |
7 | 2.550 | 2.700 |
8 | 2.190 | 2.125 |
The results of PBR and RTT distance estimation are based on measurements taken at multiple distances between 0.5 m and 34 meters, and in different measurement configurations:
Conducted, line-of-sight (LOS), and non-line-of-sight (NLOS) environments
In conducted environment, the antenna paths of 2 BRD4198A boards are connected together using a power splitter to have 4 different cable lengths -> 2.54 m , 6.4 m, 15 m and 27 m.
In LOS environment, the distance is estimated at multiple positions between devices H and 1 ranging from 0.5 to 19.5 meters.
In NLOS environment, the distance is estimated at 28 different poistions between the devices mounted in the office (2-5, 2-4, 4-7, etc.).
SL_RTL_CS_ALGO_MODE_REAL_TIME_BASIC and SL_RTL_CS_ALGO_MODE_STATIC_HIGH_ACCURACY algorithm modes referenced by Real-time and Static respectively.
In SL_RTL_CS_ALGO_MODE_REAL_TIME_BASIC mode, the distance is estimated 200 times at each position (i.e. 200 CS prodedures).
In SL_RTL_CS_ALGO_MODE_STATIC_HIGH_ACCURACY mode, the distance is estimated 4 times at each position (i.e. 400 CS prodedures as 100 CS procedures = 1 distance estimation).
Antenna Configurations
In PBR mode, ACI (Antenna Configuration Index) values 0, 1, 4, and 7 are used which have the following definitions:
0 = Single antennas on both sides
1 = Dual antenna initiator & single antenna reflector
4 = Single antenna initiator & dual antenna reflector
7 = Dual antennas on both sides
In RTT mode, the antenna configuration indicates which antenna (single or switching) is used on the initiator and reflector devices with following definitions [initiator:reflector]:
1:1 = CS_SYNC_ANTENNA_1: CS_SYNC_ANTENNA_1
2:1 = CS_SYNC_SWITCHING : CS_SYNC_ANTENNA_1
1:2 = CS_SYNC_ANTENNA_1: CS_SYNC_SWITCHING
2:2 = CS_SYNC_SWITCHING: CS_SYNC_SWITCHING
High, Medium, and Low Channel Map settings
High: 72 channels are used for CS, 1 MHz channel spacing
Medium: 37 channels, *2 MHz channel spacing
Low: 20 channels, 1 MHz channel spacing
*Increasing the channel spacing results in a reduced maximum range. This relationship is mathematically expressed as
Accuracy Metrics using BRD2606A#
Measurement configuration | 90th percentile of abs error (m) | 95th percentile of abs error (m) | Std of the signed error (m) | Mean Signed Error (m) | ||||
|---|---|---|---|---|---|---|---|---|
Measurement mode | Environment | RTL algorithm mode | ACI/Antenna configuration | Channel Map | ||||
PBR | LOS | Real-time | 0 | High | 0.42 | 0.64 | 0.20 | 0.17 |
Medium | 0.36 | 0.41 | 1.15 | -0.02 | ||||
Low | 1.42 | 1.46 | 0.41 | 0.84 | ||||
1 | High | 0.25 | 0.26 | 0.14 | -0.06 | |||
Medium | 0.27 | 0.29 | 0.43 | -0.09 | ||||
Low | 1.29 | 1.55 | 0.79 | 0.10 | ||||
4 | High | 0.35 | 0.38 | 0.17 | -0.06 | |||
Medium | 0.28 | 0.35 | 1.10 | -0.20 | ||||
Low | 0.66 | 1.04 | 0.40 | 0.18 | ||||
7 | High | 0.37 | 0.43 | 0.14 | -0.22 | |||
Medium | 0.49 | 0.51 | 0.63 | -0.29 | ||||
Low | 1.07 | 1.16 | 0.53 | -0.38 | ||||
NLOS | Real-time | 0 | High | 6.53 | 7.44 | 2.58 | 2.27 | |
Medium | 3.48 | 5.85 | 2.21 | 1.61 | ||||
Low | 7.83 | 10.44 | 4.07 | 2.61 | ||||
1 | High | 4.82 | 5.57 | 1.88 | 1.35 | |||
Medium | 4.64 | 7.38 | 4.08 | 0.14 | ||||
Low | 7.07 | 8.34 | 3.47 | 1.20 | ||||
4 | High | 3.55 | 6.54 | 2.09 | 1.39 | |||
Medium | 3.51 | 6.16 | 2.78 | 0.83 | ||||
Low | 6.22 | 9.97 | 5.64 | 0.54 | ||||
7 | High | 3.39 | 3.58 | 1.48 | 0.86 | |||
Medium | 2.71 | 4.83 | 3.56 | -0.24 | ||||
Low | 8.32 | 10.46 | 5.8 | -0.76 | ||||
RTT | LOS | Real-time | 1:1 | High | 4.13 | 5.14 | 1.52 | 1.91 |
2:1 | 1.91 | 2.33 | 0.67 | 1.08 | ||||
1:2 | 4.67 | 5.51 | 1.64 | 2.12 | ||||
2:2 | 2.02 | 2.29 | 0.69 | 1.09 | ||||
NLOS | 1:1 | 13.21 | 20.40 | 5.69 | 5.26 | |||
2:1 | 14.56 | 18.06 | 5.49 | 5.48 | ||||
1:2 | 13.29 | 20.18 | 5.67 | 5.22 | ||||
2:2 | 14.57 | 17.74 | 5.39 | 5.34 | ||||
Note: The statistical values in the tables are derived from the combined data set of all distance estimations in each configuration. | ||||||||
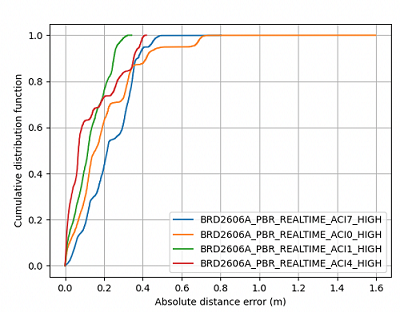
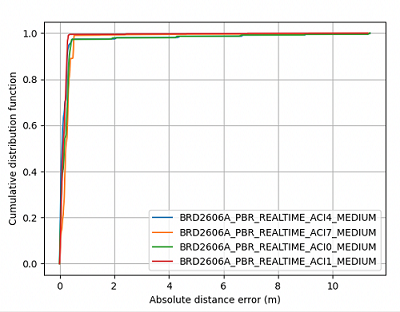
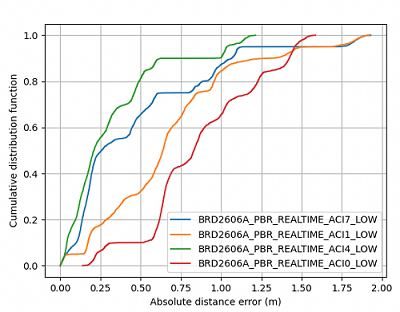
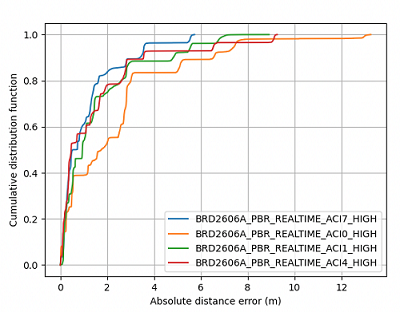
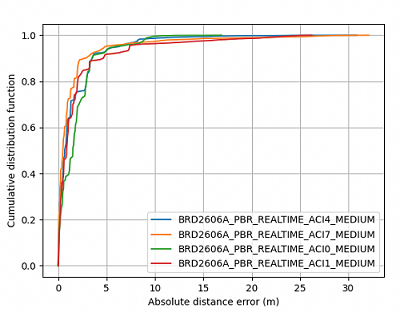
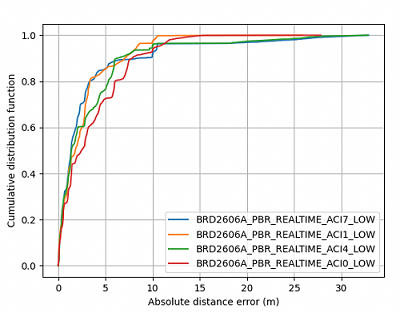
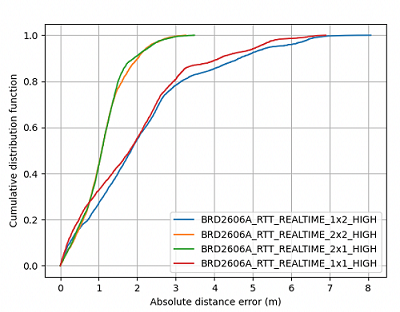
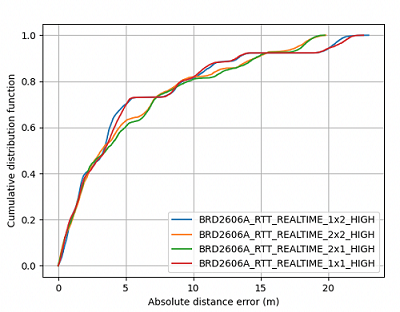
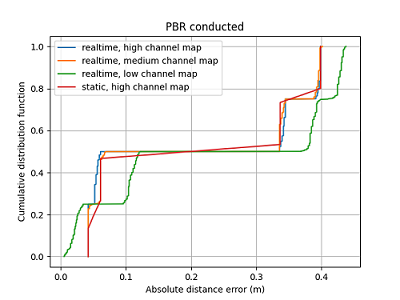
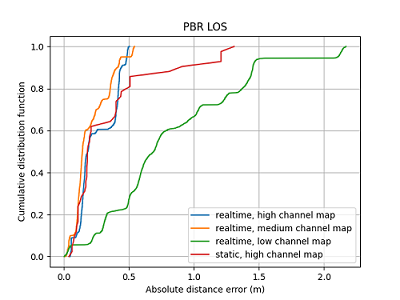
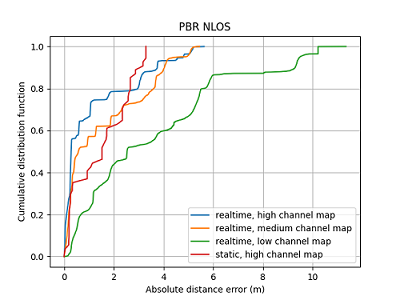
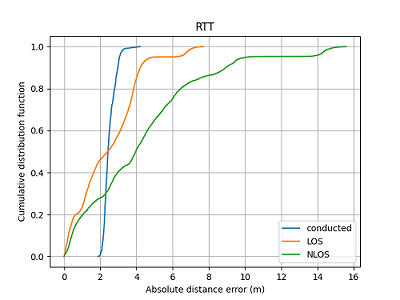
The Empirical Cumulative Distributive function (ECDF) plots show the cumulative distribution of the absolute distance errors observed in each measurement configuration for PBR and RTT measurement modes. The absolute errors are calculated for each distance estimated per measurement configuration. The steeper portions of the function indicate that a larger data set falls within that absolute error range.
X-axis is the absolute error
Y-axis is the cumulative distribution function
PBR#
LOS Environment
NLOS Environment
RTT#
LOS Environment
NLOS Environment
Accuracy Metrics using BRD4198A#
Measurement configuration | 90th percentile of abs error (m) | 95th percentile of abs error (m) | Std of the signed error (m) | Mean Signed Error (m) | |||
|---|---|---|---|---|---|---|---|
Measurement mode | Environment | RTL algorithm mode | Channel Map | ||||
PBR | Conducted | Static | High | 0.4 | 0.4 | 0.26 | -0.04 |
Real-time | High | 0.4 | 0.4 | 0.26 | -0.04 | ||
Medium | 0.4 | 0.4 | 0.26 | -0.04 | |||
Low | 0.43 | 0.43 | 0.29 | 0.03 | |||
LOS | Static | High | 0.89 | 1.21 | 0.47 | -0.1 | |
Real-time | High | 0.44 | 0.48 | 0.25 | 0.15 | ||
Medium | 0.41 | 0.45 | 0.21 | 0.13 | |||
Low | 1.45 | 2.11 | 0.71 | 0.67 | |||
NLOS | Static | High | 3.05 | 3.29 | 1.82 | -0.39 | |
Real-time | High | 3.75 | 4.79 | 1.61 | 0.97 | ||
Medium | 4.04 | 4.63 | 1.71 | 1.45 | |||
Low | 9.3 | 9.5 | 4.15 | 2.02 | |||
RTT | Conducted | Real-time | High | 2.97 | 3.06 | 0.32 | -2.51 |
LOS | 4.21 | 5.15 | 1.78 | 2.4 | |||
NLOS | 8.95 | 10.15 | 3.49 | 4.31 | |||
Note: The statistical values in the tables are derived from the combined data set of all distance estimations in each configuration. | |||||||
PBR#
Conducted Environment
LOS Environment
NLOS Environment
RTT#
Note that Channel Sounding is a new technology and software improvements are made in each software release to improve the performance of both PBR and RTT modes. See Known Issues and Limitation section for more information.
Update Rate#
The measurement update rate of channel sounding is affected by the chosen channel sounding procedure interval, number of connections, connection interval, number of antenna paths, PHY, and the number of channels used for channel sounding.
The table below provides the performance metrics of PBR update rate using the out of the box configurations of the SoC Initiator and SoC Reflector examples, for a single connection.
Reference Board | Number of Antenna Paths (NAP) | Number of Channels | Update Rate (Hz) | Calculation Time (ms) |
|---|---|---|---|---|
BRD2606A | 4 | 72 | ~3.1 | ~188.0 |
37 | ~6.6 | ~40.0 | ||
20 | ~8.9 | ~13.5 | ||
2 | 72 | ~4.7 | ~91.5 | |
37 | ~8.3 | ~22.0 | ||
20 | ~10.3 | ~7.1 | ||
1 | 72 | ~6.0 | ~45.0 | |
37 | ~8.9 | ~10.2 | ||
20 | ~10.2 | ~3.6 | ||
BRD4198A | 1 | 72 | ~6.0 | ~45.0 |
37 | ~8.9 | ~10.5 | ||
20 | ~10.2 | ~3.5 |
Note that, by default, the examples use 2M PHY for connection, a 7.5 ms connection interval and the initiator is run at 80 Mhz. Additionally, the maximum CS procedure count is set to 1, meaning that only one CS procedure is scheduled by the controller at a time, and the application restarts a new procedure sequentially. While this approach provides better flow control and stability, it is not optimal for measurement update frequency. For example, by setting the max CS procedure count to 0, the default sample application achieves a 4 Hz update rate using 4 antenna paths and 72 channels.
Reflector Current Consumption#
Similar to the update rate, the reflector's current consumption is affected by the chosen channel sounding procedure interval, number of connections, connection interval, number of antenna paths, PHY, and the number of channels used for channel sounding.
The reflector application used in these current measurements is based on the bt_cs_soc_reflector sample app, with the following configurations differing from the default settings:
TX Power set to 10 dBm
Application log disabled (APP_LOG_ENABLE = 0)
EM2 debug access disabled (SL_POWER_MANAGER_INIT_EMU_EM2_DEBUG_ENABLE = 0)
PTI disabled (rail_util_pti is excluded from the project)
The table below provides the current consumption of the reflector from one whole CS measurement cycle, where:
Max connection count = 1
Connection interval = 20 ms
CS Procedure interval = 15
Max procedure count = 0 (free running mode)
Reference Board | Number of Antenna Paths (NAP) | Number of Channels | Mean Current Consumption (mA) | Mean Energy Consumption (nAh) |
|---|---|---|---|---|
BRD2606A | 4 | 72 | ~2.3 | ~191.0 |
37 | ~1.3 | ~111.0 | ||
20 | ~0.9 | ~71.8 | ||
2 | 72 | ~1.7 | ~143.0 | |
37 | ~1.0 | ~83.7 | ||
20 | ~0.7 | ~59.5 | ||
1 | 72 | ~1.4 | ~117.0 | |
37 | ~0.9 | ~72.0 | ||
20 | ~0.6 | ~50.6 | ||
BRD4198A | 1 | 72 | ~1.2 | ~114.0 |
37 | ~0.8 | ~66.7 | ||
20 | ~0.6 | ~48.0 |
Current Profile#
The current profile of the reflector during a CS measurement cycle can be divided into 5 sections, where the arrow-markers (1 and 2) specify the start and end of one whole CS measurement cycle:
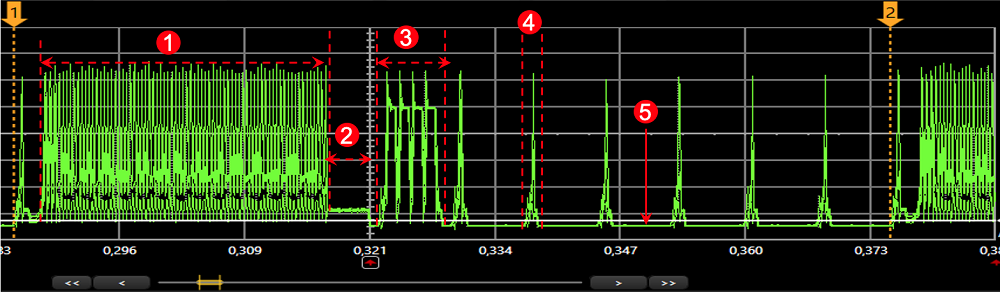
CS Procedure
IQ Data processing
IQ Data transmission to the initiator
Empty PDU connection events
EM2 Sleep
EM2 Sleep current#
Reference Board | EM2 Sleep Current (uA) |
|---|---|
BRD2606A | ~6.6* |
BRD4198A | ~4.2 |
* BRD2606A is known to have a higher EM2 current consumption compared to BRD4198A. This is due to an inverter that is required for the antenna switching circuit.
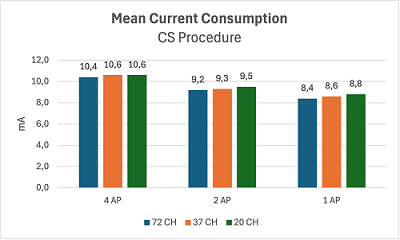
Reflector Current Consumption vs Number of Antenna Paths and Channels#
The following figures visualize how the number of channels and antenna paths affect the current and energy consumption for specific sections of the CS measurement cycle:
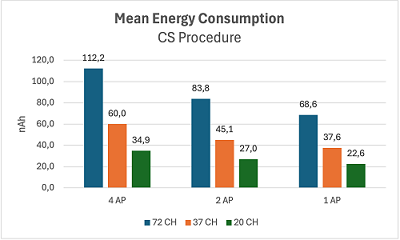
CS Procedure#
IQ Data Processing#
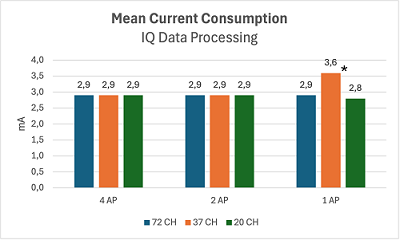
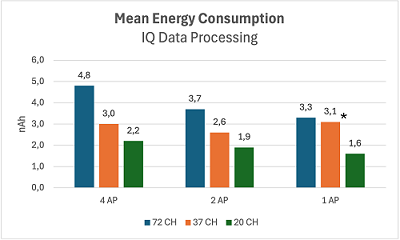
* Empty PDU interrupting the data processing.
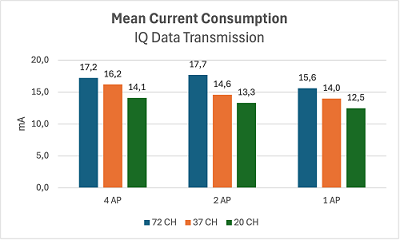
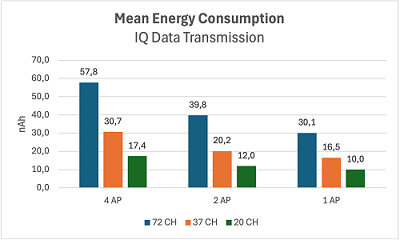
IQ Data Transmission#
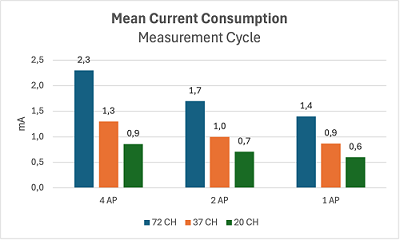
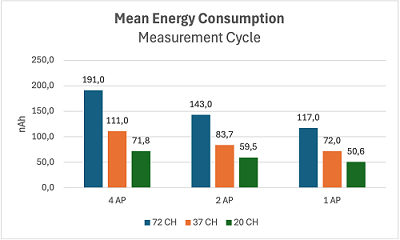
CS Measurement Cycle#
Optimizing Measurement Accuracy#
The antenna diversity of a device plays a significant role in achieving accurate distance estimations. To learn more about the antenna guidelines to achieve good polarization diversity for accurate and reliable Channel Sounding, see AN1493.