Using the Debuggers#
Simplicity Studio® 5 (SSv5) supports two debuggers:
For 32-bit device users, SSv5 includes support for a GNU Debugger (GDB) client and SEGGER's GDB server. The GNU Debugger (GDB) enables thread-aware debugging, and offers features such as unlimited flash breakpoints. This is the default debugger
The classic Simplicity Studio debugger is a full featured debugger that offers the ability to step through code, set breakpoints, examine memory, variables and registers.
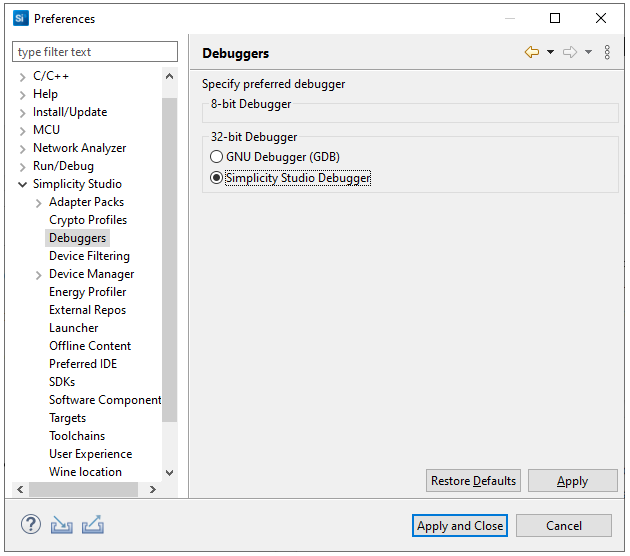
To change from the GNU debugger, on the toolbar click Preferences and select Simplicity Studio > Debuggers. Select Simplicity Studio Debugger and click Apply and Close.
Silicon Labs supplies the debug models for each of their devices so that all of the registers can be examined and modified using either debugger.
The debugger runs in the Debug perspective. The debug perspective can be opened in a variety of ways, but most commonly by clicking the Debug button in the Simplicity IDE perspective once a project has reached a point where it will build and link correctly.
![]()
![]()
If a debug session has never been started before, a warning that a debug configuration does not exist might appear. Click the down arrow next to the debug icon, select Debug as... and then select either Silicon Labs ARM Program for 32-bit parts or Silicon Labs 8051 Program for EFM8 and C8051 parts.
If a single debug adapter is available, SSv5 automatically downloads the code to that device. If more than one debug adapter is available, SSv5 will prompt to select one.
With the Simplicity Studio debugger you can also save a snapshot of register values on a device, which can be used to compare the states of two different devices, or the state of the device at two different points in time.
Debug Perspective#
The Debug Perspective by default is composed of the editor (A) and three tabbed view panes.
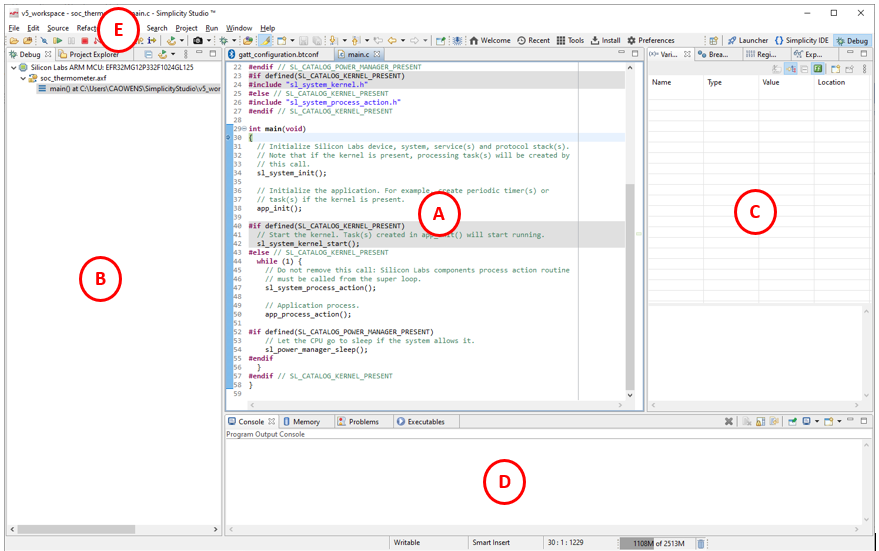
The Debug view (B) shows the call stack and call hierarchy that can help debug and find where functions are called. The Project Explorer view is available as a tab.
The right pane (C) and the bottom pane (D) contains tabbed views into data and consoles. These vary between the two debuggers. Depending on your actions, additional views may open in either the right or bottom pane.
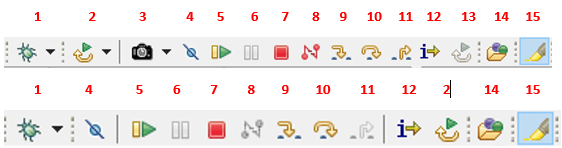
Buttons in the Debug perspective toolbar (E) for the Simplicity Studio debugger and the GDB are shown below. The toolbar is similar for both debuggers.
Number | Command | Description |
|---|---|---|
1 | Debug | Starts a new debug session. An active debug session must be disconnected before starting a new session using the same debug adapter. |
2 | Reset the device | Performs a hardware reset. |
3 | Create snapshot | (Simplicity Studio Debugger only) Creates a snapshot when clicked (default). Drop down the menu to select Create when Stopped or Create at Breakpoints. See About Snapshots for more information. |
4 | Skip | Skips all breakpoints. |
5 | Resume | Runs the application after reset or hitting a breakpoint. |
6 | Suspend | Halts the application. |
7 | Terminate | Terminates the session. |
8 | Disconnect | (Simplicity Studio Debugger only, gray for GDB) Terminates the session and disconnects the debug adapter. SSv5 automatically switches back to the Simplicity IDE perspective. |
9 | Step into | Single steps into the first line of a function. |
10 | Step over | Single steps over a function, executing the entire function. |
11 | Step return | Steps out of a function, executing the rest of the function. |
12 | Instruction Stepping Mode | Toggles assembly single stepping. When enabled, single stepping executes a single assembly instruction at a time. If clicked, opens a Disassembly view in the right pane that shows the assembly code corresponding to the source code at the current line of execution. |
13 | Restart | (Simplicity Studio debugger only) Restarts a process or target without terminating and relaunching |
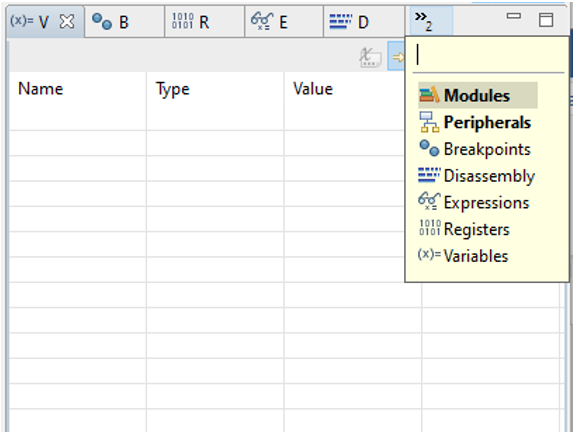
14 | Open Element | Opens a dialog where you can see the qualified name and location for an element. Start typing to bring up a list of matching elements. |
15 | Toggle Mark Occurrences | Turns the mark occurrences function on and off. |
A debug adapter can only support a single debug session at a time. An active debug session must be disconnected before code can be recompiled and a new debug session started.
To set a breakpoint, double-click in the blue bar to the left of the code editor or right-click on a line of code and select Add Breakpoint.
Simplicity Studio Debugger#
This section describe the various views in the Simplicity Studio debugger.
The Variables view shows the values of variables.
The Breakpoints view provides functionality to manage breakpoints.
The Registers view displays and allows you to change register contents. Registers with bitfields are split into individual fields with the enumeration value decoded. Registers that have changed between breakpoints are highlighted in yellow.
The Expressions view allows you to add and change expressions. If possible, SSv5 evaluates the expression and displays its current value when the application is halted. If an expression is out of scope, SSv5 cannot evaluate the expression until the application is halted in a section of code where the expression is in scope.
The Disassembly view provides an interleaved display of the original source code with the assembler instructions use to execute the source code.
The Memory view in the bottom pane displays the contents of the CODE, RAM, and XRAM memory. To experiment, in the Monitors menu click +. Select Enter memory space and address, select a memory space such as CORE and enter an address to view, such as 0x0000. Click OK. A memory monitor is added to the Memory view that displays the contents of the space starting at the address you provided.
GDB#
This section describe the various views in the GNU Debugger.
The Variables view shows the values of variables.
The Breakpoints view provides functionality to manage breakpoints.
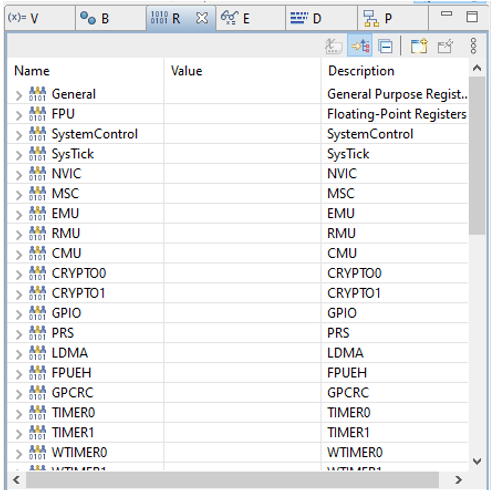
The Registers view displays and allows you to change general register contents. Registers that have changed between breakpoints are highlighted in yellow. To see other registers, select a peripheral in the Peripherals view.
The Expressions view allows you to add and change expressions. If possible, SSv5 evaluates the expression and displays its current value when the application is halted. If an expression is out of scope, SSv5 cannot evaluate the expression until the application is halted in a section of code where the expression is in scope.
The Disassembly view provides an interleaved display of the original source code with the assembler instructions use to execute the source code.
The Peripherals view, after a short delay, shows peripherals with bitfields that are split into individual fields shown as a hex value. Their values cannot be modified. When a peripheral is selected, the Memory tab in the bottom pane shows associated registers and their values.
The Memory view in the bottom pane displays the contents of the CODE, RAM, and XRAM memory. To experiment, in the Monitors menu click + and enter an address or an expression to monitor. A monitor for that address or expression is added.
The bottom pane also includes a Debugger Console, with output specific to GDB Debug SEGGER J-Link Debugging.
About Snapshots#
The Snapshot feature is available in the Simplicity Studio debugger only. A snapshot saves the values of the registers on a device at a particular point in time. This feature is useful when comparing the states of two systems next to each other or looking at the state of the hardware at separate points in time.
Once you take a snapshot, the Snapshot Album view opens in the bottom view pane.
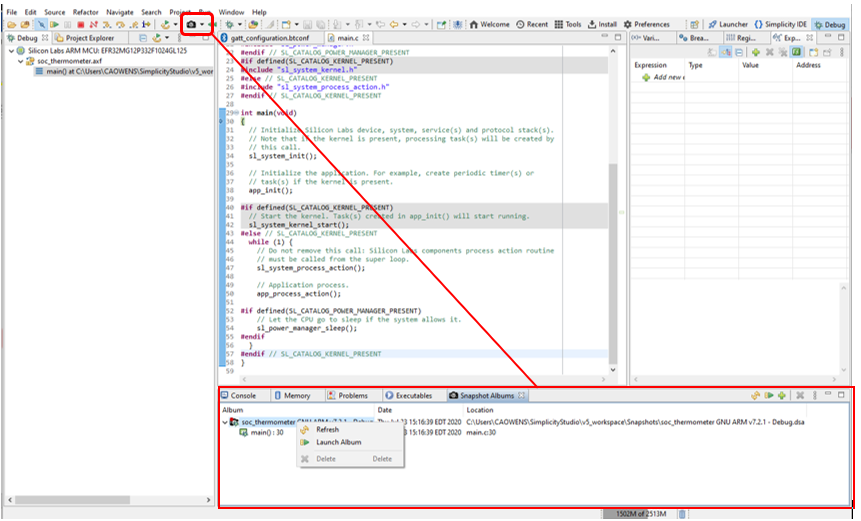
In the Debug perspective, if you do not see the Snapshot Album view, select Window > Show View > Other > Snapshot Albums.
To view a snapshot, right-click a snapshot in the list and select Launch Snapshot. This adds a debug session in the Debug window as it was at the time of the snapshot, with a Snapshot label at the start of the debug configuration. However, it is not an active debug session on hardware. To switch back to a debug session on hardware, select the Silicon Labs ARM debug configuration in the Debug window if a hardware debug session was active or else select Run > Debug if a session is not active.