Network Analyzer Interface#
The Network Analyzer Interface is presented as a Network Analyzer perspective.


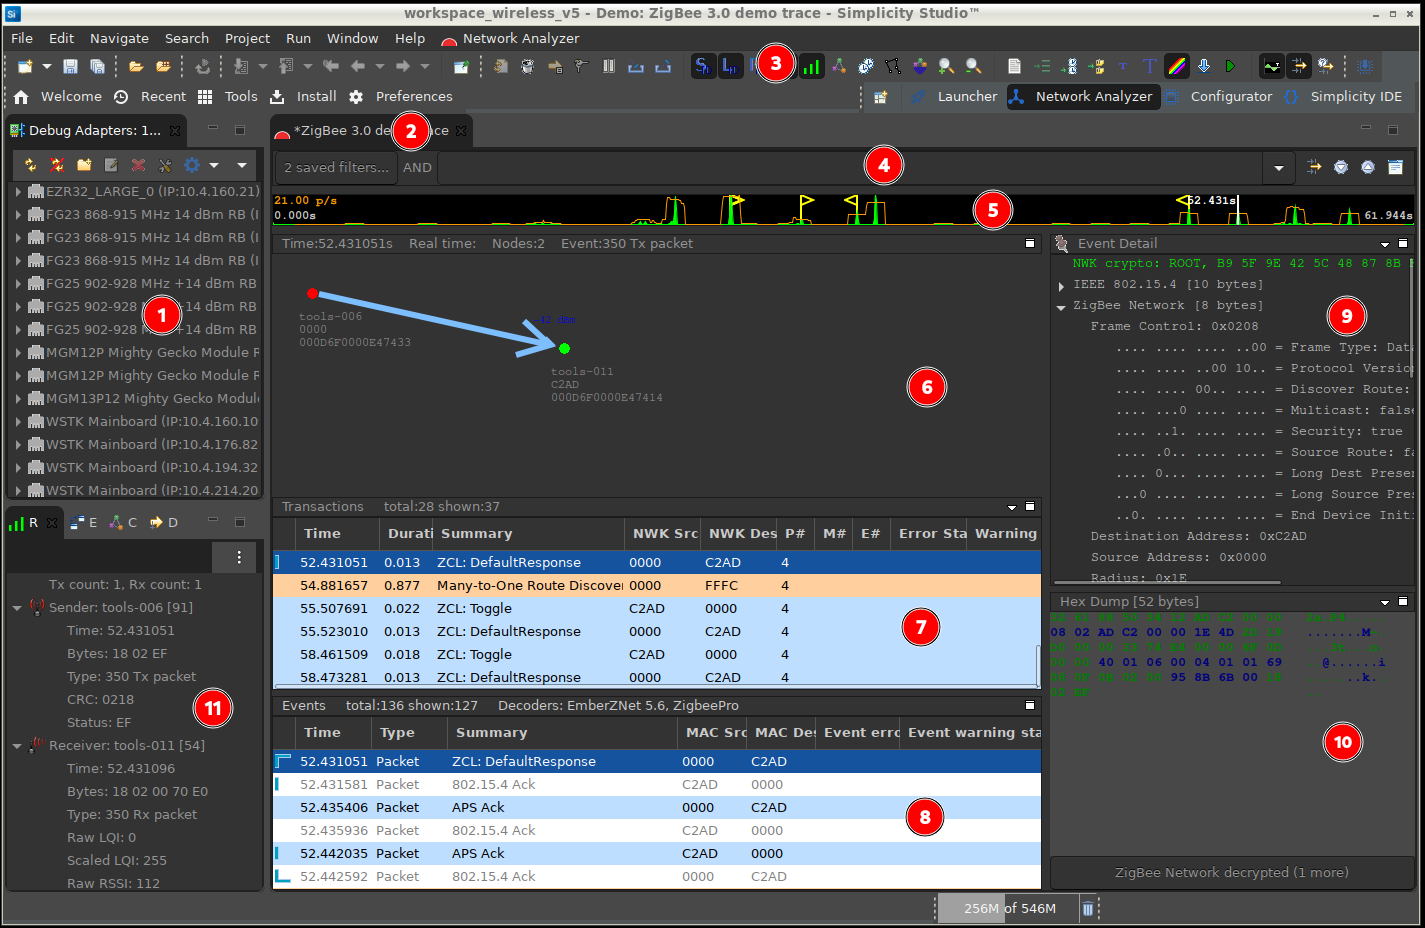
The Network Analyzer perspective contains the following work areas:
Debug Adapters view (1) - Lists all debug adapters and their connected hardware that are accessible to Network Analyzer. See Simplicity IDE User Interface Review
Capture sessions (2) - Contain data captured from a node or set of nodes, with each session shown as a tab, and a live session shown in a *Live tab.
Editor Panes - Display the data of a selected capture session in the editor area with up to five different panes. Network Analyzer supports two types of capture sessions:
Live sessions - Display data as it is captured; the display is continuously refreshed as new data arrives.
Saved sessions - Contain captured data that has been saved to permanent storage in a named .isd file. You can load a saved session and play it back at any time.
Toolbar and Menu (3) and Supporting Views (11) - Provide options to control data capture and display.
A filter Bar (4) allows you to enter data filters, as described in Filtering Captured Data.
A Timeline Bar (5) displays the statistics of the traffic over time, as discussed in Viewing Data in editors
The Views area (11) displays additional views in a tabbed interface.
Editor Panes#
Editor panes provide different aspects of capture session data. Up to five editor panes can be open at any one time:
Map (6) provides a graphical view of the network, where nodes are displayed with their network identifiers. The map also displays network activity.
Transactions (7) displays high-level node interactions that might comprise multiple events.
Events (8) displays information about all events transmitted and received during a capture session.
Event Detail (9) displays the decoded contents of the event that is currently selected in the Events pane.
Hex Dump (10) displays the data of the selected event in raw bytes. Network Analyzer highlights bytes that map to the data currently selected in the Event Detail pane. It shows multiple "layers", so if the packet is decrypted, the "raw" layer shows encrypted data, but the higher-level layers show this data progressively decrypted.
Using the editor is discussed in more detail in Viewing Data in Editors
Toolbar and Menu
The Network Analyzer Toolbar and Menu provides shortcuts to frequently-used features. Selections and controls are either enabled or disabled depending on what the user is doing.


On the toolbar, hover over any control to see a short description.
The following describes the controls in order from left to right. Where the function is also available on the Network Analyzer menu, it is so noted.


Network Analyzer toolbar controls are added to the controls already present in the Simplicity IDE. See About the Simplicity IDE for more information. This section provides Network Analyzer-specific information, if any, about those controls.
Open File - Opens a file dialog from which the user may select one of the applicable extensions, such as .isd, or .log. Equivalent to File > Open File (Network Analyzer Trace, Energy Profiler, etc.).
Open Capture Directory - Opens the folder to which an output file has previously been saved. Equivalent to File > Other Network Analyzer Actions > Open Network Analyzer Capture Directory.
Restart a Process - Simplicity IDE function.
New - Creates a new project or other file. Equivalent to File > Other Network Analyzer Functions > New Live Capture Session.
Save (Ctrl+S) - Saves any changes to the currently opened file to disk. If the file has never been saved before, the user can say where they want it saved and what extension they want to give it. If the file was previously saved, Network Analyzer saves over the old file.
Save All (Ctrl+Shift+S) - Saves all files that have been edited, including any files open elsewhere in Simplicity Studio. As with Save, the user has the option to indicate where and how to save any files that have never been saved.
Next Annotation and Previous Annotation - Simplicity IDE function.
Last Edit Location - Simplicity IDE function.
Back and Forward - Simplicity IDE function.
Pin Editor - Simplicity IDE function.
Reopen Editor - Closes and reopens the editor. When you have changed or added new decryption keys to the preferences, it is useful to be able to reopen the file and run it through the decryptors and decoders again.
Clear Events - Clears the editor of all events. This is useful when you are capturing on a network and are waiting for some set of events to occur but do not want to keep everything else around.
Live Capture Options - Opens the Capture Options dialog, used to tailor the condition under which events will be captured.
View and Modify Security Keys (Toolbar and Menu) - Opens the Active live capture keys dialog, where you can add security keys to be used during the current capture in progress. Any keys that are added will also be added to the list of security keys in the Network Analyzer preferences.
Pause Stream (Toolbar and Menu) - Pauses a capture without stopping it. This is useful to stop capturing for period of time, and then later continue as if nothing happened. Live events occurring during a pause are not retrievable.
Import - Select files to import and the type of import. Additional fields allow you to specify characteristics of the import. Equivalent to File > Network Analyzer Import.
Export - Select the exporter to use, and the output file name and location. Other options depend on the exporter. Equivalent to File > Network Analyzer Export.


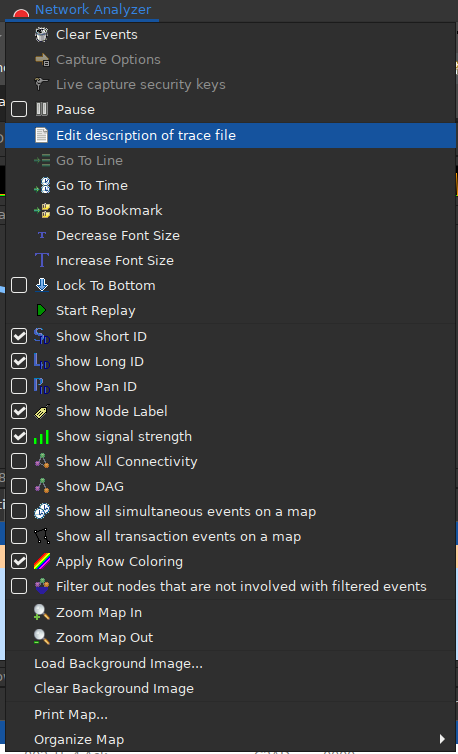
Show Short Id (Toolbar and Menu) - Displays a node's shortId on the map, if one is known for the currently selected time.
Show Long Id (Toolbar and Menu) - Displays a node's long Id (64 bit identifier) on the map, if one is known.
Show Pan Id (Toolbar and Menu) - Displays the pan Id on the map, if one is know for the currently selected time.
Show Node Label (Toolbar and Menu) - Displays the node's label. If the node is connected to Network Analyzer over the backchannel, this value will be the host name of the adapter connected to the node.
Show Signal Strength (Toolbar and Menu)
Show All Connectivity (Toolbar and Menu) - Shows the quality of connections between nodes on the map.
Show all Simultaneous Events on Map (Toolbar and Menu) - During periods of heavy traffic, several simultaneous transactions may overlap. When enabled, the map shows all traffic. When it is disabled (default), the map shows only the traffic related to the currently selected transaction.
Show All Transactions on Map (Toolbar and Menu) - When enabled, all transactions that overlap with the currently selected one are shown on the map.
Filter Nodes (Toolbar and Menu) - Filters out nodes that are not involved with the filtered event.
Map Zoom In and Map Zoom Out (Toolbar and Menu) - Increases and decreases the size of the map in the map page. Zooming in can be useful if you are looking at a very large network where a large number of nodes are positioned very close together.
Edit Trace File Description (Toolbar and Menu) - Each saved Network Analyzer trace file contains a description. The description can be used to store information that is important to the trace but may not be included by default. Generally the description is used to provide context for the trace and any other information that may be of help to the viewer. A checkbox on the dialog determines if the description is shown when the file is loaded.
Go To Line (Toolbar and Menu) - Moves the event cursor directly to the event number entered. This is only enabled if the Stream preference "Show event numbers" is selected. To turn this feature on go to: Window > Preferences > Network Analyzer > Capture Configuration > Show event numbers.
Go to Time (Toolbar and Menu) - Moves the cursor to the transaction and event that match or immediately follow the specified time.
Go To Bookmark (Toolbar and Menu) - Moves the event or transaction cursor to the bookmark selected in the bookmark dialog. Assign bookmarks to events or transactions by right-clicking the event or transaction and selecting Add Bookmark.
Decrease Font Size and Increase Font Size (Toolbar and Menu) - Decreases and increases the size of the font used in the Event, Transaction and Detail panes.
Apply Row Coloring (Toolbar and Menu) - Turns coloring on and off in the Transaction and Event panes. Row colors are applied based on the pre-defined filters included in the Filter Manager.
Lock To Bottom (Toolbar and Menu) - Locks the event cursor to the bottom of the Event pane. During a live capture, this causes the Map and Details panes to always show the latest event. To remove the lock, select any event or transaction during a live session, which causes a view to scroll as the events are captured.
Start Replay (Toolbar and Menu) - Begins scrolling forward through events from the current event selected. If no event is selected, the scrolling will begin from the start of the current trace file. Once replay has started, converts to a Stop Replay function.
Timeline Bar - Toggles the timeline shown at the top of the currently opened Stream Editor.
Toggle Filter Bar - Toggles the Filter Bar at the top of the currently opened Stream Editor.
Show Filter Manager View - Toggles the Filter Manager View.
The following are selections on the Network Analyzer menu that are not on the toolbar:
Show DAG - Shows the connectivity DAG from the captured neighbor DAG events. Applies only in cases when the networking stack is instrumented with the correct abilities.
Load Background Image and Clear Background Image - Loads and clears a background image on the map pane. Also available on the Map pane context menu.
Print map - Prints the nodes as currently displayed in the map pane.
Organize map - Organizes the nodes on the map into a Default, Random, Square, or Hexagonal placement. Also available on the Map pane context menu.
Other Views#
Network Analyzer provides access to a wide range of functionality through the use of views. The views are all accessible in the menu Window > Show View. For a complete listing of all available Views, select Window > Show View > Other....
The following lists some of the most helpful views. The first four are open in the Views area by default.
Radio Info - The Radio Info View shows data captured for each event, as discussed in Radio Info View.
Event Difference - Event Difference view is a helper view that displays the specific differences between two packets, as discussed in Event Difference View.
Connectivity view - (15.4 captures only) Displays a graph of network connectivity, using the neighbor information from the nodes.
Data capture view
Adapters - (deprecated)
Application Controller view - (deprecated)
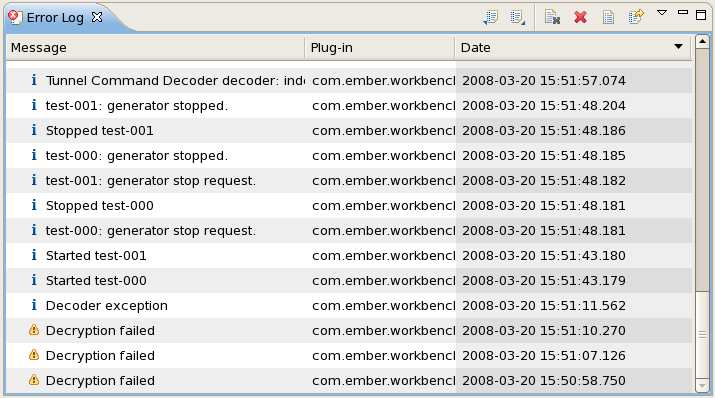
Error Log - Decoder, decryption, and other types of errors are displayed in a tabular format in the Error Log View. Each error is shown in a single row with its summary message, the plugin or component that reported the error, and the date and time the error was encountered. To view detailed information about the error, double-click it. The error will be displayed in an Event Details dialog that includes the date, severity, message, and, if available, stack trace. The navigation at the top of the view allows you to perform basic functions on the Error log itself, including Export, Import, Clear, Delete, Open, and Restore.


Expression Manager - Also known as the Filter Manager, this tool is used to compose and edit custom filtering expressions.
Progress - The Progress View shows the progress of user actions. Actions that take a long time to execute may be managed within the Progress View. For example, the application upload action can take several seconds. The Progress View provides a user interface for managing this action. If you wish to stop an action, you may do so in the Progress View.
Sample Application Wizard - (deprecated)
Other views of interest are:
Event Detail - Event details are normally shown in the EventDetail Pane within the Stream Editor. If you want to see the event details in a separate window, you can open the Event Detail View. This view shows the details for the currently selected Event in the same format as the Event Detail Pane, but in a view that you can pull outside of Network Analyzer and resize to your liking.
Hex Dump - Similar to event details, the hex dump information is shown the Hex Dump Pane within the Stream Editor. If you want to see the hex dump in a separate window, you can open the Hex Dump View. This view shows the hex dump of the currently selected Event in the same format as the Hex Dump Pane, but in a view that you can pull outside of Network Analyzer and resize to your liking.
Search - Search data is displayed in the Search Pane within the Large File Editor. However, as with the Event Details and Hex Dump Panes, you may wish to see this data in a separate view. The Search View allows you to view search results in a window that you can pull outside of Network Analyzer and resize to your liking.
Shell - The Shell View provides command line access to the scripting capabilities of Network Analyzer. For a list of all commands available within the shell, simply enter help at the command line.
