Capturing Traffic Using SDM UI#
This guide explains how to capture network traffic using the Simplicity Device Manager (SDM) user interface (UI) with Wireshark.
Prerequisites#
Before starting, make sure that:
The SDM server is running.
Wireshark is properly set up with SDM. For more information, see the Getting Started guide.
Capturing from a Single Adapter#
Step 1. View Available Adapters#
Navigate to the "Devices" view in SDM or check the adapters listed below the navigation menu.
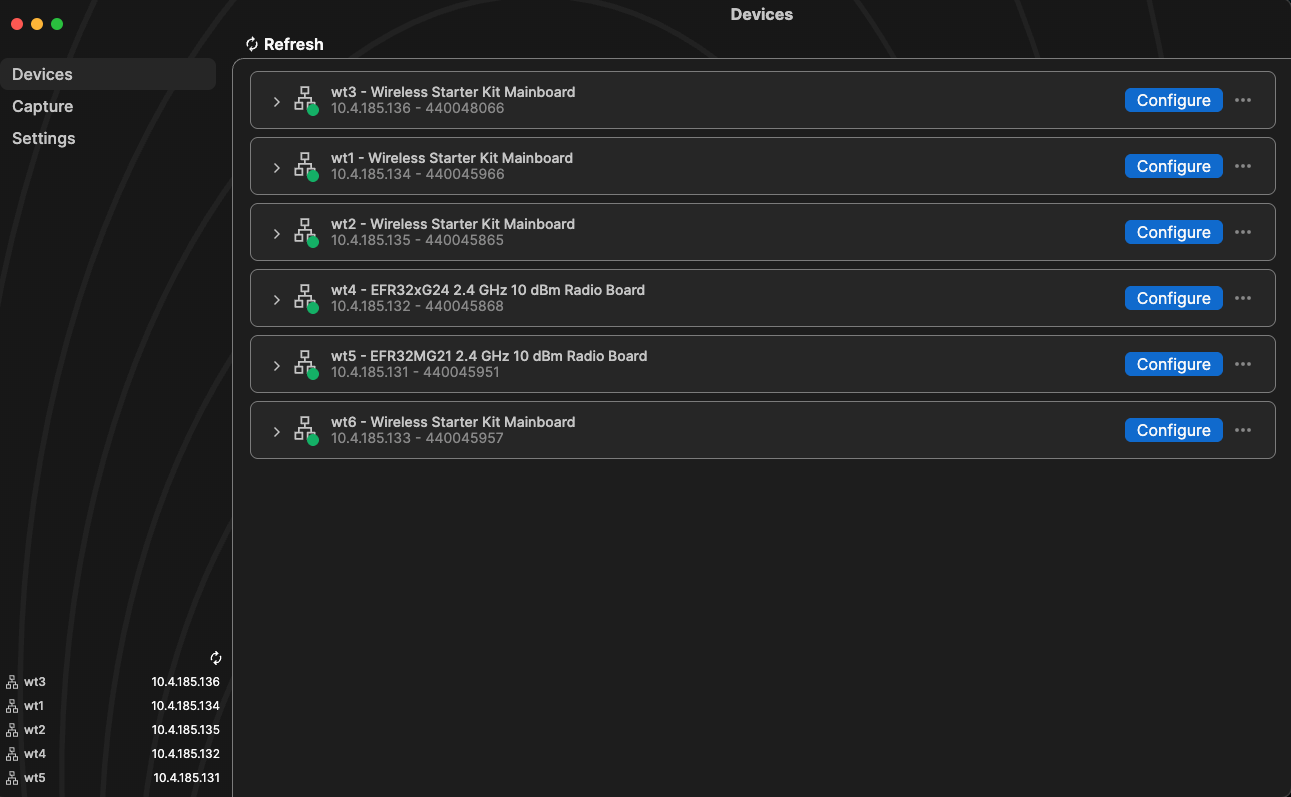
Note: If you don't see the expected adapters, see the FAQ section for subnet configuration instructions.
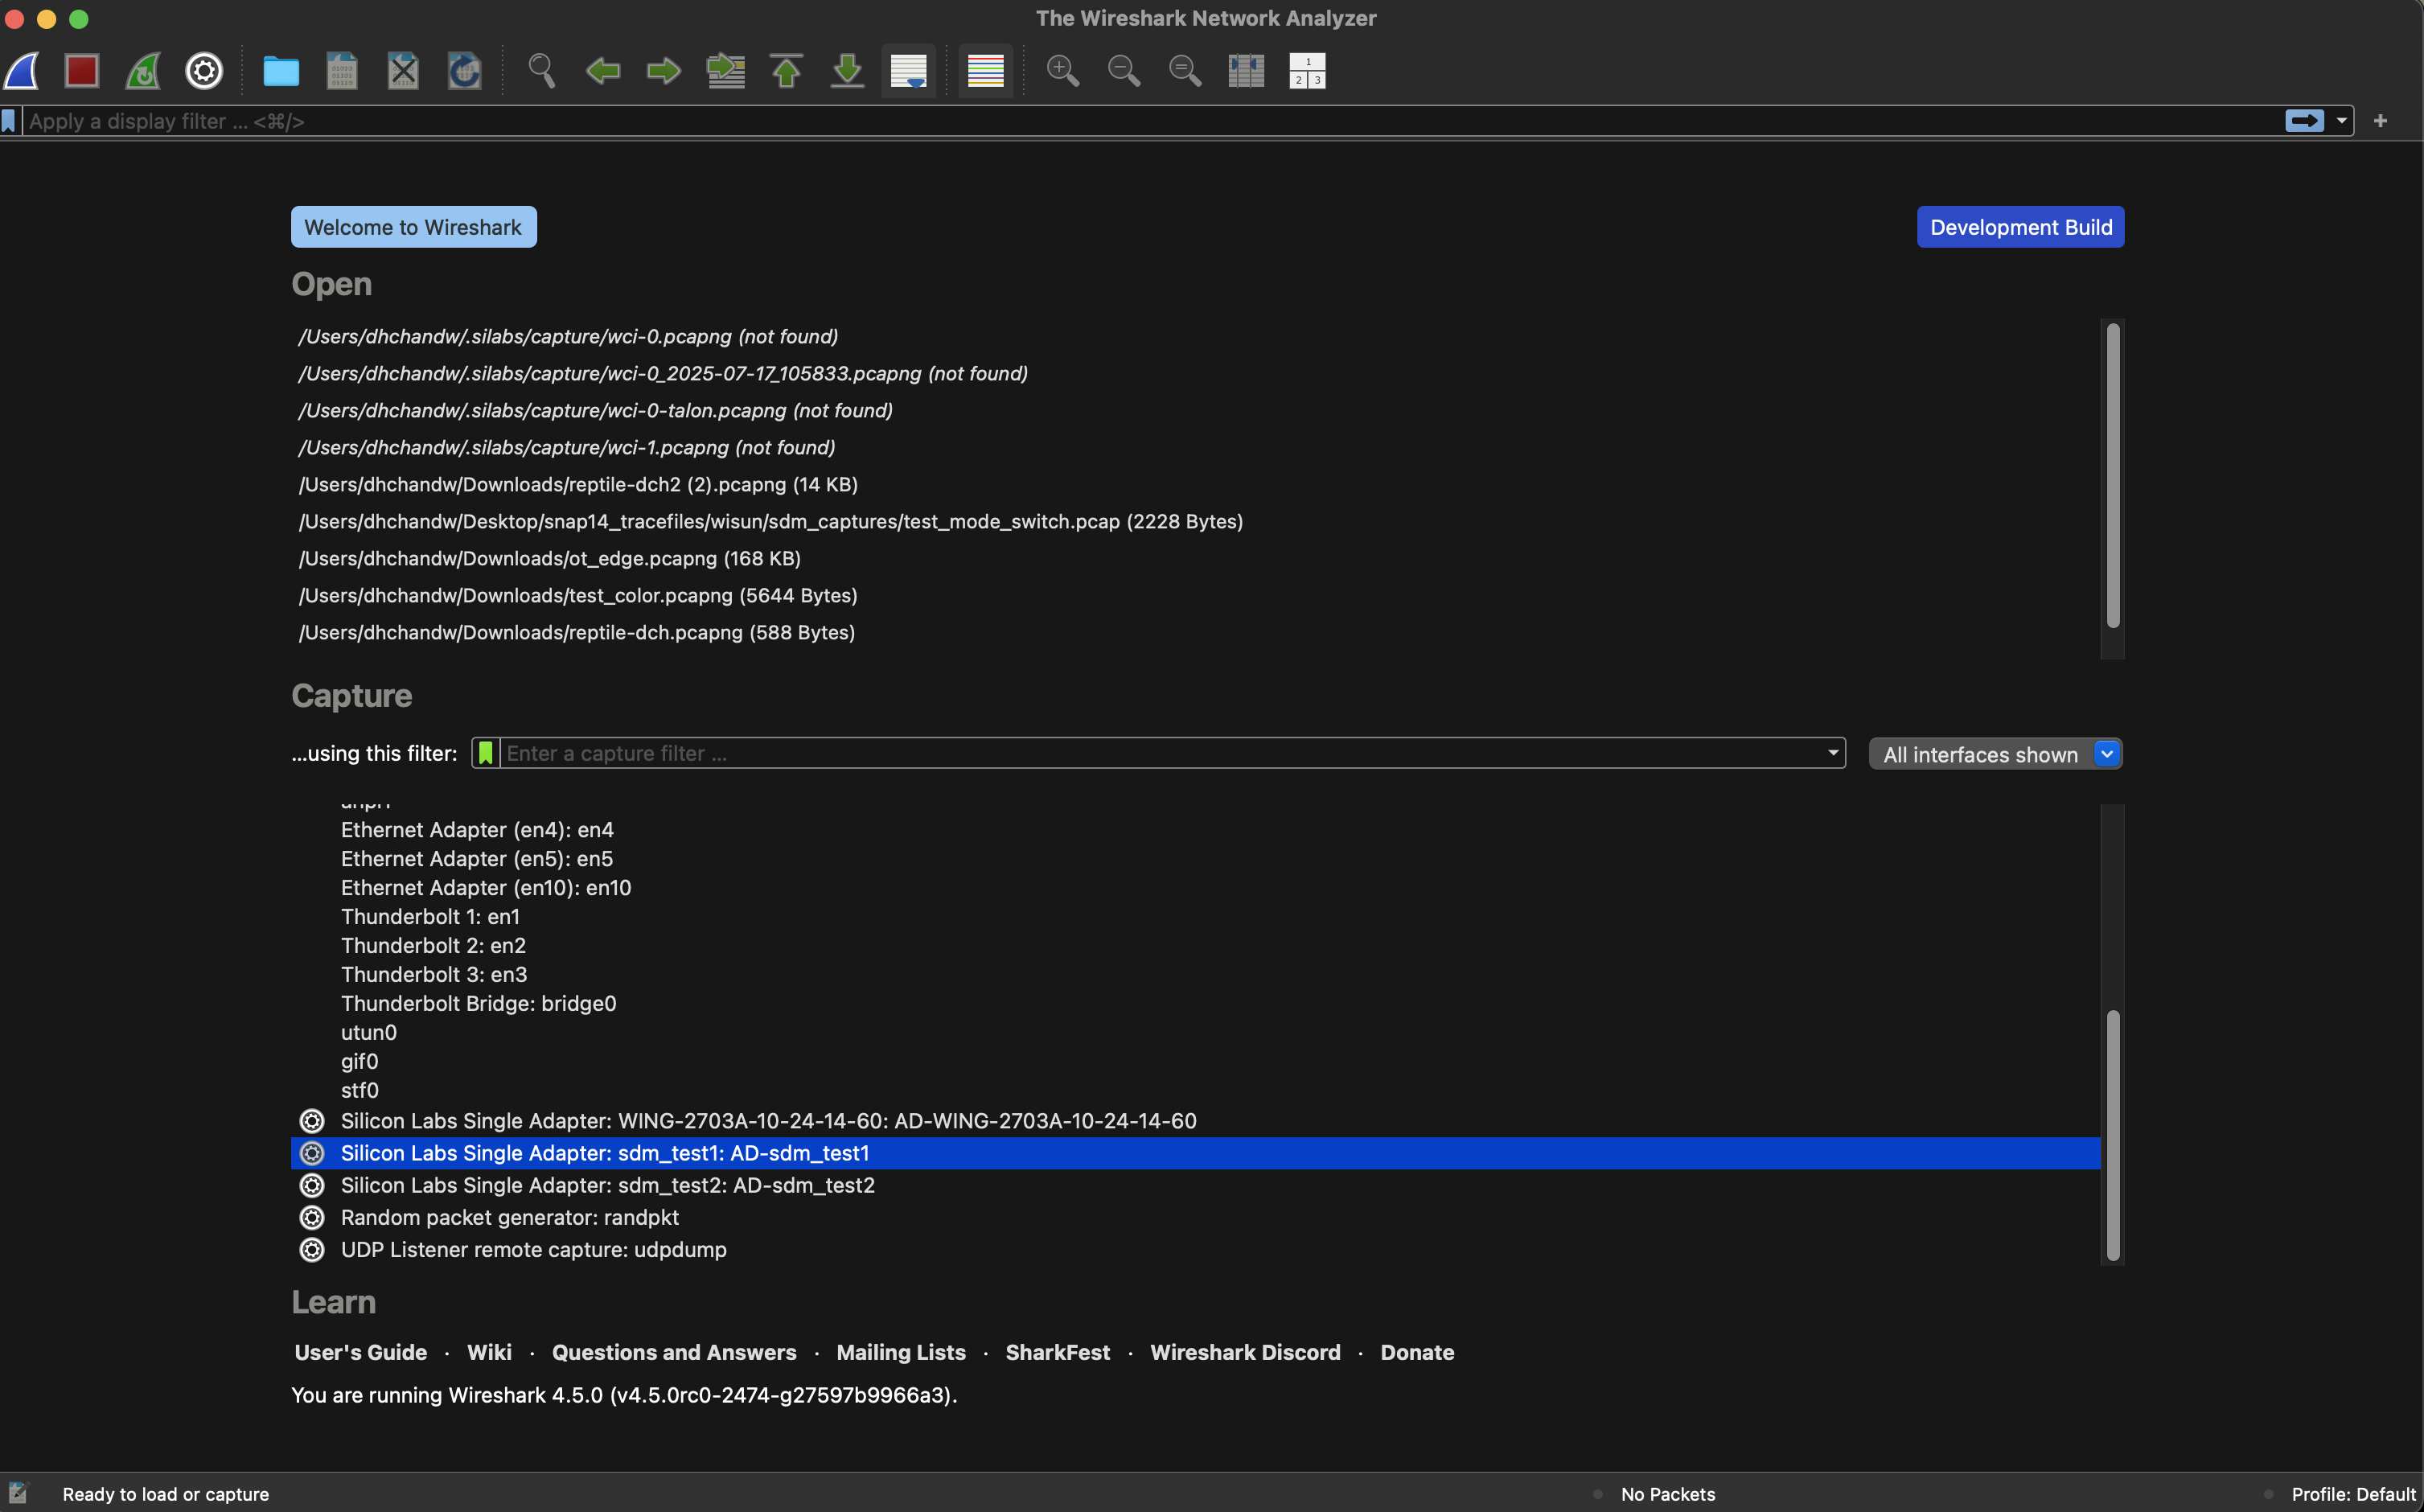
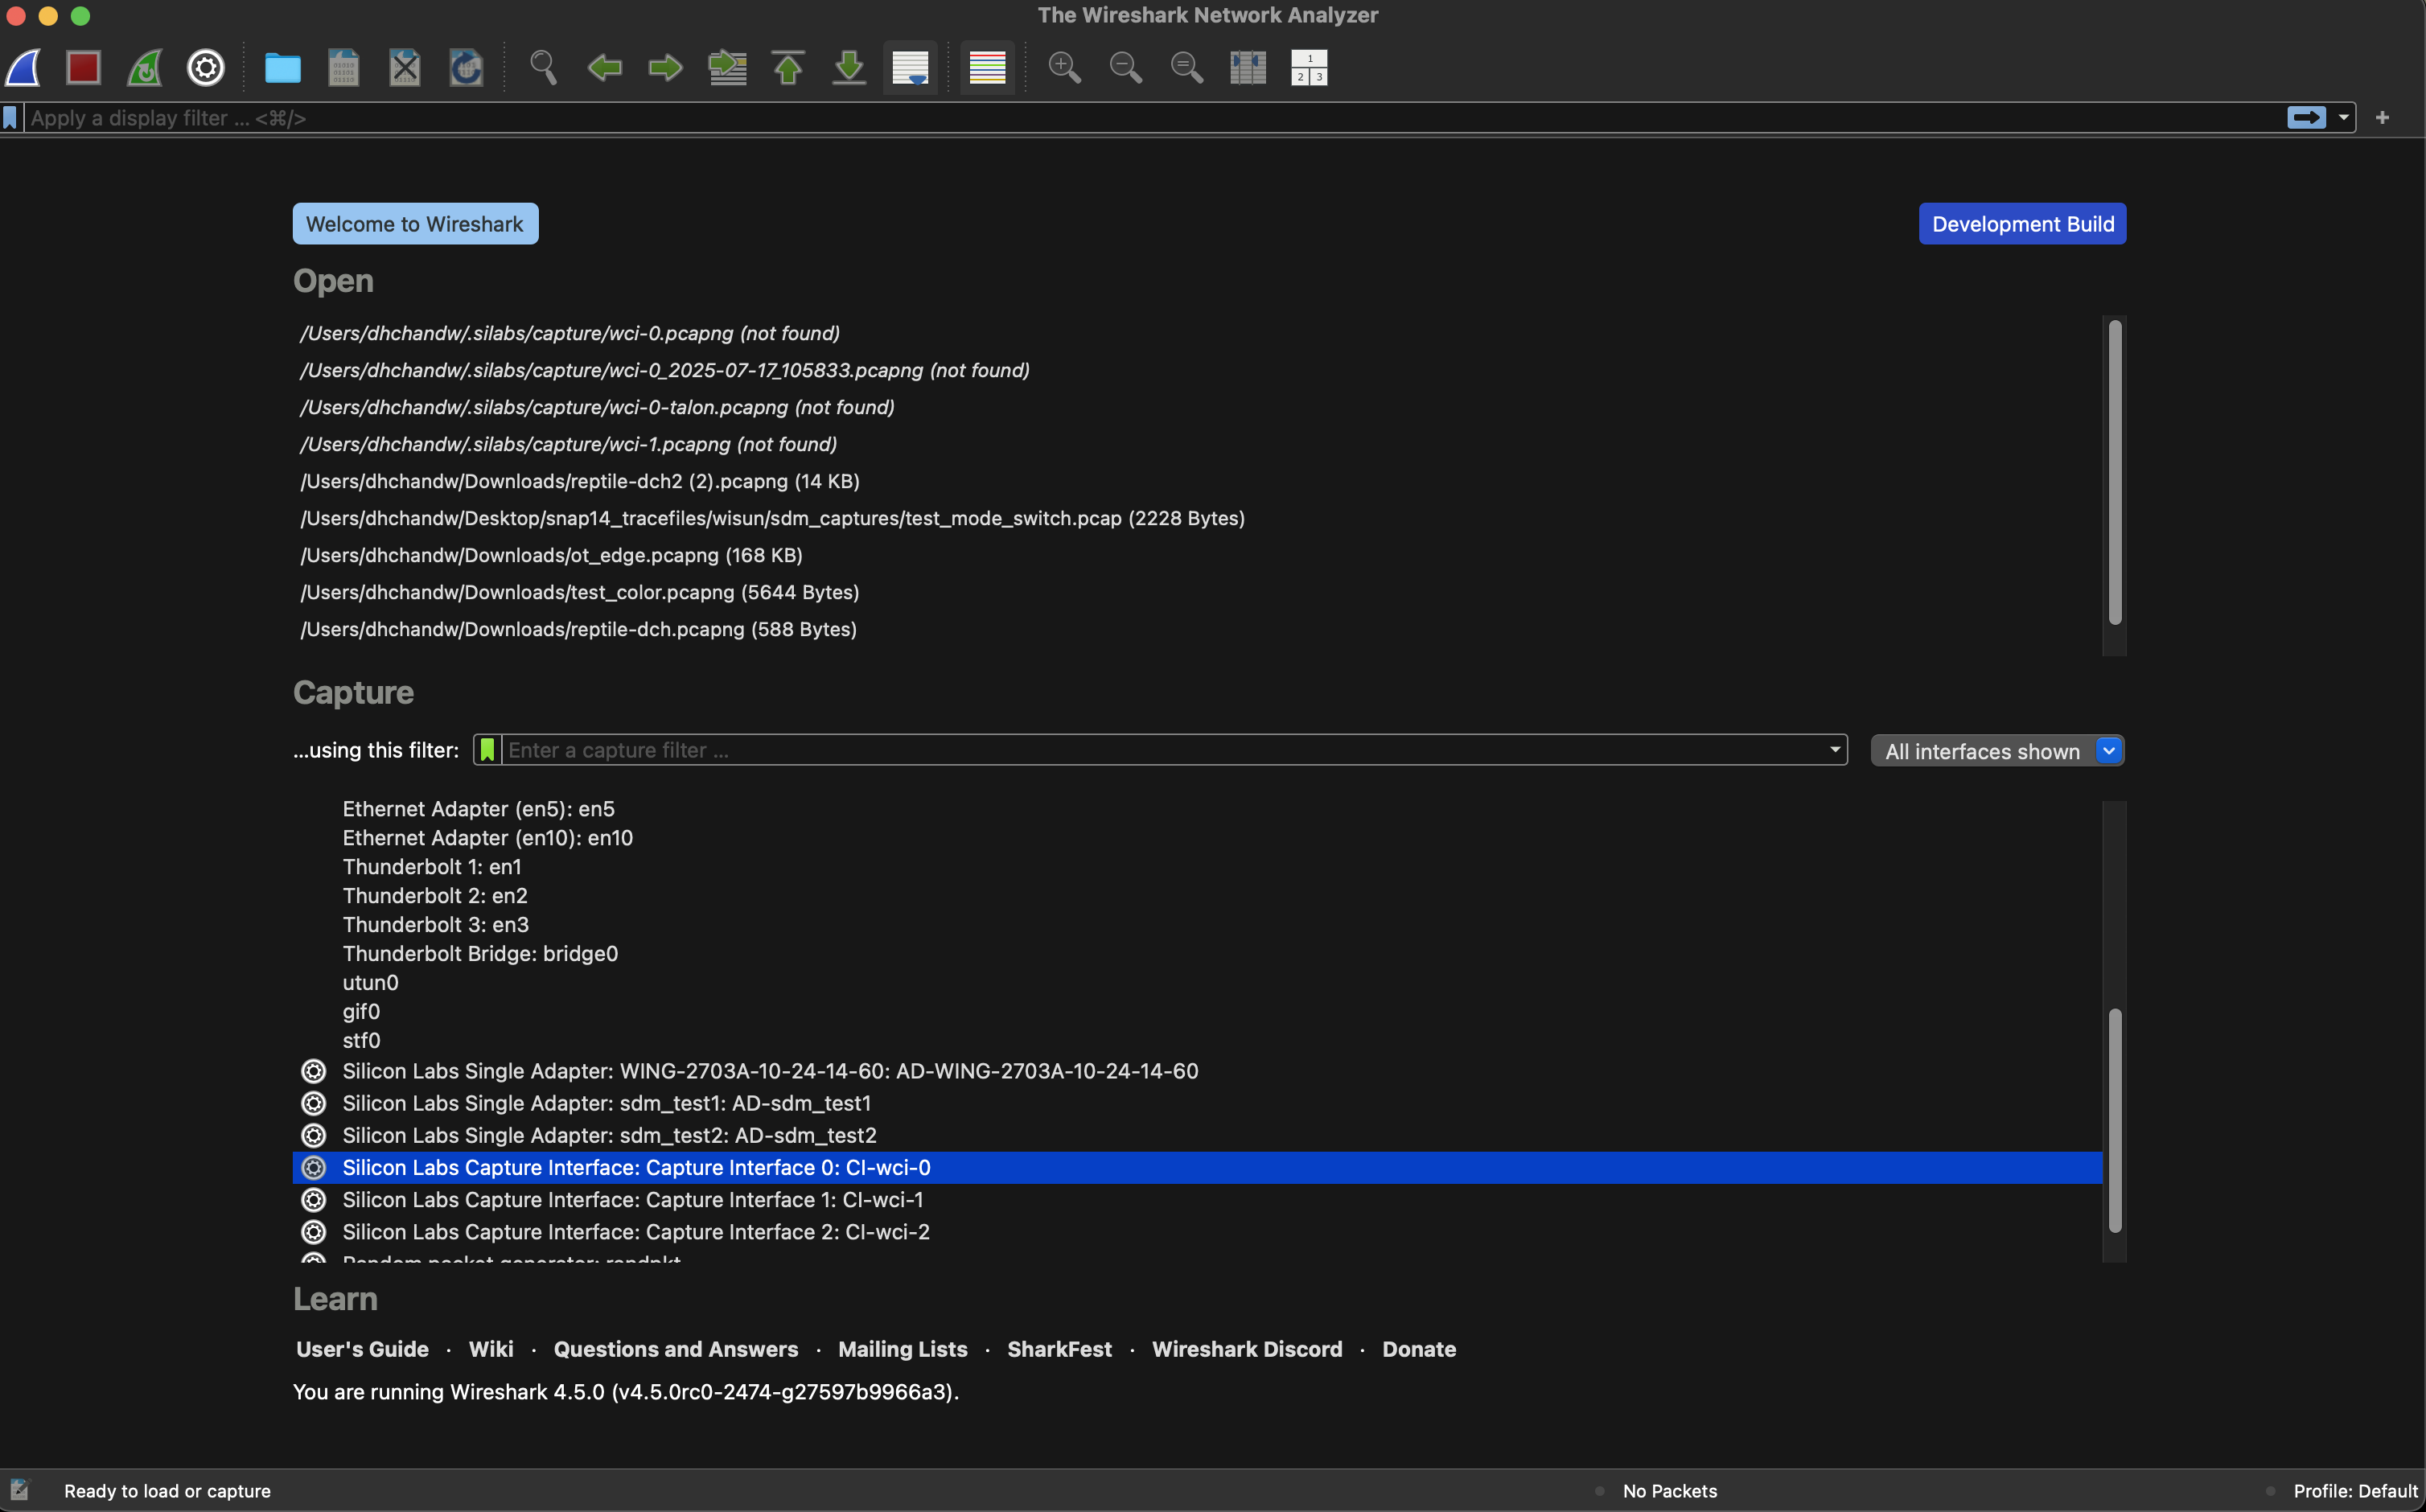
Step 2. Launch Wireshark#
Open Wireshark through SDM. The adapters listed in the Devices view should appear as available capture interfaces.
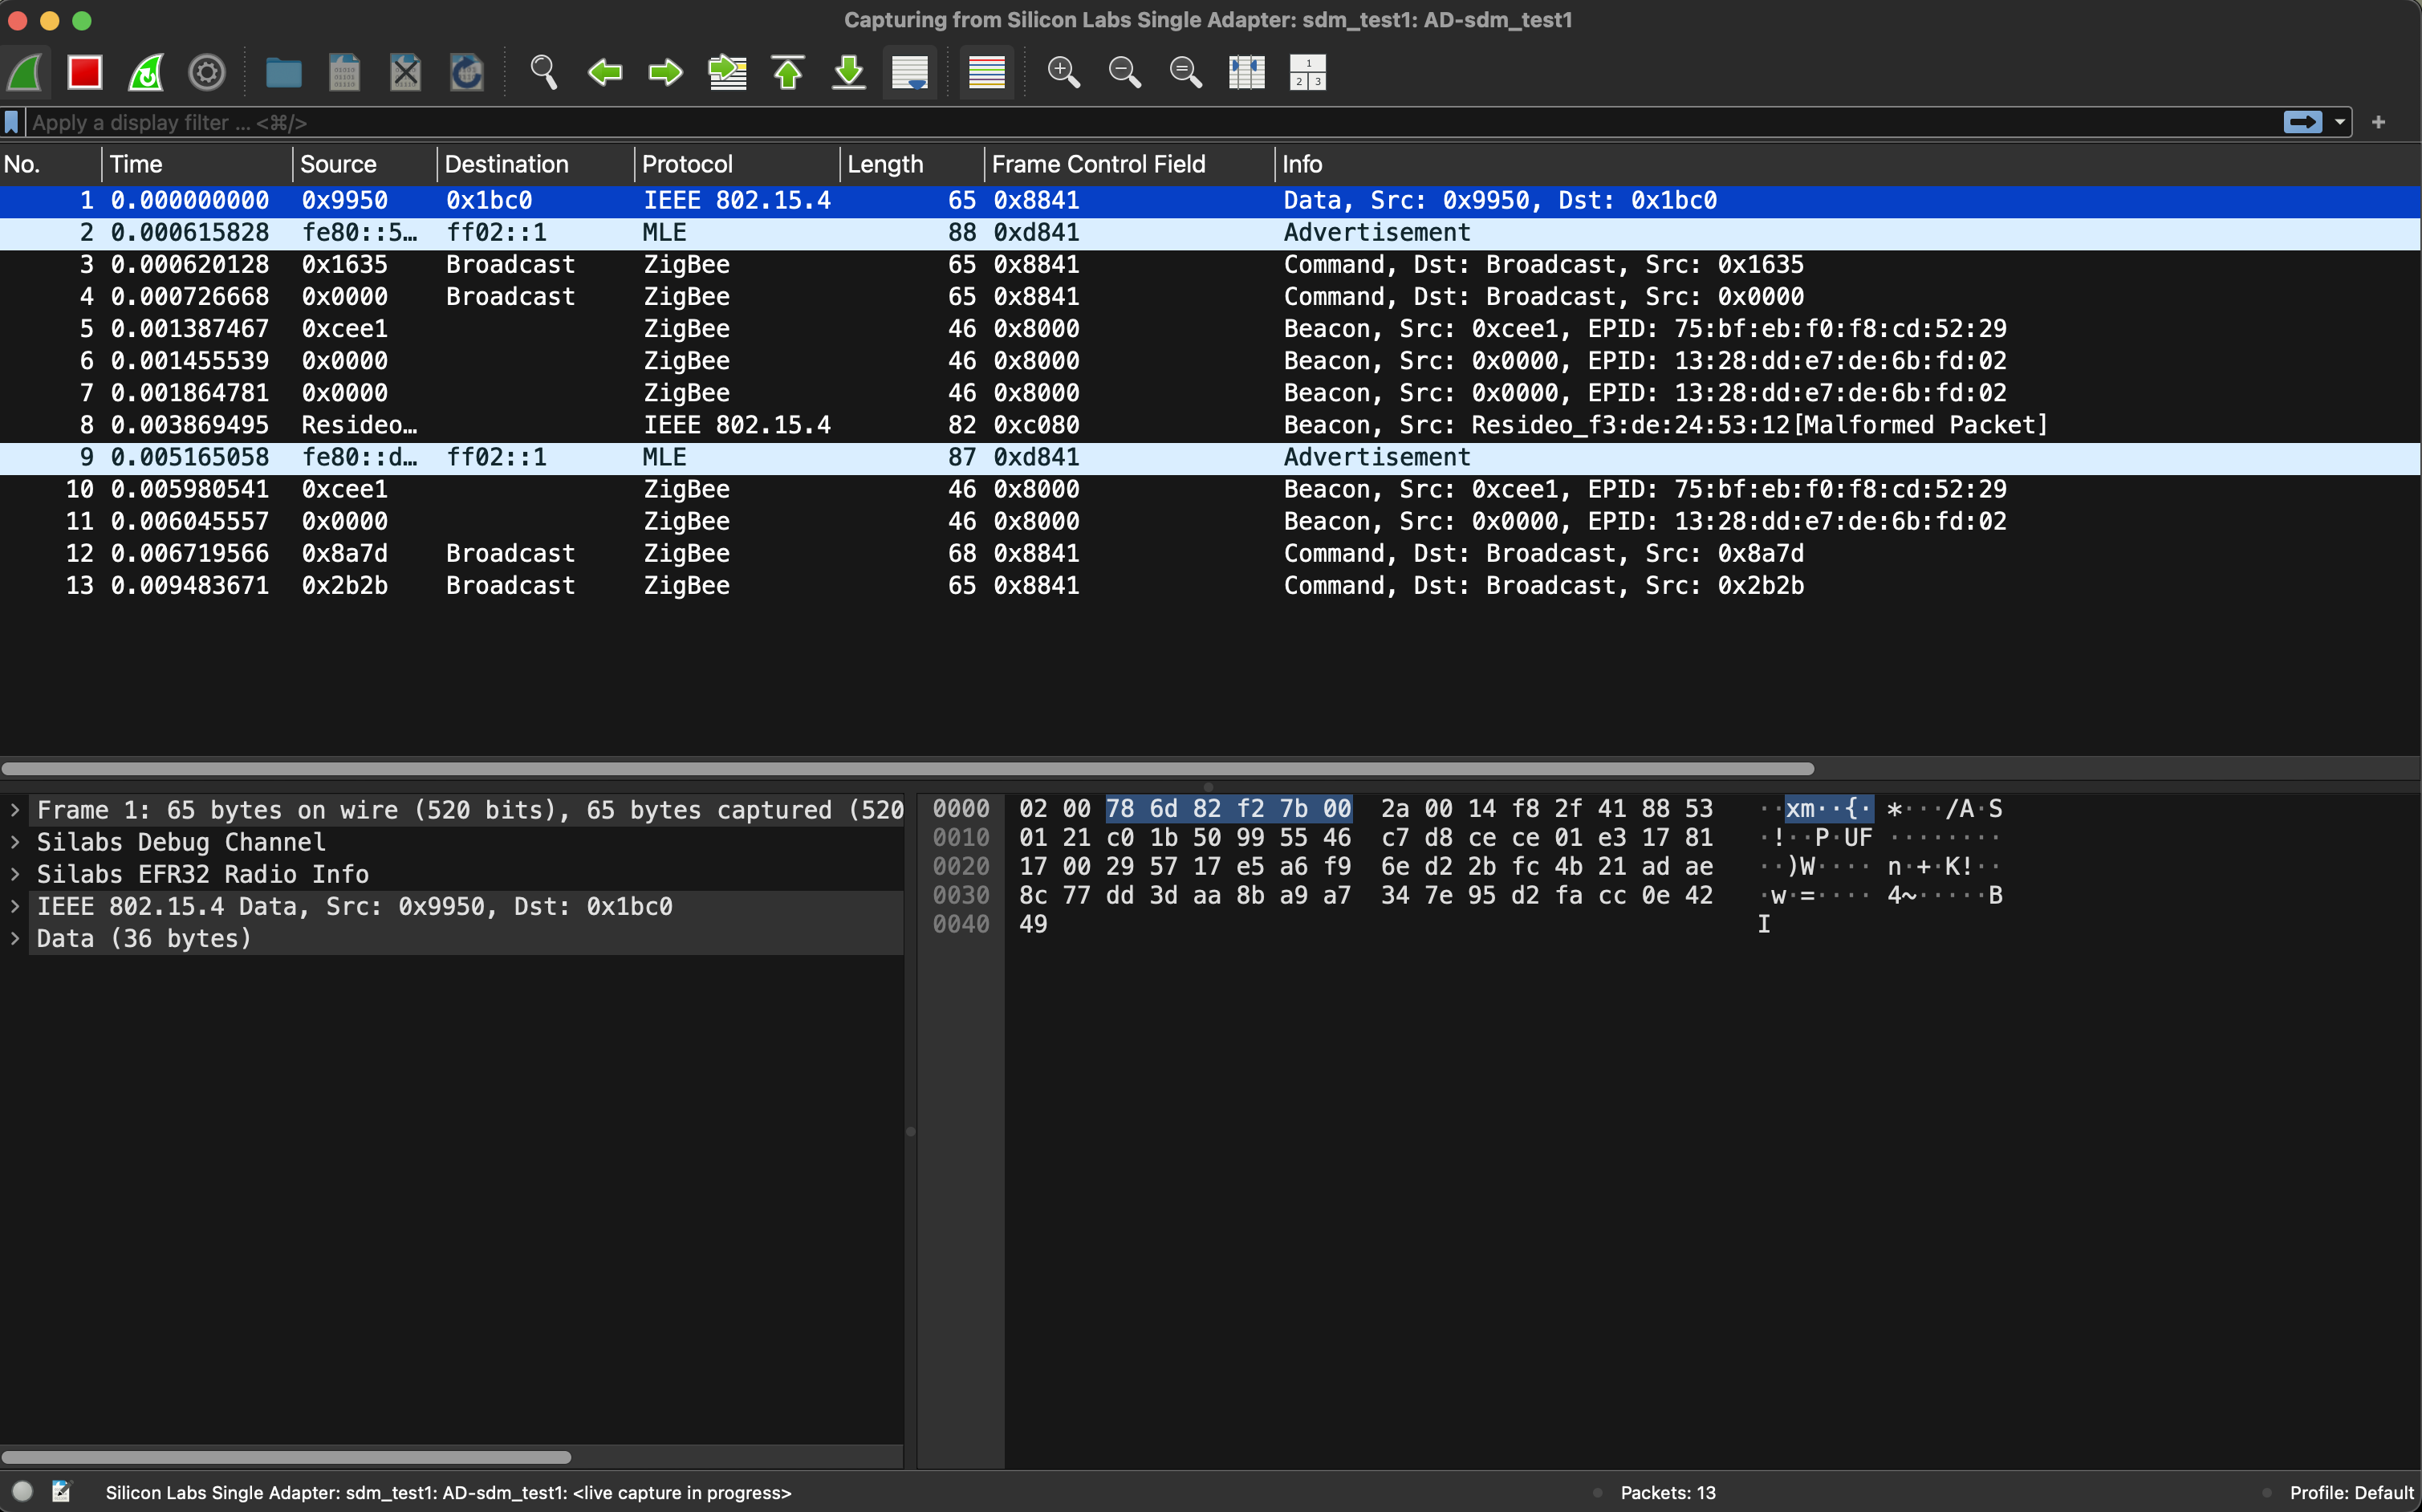
Step 3. Start Capturing#
In Wireshark, select an adapter to begin capturing.
Select any packet to view detailed protocol dissection.
Step 4. Complete the Capture#
When you finish analyzing traffic:
Stop the capture.
Save the capture file for future analysis.
Capturing from Multiple Adapters (Capture Interface)#
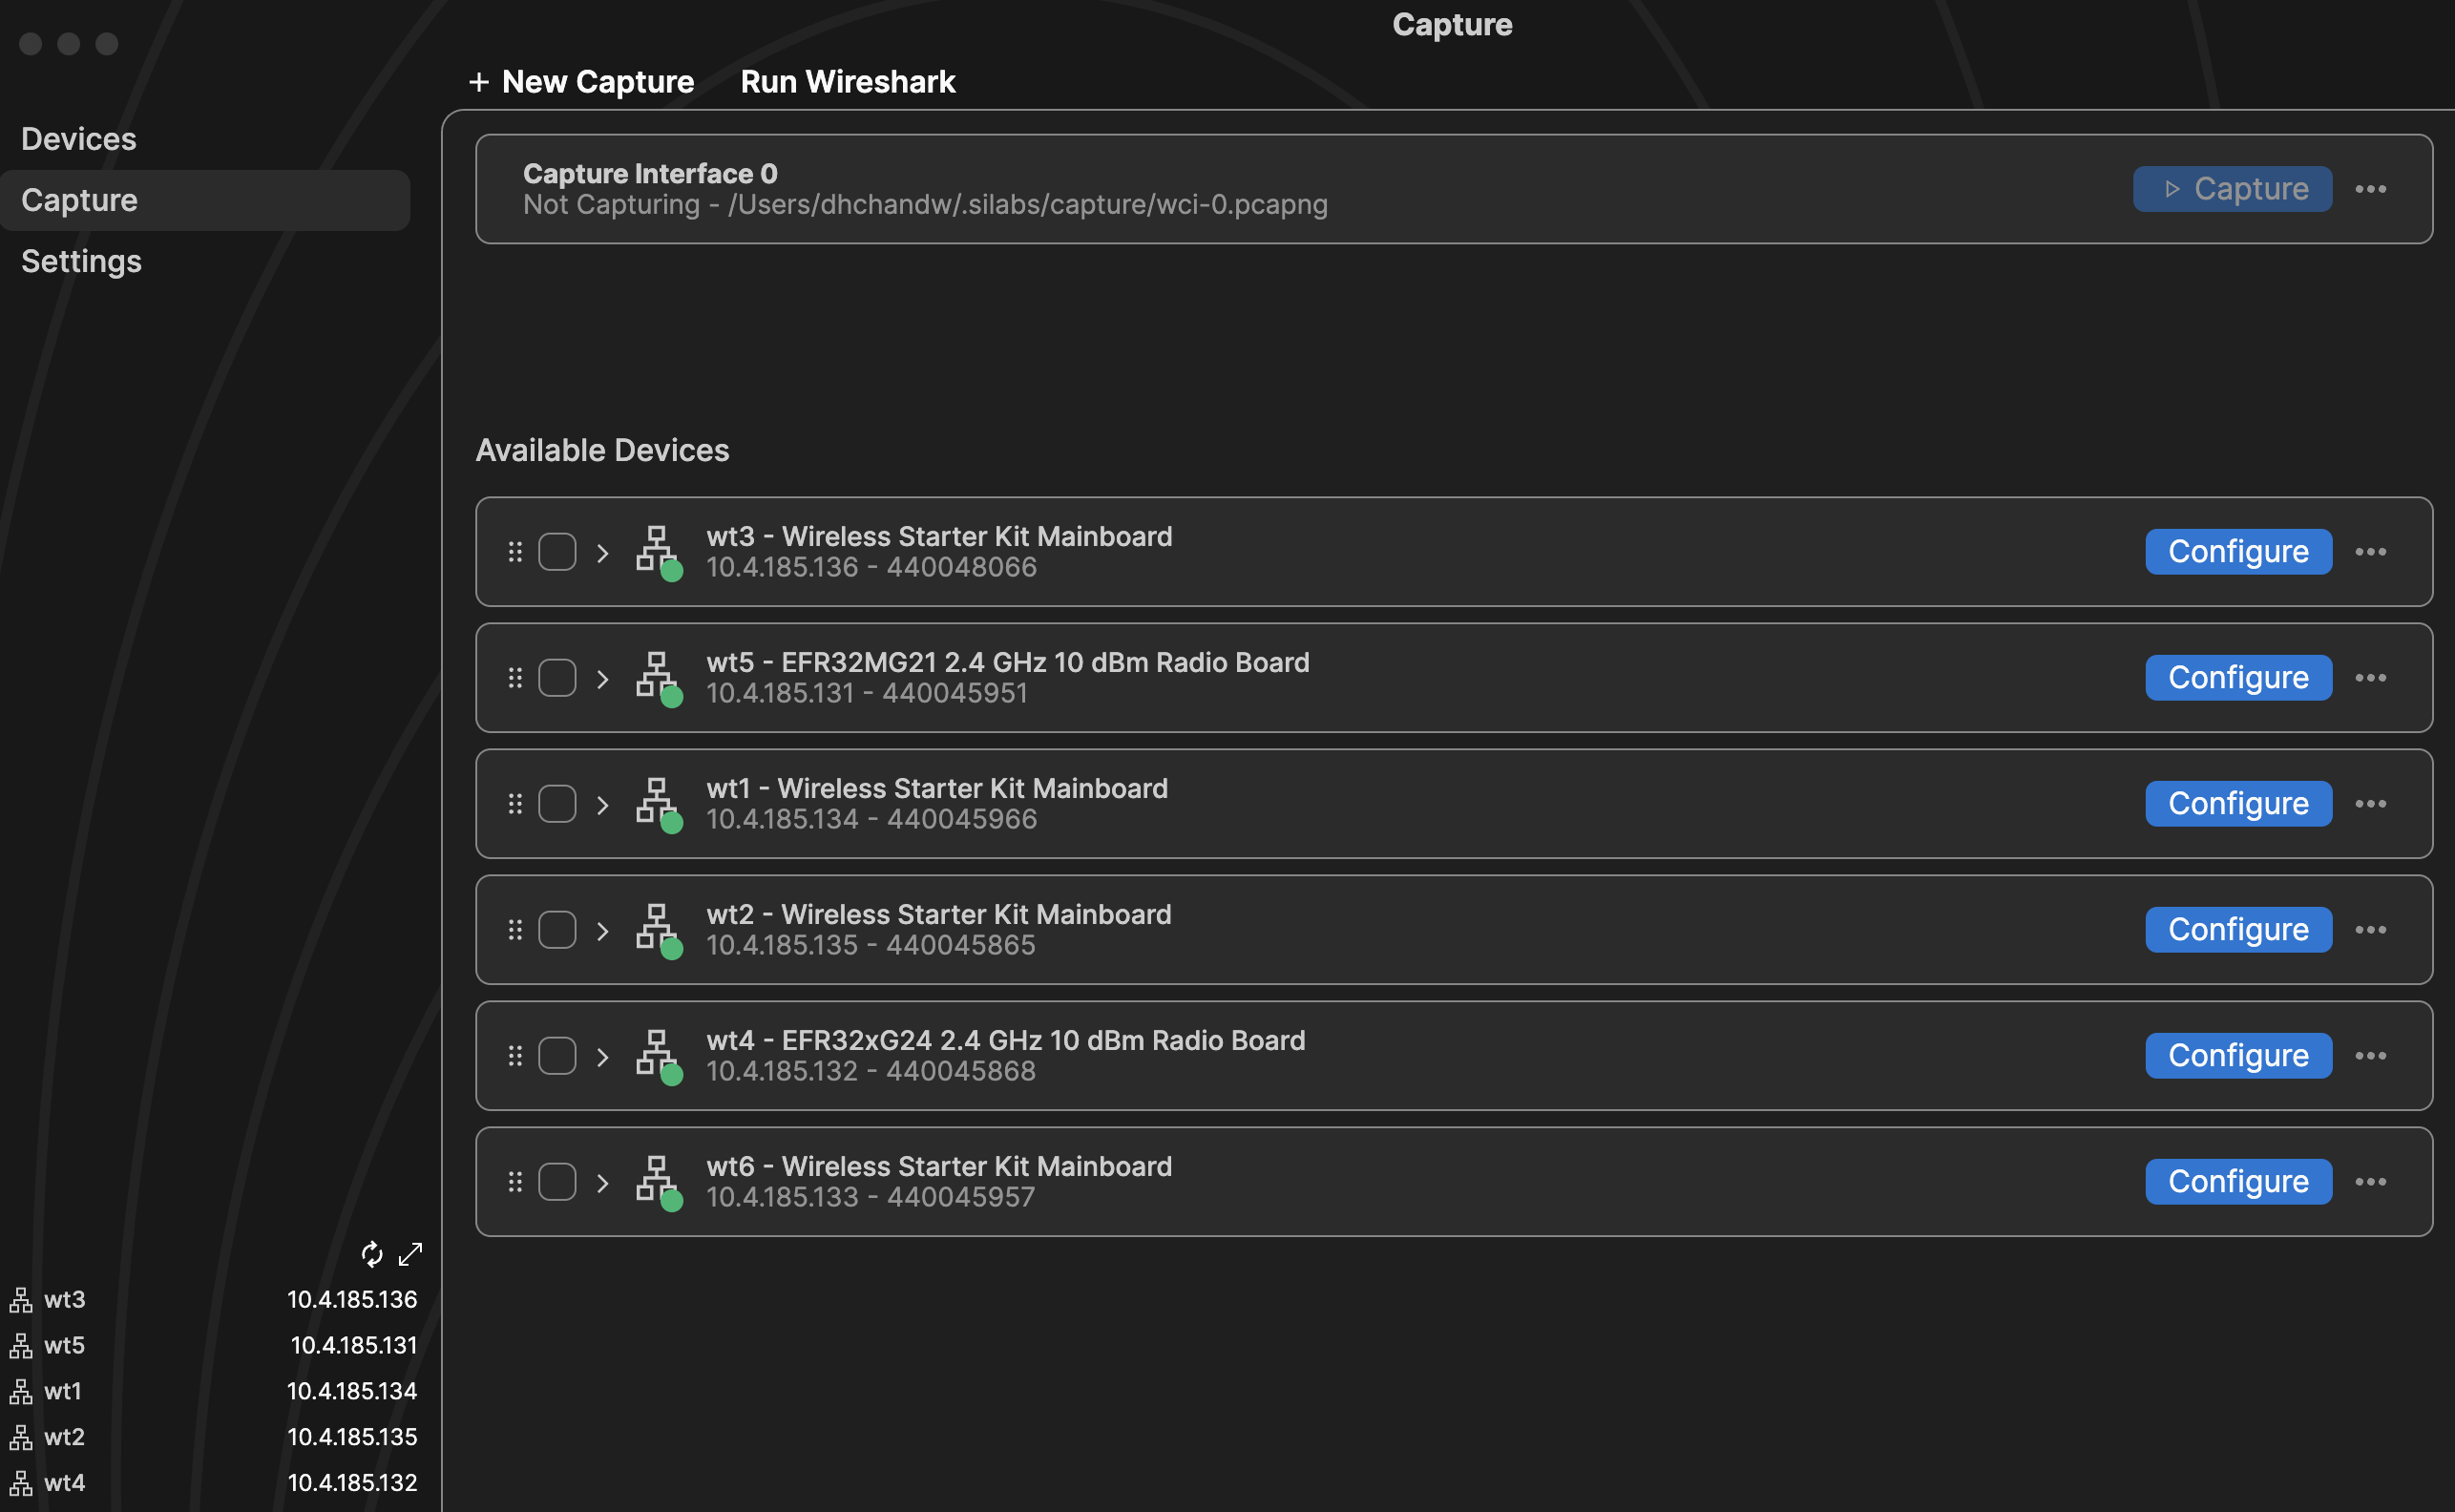
Step 1. Create a Capture Interface#
Navigate to the "Capture" view in SDM.
Click the "+ New Capture" button at the top to create a new capture interface.
Tip: If no capture interfaces exist, SDM prompts you to create one automatically.
Step 2. Add Adapters to the Capture Interface#
Drag and drop the desired adapters from the available list into your preferred capture interface.
Step 3. Start Multi-Adapter Capture#
Open Wireshark.
The capture interface you created should appear as an available interface.
Select it and start capturing.
Step 4. Monitor and Complete#
Observe traffic captured from multiple adapters simultaneously.
When you finish, stop and save the capture.
Next Steps#
Learn about CLI-based capturing
See the FAQ for troubleshooting and advanced configuration options.