Wireshark I/O Graphs#
The Wireshark I/O graph displays the traffic present in a capture file, which is measured in bytes per second. The x-axis represents the time in seconds, and the y-axis represents the Bytes per second.
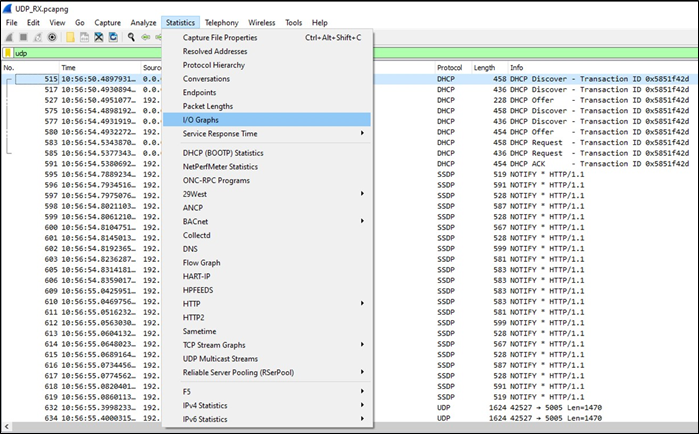
Steps to Trace an I/O Graph:
Open the required Wireshark capture and apply the filter like TCP or UDP.
Now click on Statistics→ I/O Graph menu or toolbar item.
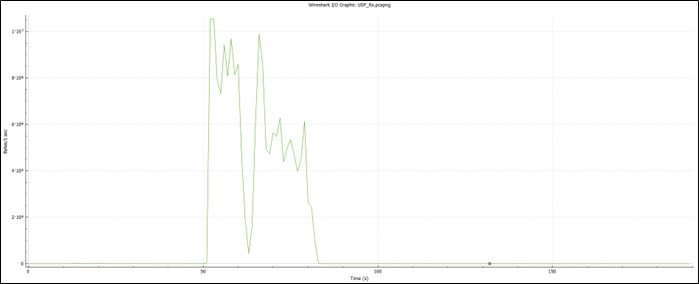
If UDP_Rx capture is considered, the following graph conveys that the transfer rate of the UDP packets is ~16 Mbps per second.
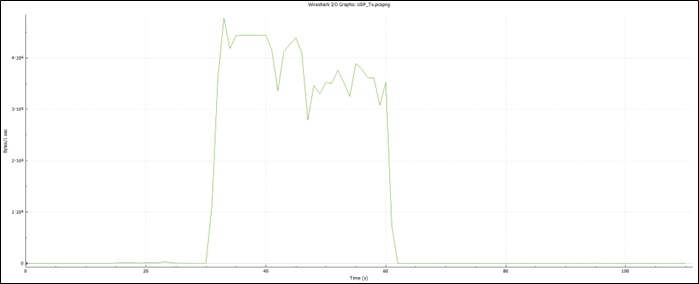
UDP Tx#
UDP Rx#
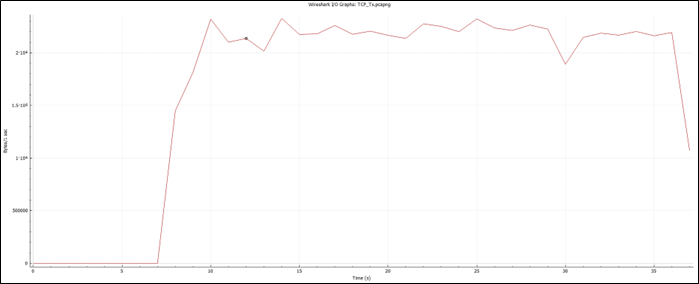
TCP Tx#
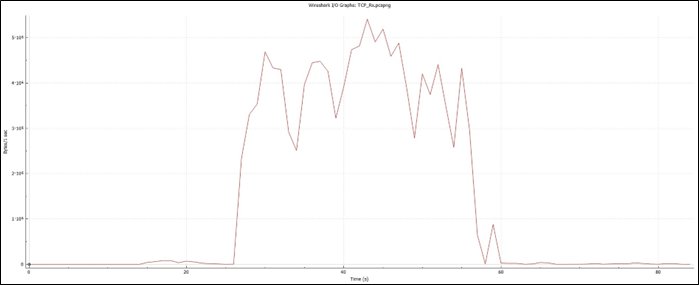
TCP Rx#
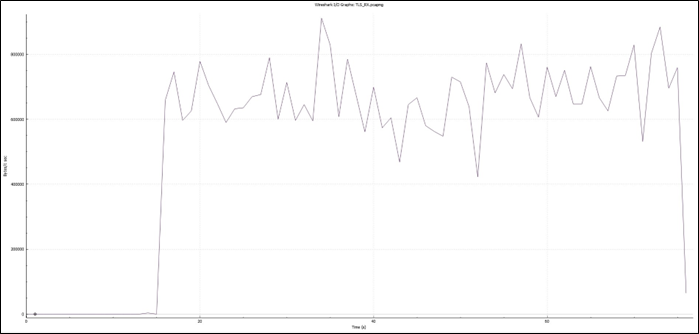
TLS Tx#
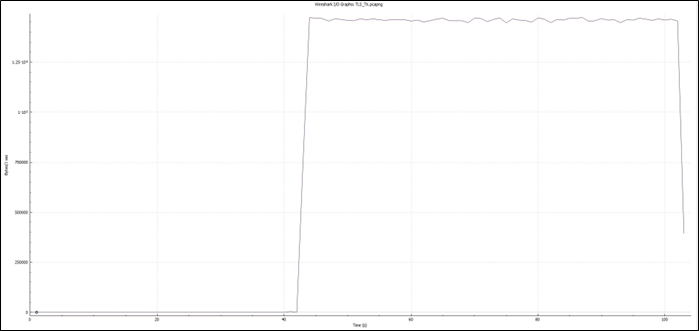
TLS Rx#
All the throughput numbers mentioned below are with the SiWN917 NCP module using STM32F411RE as the host MCU and are for reference purposes only.
Note: Currently, we don’t have BRD8045C Adapter boards for STM32 host MCU. Please reach out to sales team for more information on board availability.
Test Configurations#
| Device | BRD4346A |
| Memory Configuration | 672K |
| Access Point used |
|
| Environment | Shield Room |
| Host | STM32 (F411RE) |
| Interface | SPI |
| Mode | Non-Bypass |
| Power Save | Disabled |
Test Results#
S. No | Throughput Type | Test Tool | Throughput (Mbps) |
|---|---|---|---|
1 | UDP Tx | iPerf | 22 Mbps |
2 | UDP Rx | iPerf | 22 Mbps |
3 | TCP Tx | iPerf | 20 Mbps |
4 | TCP Rx | iPerf | 20 Mbps |
5 | TLS Tx | iPerf | 20 Mbps |
6 | TLS Rx | iPerf | 13 Mbps |
Note: We also have a Throughput example with EFR32xG24 as the host MCU available in the SDK at
\examples\featured\wlan_throughput. The throughput observed with EFR32xG24 host MCU are less compared to STM32F411RE host MCU.