Debug a Z-Wave Application#
Debugger#
The Simplicity Studio Visual Studio Code Extension relies on the Cortex-Debug extension for debugging. It is a fully fledged debugger that offers the ability to step through code, set breakpoints, and examine memory, variables, and registers.
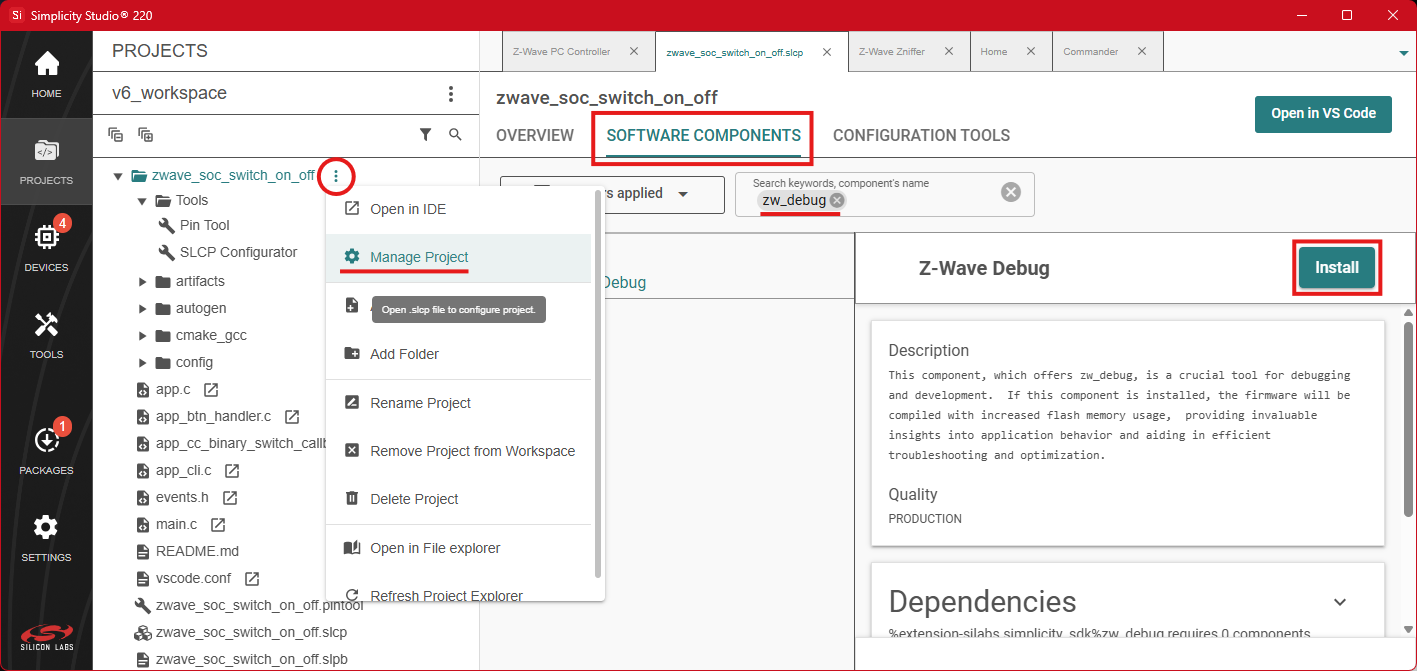
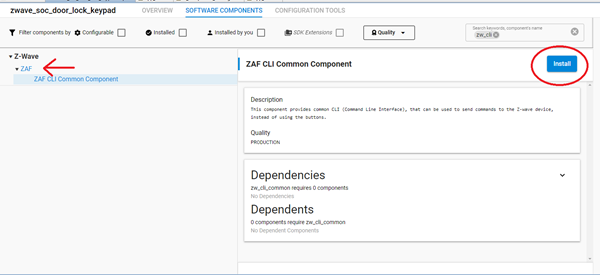
In Simplicity Studio, install the Z-Wave Debug component for your project, as shown below.
Make sure your application can be built without errors. If the firmware’s size becomes too large with the component installed, refer to Appendix C: Decreasing the firmware’s size.
In Visual Studio Code, hover over the project's name in the sidebar and click the Debug icon. The code will be built with debugging enabled and you will be prompted to select the device to flash the firmware to. When finished, the session will start and you will be able to set breakpoints, step through code, and examine memory, variables, and registers.
To set a breakpoint, click the blank space to the left of the line number in the code editor or right-click on a line of code and select Add Inline Breakpoint. Breakpoints can be managed using the Breakpoints pane in the Run and Debug sidebar. Register contents are viewable using the XPeripherals pane. Memory contents are viewable using the Memory tab of the bottom panel.
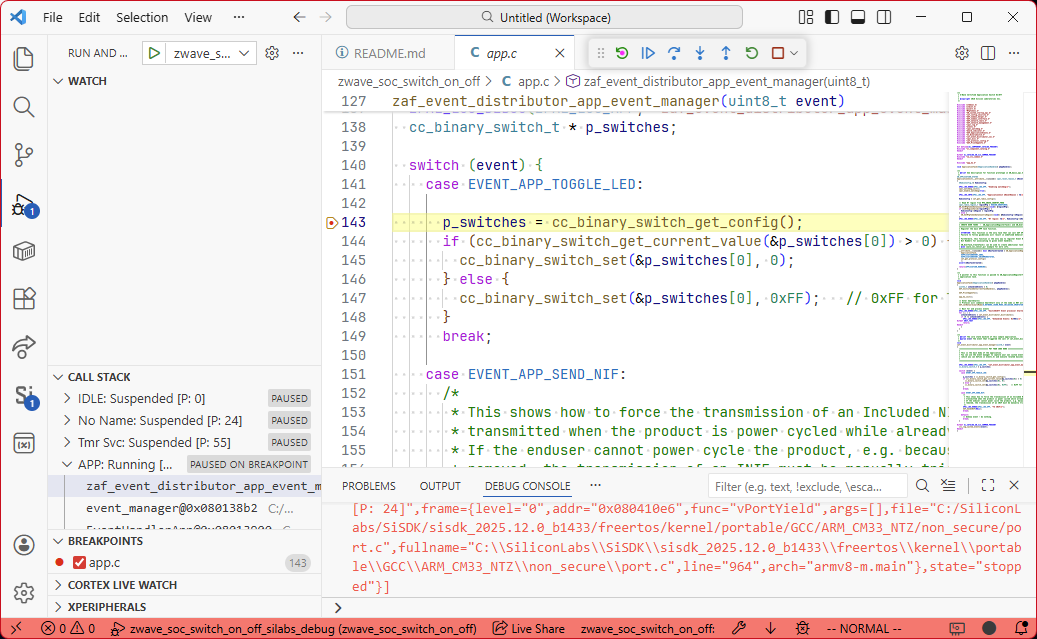
In the figure below, the sample application Switch On/Off is flashed to the device in debug mode. A breakpoint is then set in the EVENT_APP_TOGGLE_LED case of the switch statement in the event handler function. When you press BTN0 on the device, the code halts execution at the breakpoint and shows the relevant information.
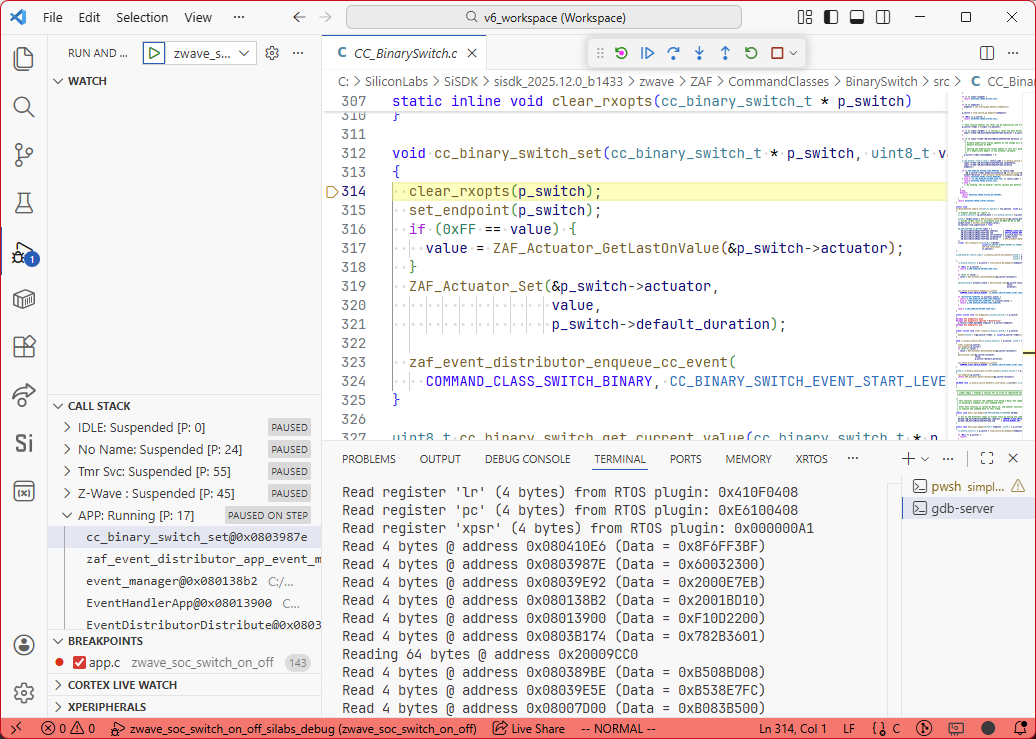
By using the Step Over and Step Into functionalities of the debugger, it is possible to follow the flow of the application.
Note: This feature does not work on sleeping devices using deep sleep EM4 mode (Sensor PIR Sample App).
Serial Debug#
The Application Framework also features debug logging functionality, enabling you to write statuses, states, and values to a terminal.
A limited set of logs are enabled by default. You can configure the logs using the Z-Wave Log component in Simplicity Studio.
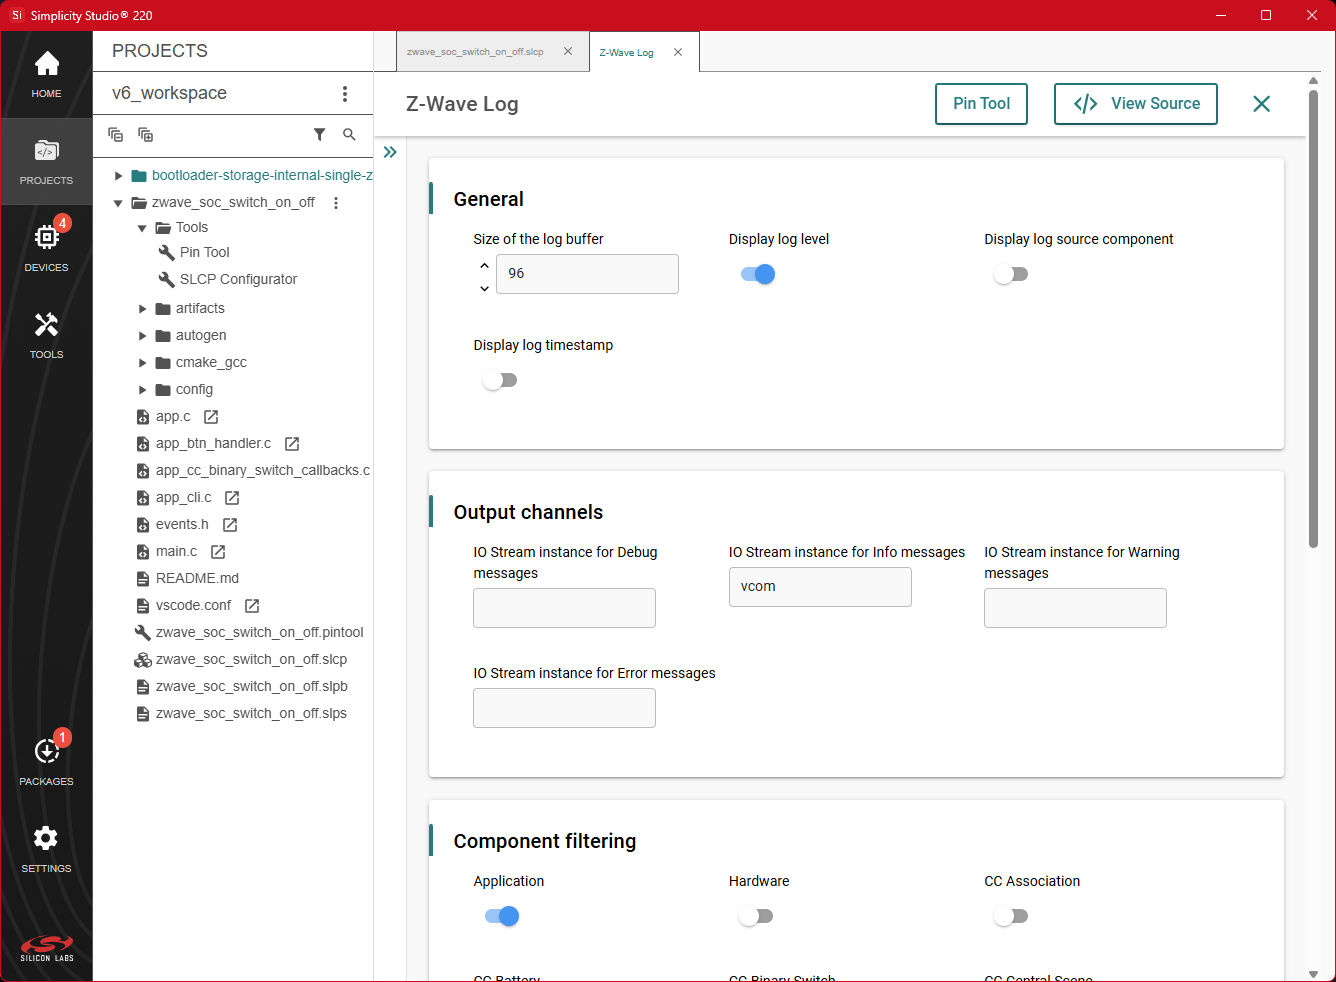
Log messages can be filtered by the software components that produce them. Logs of different severity levels can be directed to different output channels individually, e.g. UART over Virtual COM Port (VCOM) or Segger RTT.
The application must be rebuilt and flashed to the device for your configuration changes to take effect.
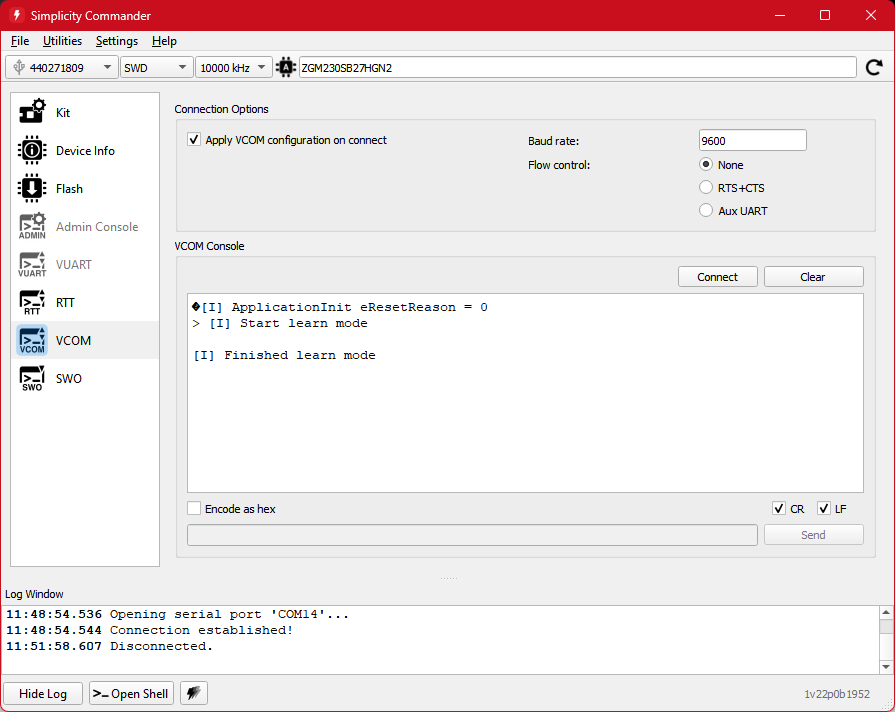
To view the logs over a serial connection, you can use Simplicity Commander or the Simplicity Device Manager, accessible via the Tools page in Simplicity Studio, or any compatible third-party tool. This guide will use Simplicity Commander.
Select your device in the top left corner of the window and navigate to the VCOM view.
If you are using a sleeping application, tick Apply VCOM configuration on connect and set the Baud rate to 9600.
Click Connect. The bottom log window should say 'Connection established!'.
Press the RESET button on the board to see the welcome message. Press BTN1 to toggle Learn Mode.
Command Line Interface#
The Z-Wave SDK has a Command Line Interface (CLI) component that allows you to control a device without the use of physical buttons.
The Z-Wave CLI component includes common commands such as factory reset and starting or stopping learn mode. Most of the sample applications have additional commands implemented, based on their specific behavior.
This component is installed by default, unless the Z-Wave Debug component is also installed.
To connect to the CLI, the same procedure can be used as the one for the Serial Debug. Once the connection is established, commands can be issued from the input field of the serial terminal.
Note: The CLI is halted while the application is in sleep mode. To disable sleeping, wake up the device (e.g. by pressing the Learn Mode button) and issue the sleeping disable command.