Using the Network Analyzer#
Now that your network is set up, you can evaluate the data being transmitted using the Network Analyzer tool. Network Analyzer helps you debug network connectivity by displaying radio packets and certain debug interface events in a format that is easy to visualize and analyze. See the online Simplicity Studio User's Guide for more information.
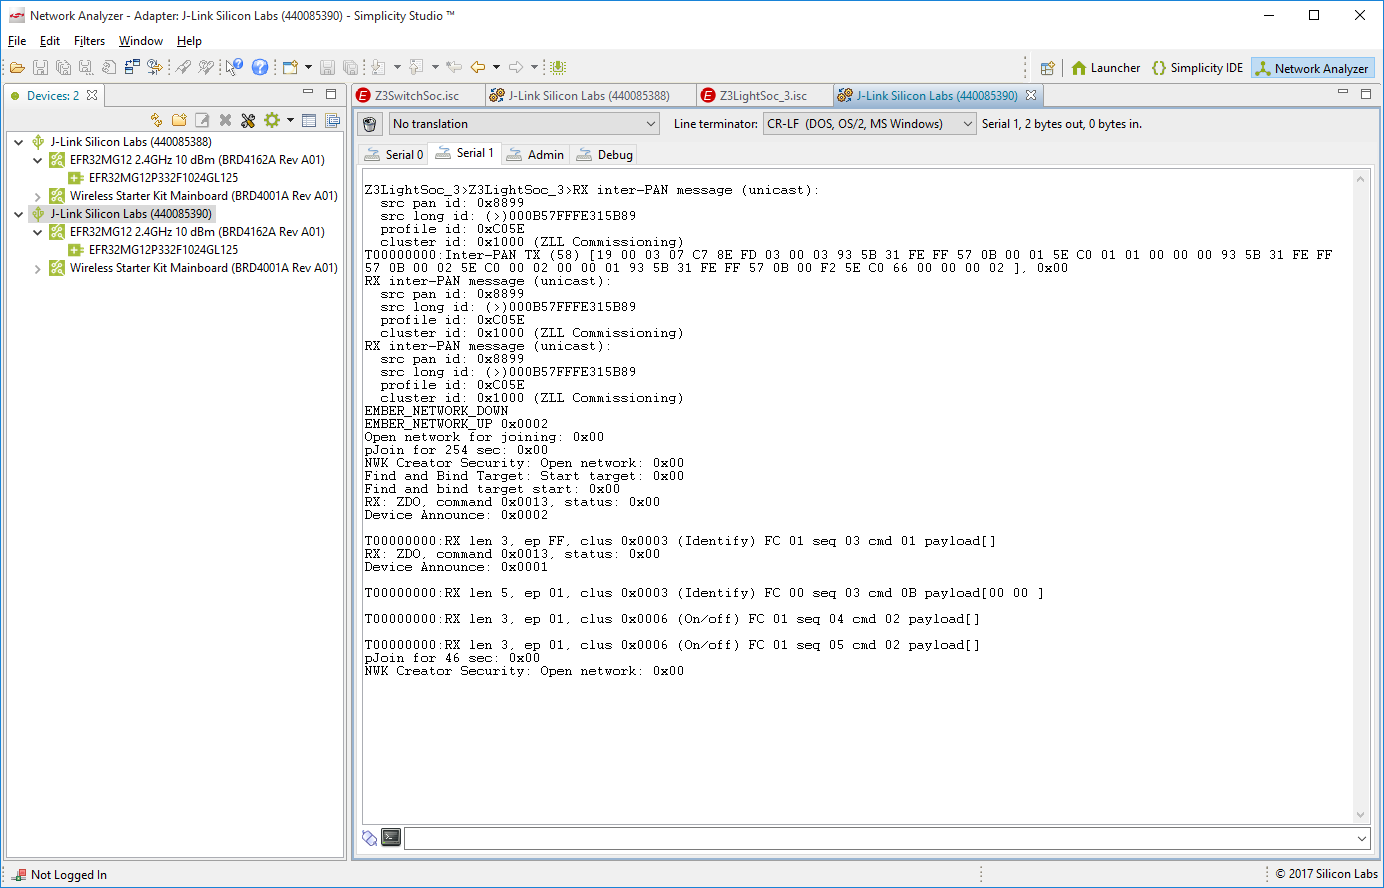
Click the Launcher button in the upper right and select Network Analyzer from the Tools menu. The Network Analyzer opens with your console window(s) still displaying data.
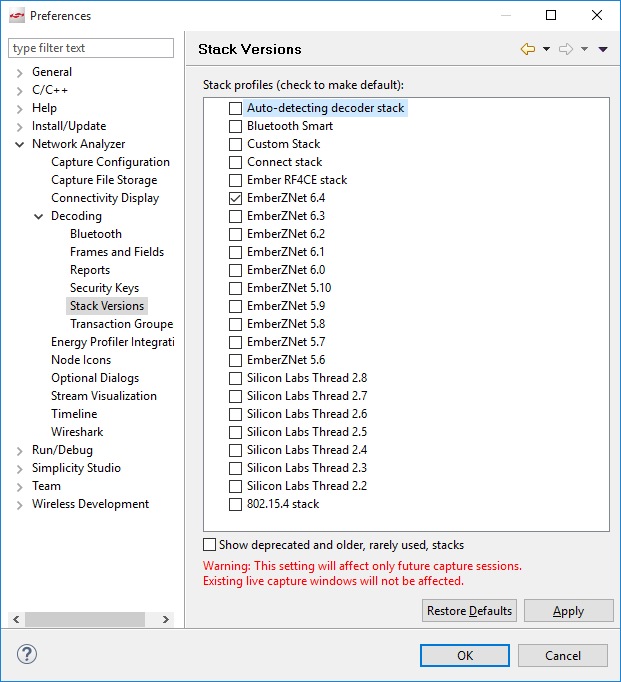
Make sure that Network Analyzer is set to decode the correct protocol. Select Window > Preferences > Network Analyzer > Decoding > Stack Versions, and verify it is set correctly. If you need to change it, click the correct stack, click Apply, and then OK.
Note: If you are working with a Zigbee+Bluetooth Dynamic Multiprotocol application, Auto-detecting decoder stack must be selected.
To make sure that packets decode correctly, manually enter the NWK key. In either the Switch or Light console window, type the following, being sure to include the ‘s’ in ‘keys’:
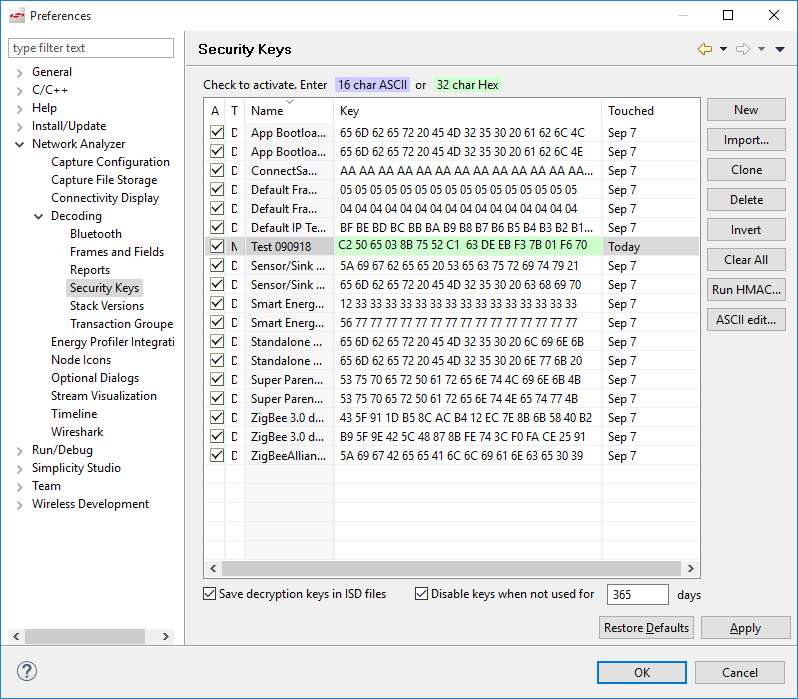
Keys printIn the information returned, find the network key and copy it:
NWK Key: EF DE 0C 69 5B 72 6E C4 41 27 C6 E6 F1 36 26 26In Window > Preferences, open Network Analyzer > Decoding > Security Keys, click New, name the new entry, and paste the copied key into it. Click Apply. Click OK to leave.
Right-click on the light or the switch device, and select Start Capture. Do the same for the other device.
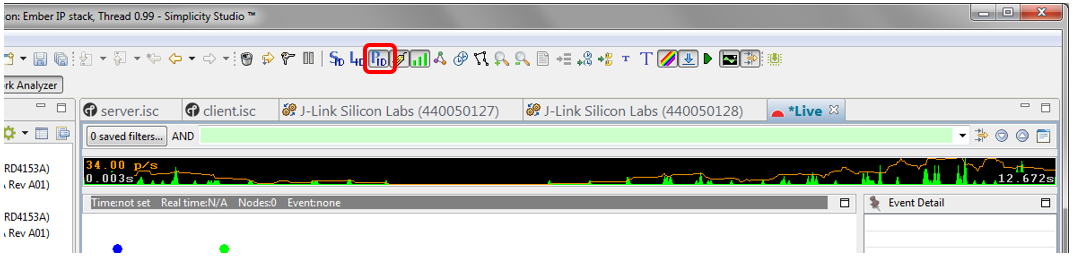
If you are in an environment with a number of wireless devices, you may have a very noisy Network Analyzer environment, as reflected both in the event traffic and in the map. To show additional information in the map, click on the map.
On the toolbar, click the PAN ID button, circled in the following image.
Right-click on the representation of your Switch device (the dot that has the same ISA3 adapter name or WSTK name or J-Link serial number as the device) and select Show only this PAN.
To filter transactions:
Press button 0 on the switch to get a complete transaction (in blue).
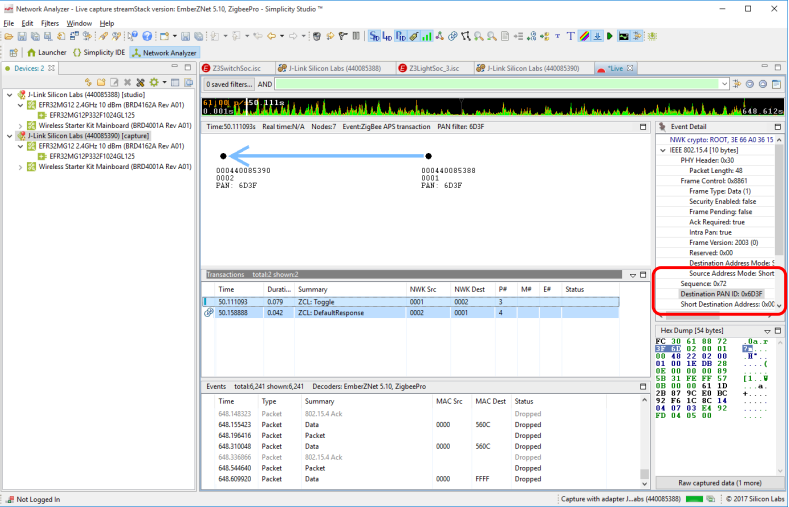
Click on one of the blue transactions.
In the Event Detail, expand IEEE802.15.4 and scroll down until you see the Destination PAN ID
Right-click on it, and select Add to filter.
Apply the filter by clicking the icon next to the green filter expression field, circled in the following image.
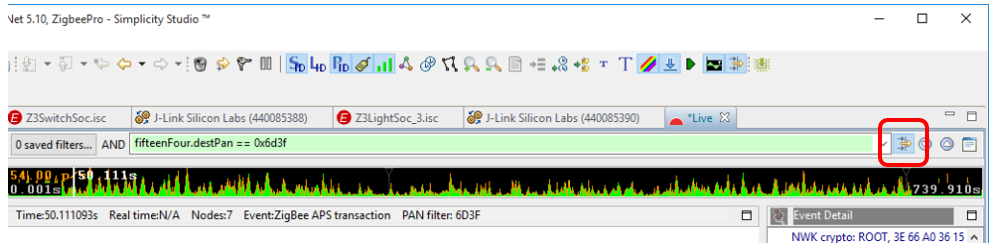
Now when you press button 0 you can clearly see each event associated with the transaction.
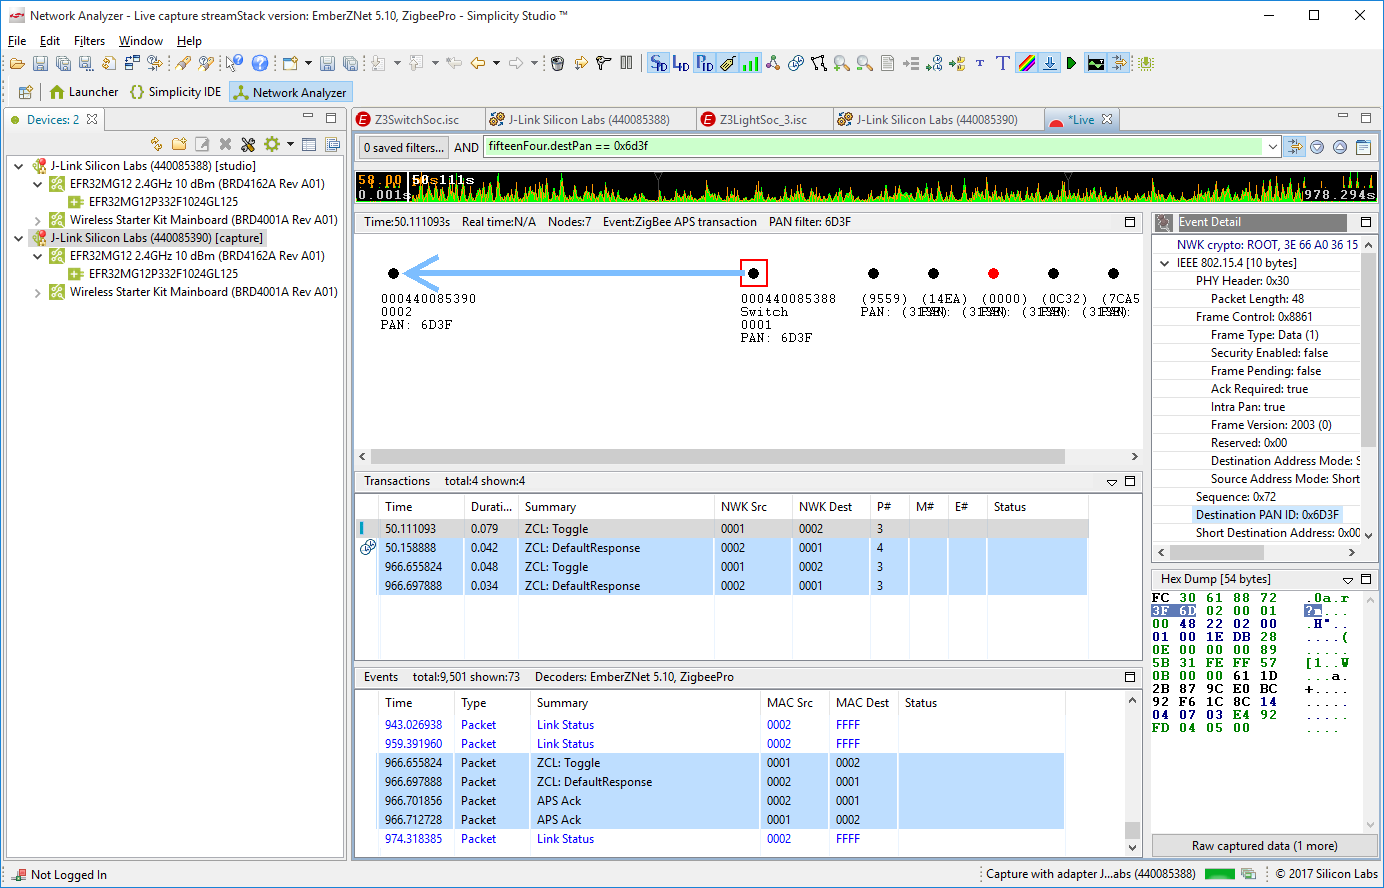
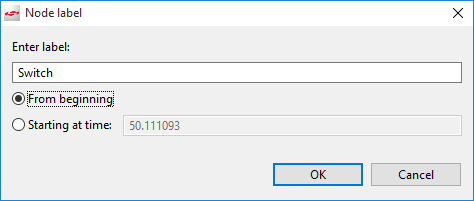
When analyzing more complex networks, you can drag and reposition the items shown in the map. By right-clicking on a device, you can also show connectivity and add labels. Labelling is useful not only in map, but also in the log. To label the full log, click From beginning.