Channel Sounding Performance Metrics#
Accuracy#
Silicon Labs conducted indoor office testing to evaluate the accuracy of its Channel Sounding solution under realistic and challenging RF conditions (e.g., multipath effects, dense 2.4 GHz activity). The intent is not to provide exact accuracy figures, as these depend heavily on the specific environmental conditions where the testing is performed. Rather, the results illustrate the solution’s potential and demonstrate how different measurement configurations affect distance estimation accuracy.
Test Environment and Configurations#
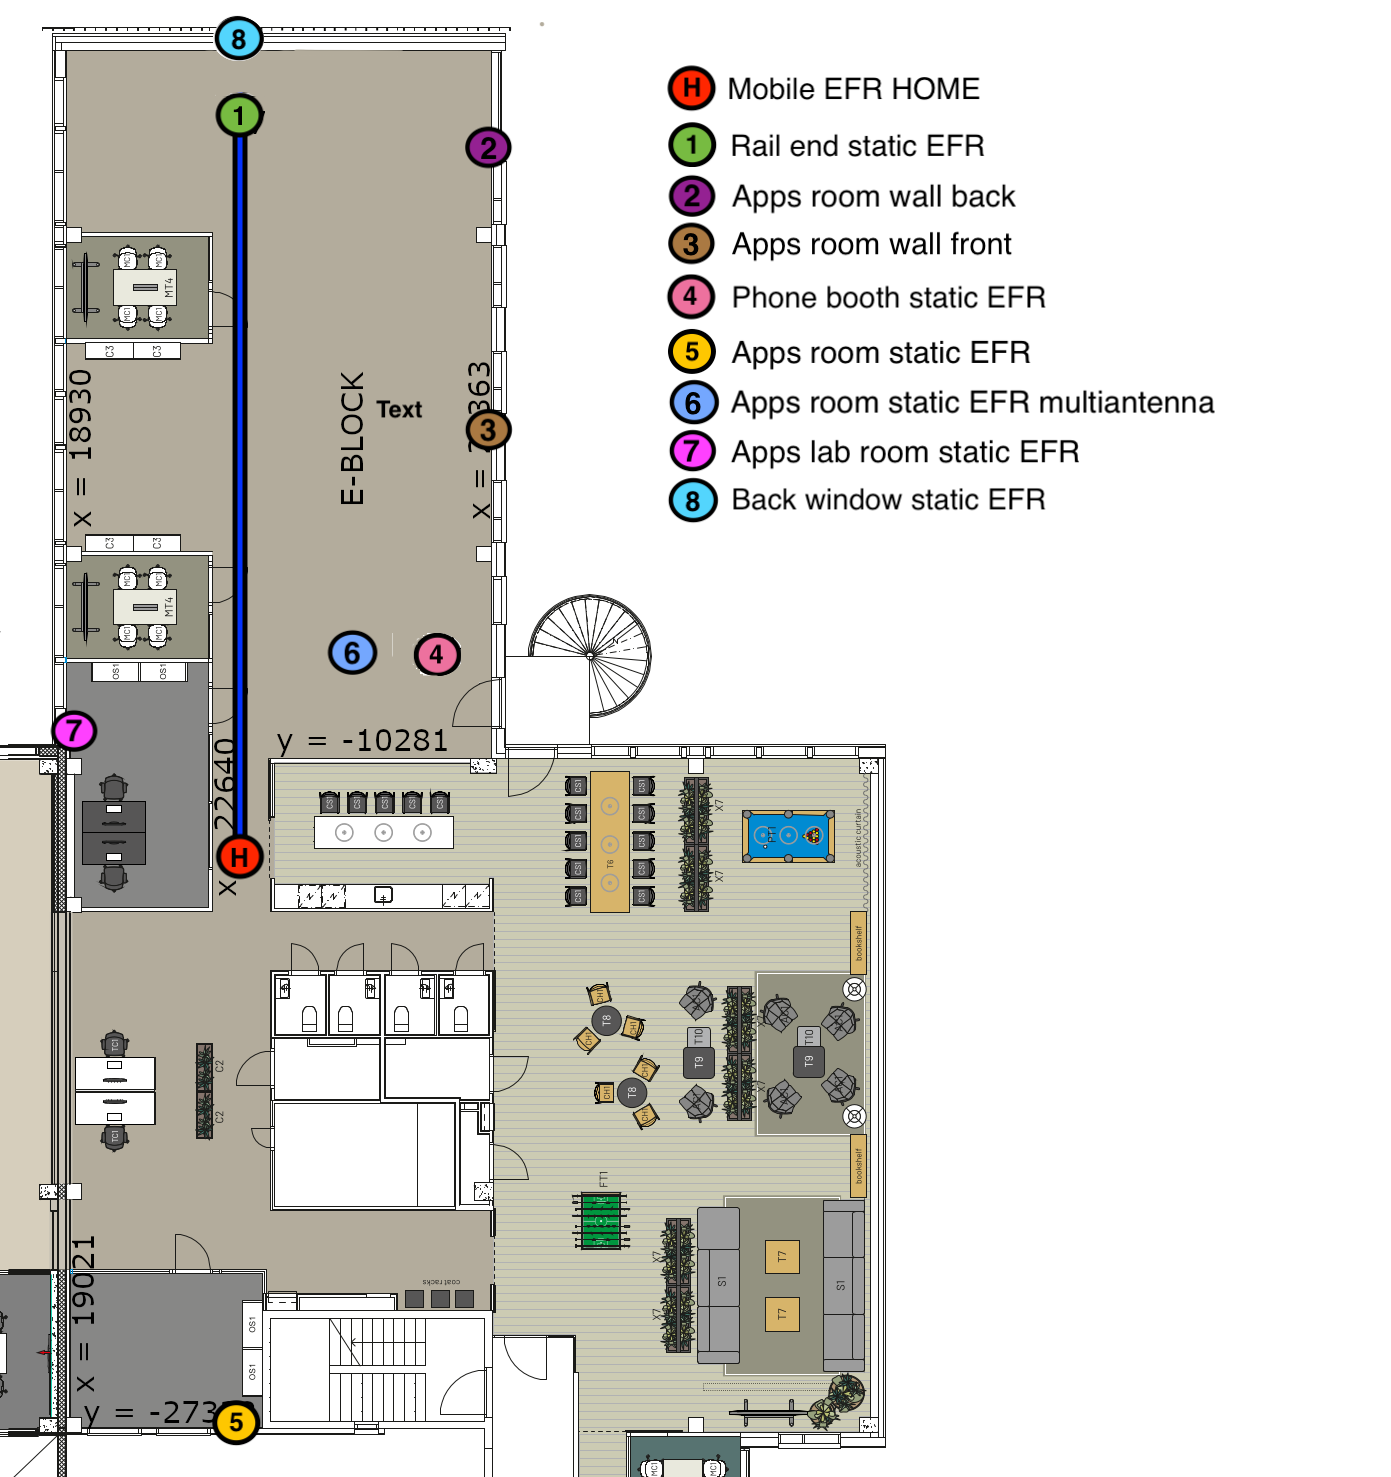
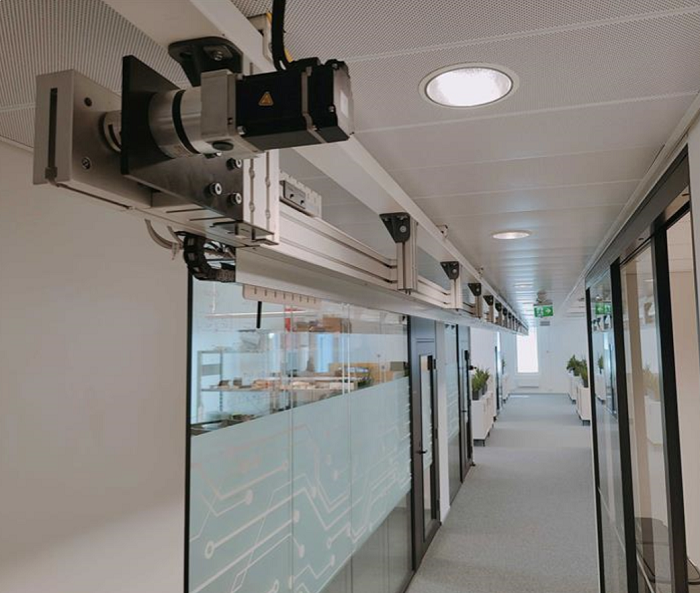
All tests are performed using 2 BRD2606A boards except the conducted tests. The images below show the floor map of the office where the BRD2606A boards are placed at 8 static locations and one mobile location. The BRD2606A boards at locations H and 1 are mounted on a ceiling rail robot where the BRD2606A boards are co-polarized. The devices at locations 2, 3, 4, 5, 6, 7, and 8 are either mounted on the ceiling or on the side walls at varying heights with random device orientations. Listed below are the heights at which the BRD2606A devices are placed in the office environment.
Device Position | Height (m) |
|---|---|
BRD2606A | |
H | 2.242 |
1 | 2.160 |
2 | 2.150 |
3 | 2.183 |
4 | 2.500 |
5 | 2.220 |
6 | 2.653 |
7 | 2.550 |
8 | 2.190 |
The results of PBR, RTT, and PBR + RTT (submode) distance estimation are based on measurements taken at multiple distances between 0.5 m and 34 meters, and in different measurement configurations:
Conducted, line-of-sight (LOS), and non-line-of-sight (NLOS) environments
In conducted environment, the antenna paths of 2 BRD4198A boards are connected together using a power splitter to have 4 different cable lengths: 2.54 m, 6.4 m, 15 m, and 27 m.
In LOS environment, the distance is estimated at multiple positions between devices H and 1 ranging from 0.5 to 19.5 meters.
In NLOS environment, the distance is estimated at 28 different positions between the devices mounted in the office (2-5, 2-4, 4-7, etc.).
SL_RTL_CS_ALGO_MODE_REAL_TIME_BASIC, SL_RTL_CS_ALGO_MODE_REAL_TIME_FAST and SL_RTL_CS_ALGO_MODE_STATIC_HIGH_ACCURACY algorithm modes referenced by BASIC, FAST, and STATIC respectively.
In SL_RTL_CS_ALGO_MODE_REAL_TIME_BASIC AND SL_RTL_CS_ALGO_MODE_REAL_TIME_FAST modes, the distance is estimated 200 times at each position (i.e. 200 CS procedures).
In SL_RTL_CS_ALGO_MODE_STATIC_HIGH_ACCURACY mode, the distance is estimated 4 times at each position (i.e. 400 CS procedures as 100 CS procedures = 1 distance estimation).
Antenna Configurations
In PBR mode, ACI (Antenna Configuration Index) values 0, 1, 4, and 7 are used which have the following definitions:
0 = Single antennas on both sides
1 = Dual antenna initiator & single antenna reflector
4 = Single antenna initiator & dual antenna reflector
7 = Dual antennas on both sides
In RTT mode, the antenna configuration indicates which antenna (single or switching) is used on the initiator and reflector devices with following definitions [initiator:reflector]:
1x1 = CS_SYNC_ANTENNA_1: CS_SYNC_ANTENNA_1
2x1 = CS_SYNC_SWITCHING : CS_SYNC_ANTENNA_1
1x2 = CS_SYNC_ANTENNA_1: CS_SYNC_SWITCHING
2x2 = CS_SYNC_SWITCHING: CS_SYNC_SWITCHING
High, Medium, and Low Channel Map settings
High: 72 channels are used for CS, 1 MHz channel spacing
Medium: 37 channels, *2 MHz channel spacing
Low: 20 channels, 1 MHz channel spacing
*Increasing the channel spacing results in a reduced maximum range. This relationship is mathematically expressed as
Note: The statistical values in the tables below are derived from the combined data set of all distance estimations in each configuration.
Distance Estimation Accuracy Metrics#
Conducted Environment#
The table below summarizes the accuracy of CS distance estimation in a conducted environment using BRD4198A. Measurements were performed across different algorithm modes and supported channel map settings.
Measurement Mode | Algorithm Mode | Channel Map | 90th % Abs Error (m) | 95th % Abs Error (m) |
|---|---|---|---|---|
PBR | FAST | HIGH | 0.41 | 0.41 |
MEDIUM | 0.50 | 0.51 | ||
BASIC | HIGH | 0.40 | 0.40 | |
MEDIUM | 0.41 | 0.41 | ||
LOW | 0.46 | 0.47 | ||
STATIC | HIGH | 0.40 | 0.40 | |
RTT | BASIC | HIGH | 3.01 | 3.09 |
PBR+RTT (submode)* | BASIC | HIGH | 0.40 | 0.40 |
STATIC | 0.40 | 0.40 |
*Measurements taken in PBR main mode
LOS and NLOS Environments#
The accuracy metrics provided in this section demonstrate the performance of Channel Sounding (CS) across the three measurement modes and the three PBR algorithm modes in LOS and NLOS environments, emphasizing the impact of different channel maps and antenna path configurations on distance estimation accuracy. Only one algorithm mode and measurement mode is selected to demonstrate how variations in the channel map and number of antenna paths affect accuracy; the same trends hold true across all algorithm modes and measurement modes.
In PBR measurement mode, each algorithm mode is optimized for specific application scenarios. Both SL_RTL_CS_ALGO_MODE_REAL_TIME_FAST and SL_RTL_CS_ALGO_MODE_REAL_TIME_BASIC are designed for real-time applications such as asset tracking; however, SL_RTL_CS_ALGO_MODE_REAL_TIME_FAST is particularly suitable for scenarios involving continuously moving targets as it offers low latency, but with reduced accuracy. In contrast, SL_RTL_CS_ALGO_MODE_REAL_TIME_BASIC is ideal for applications where higher accuracy is more important than minimizing latency, and the device moves infrequently. Refer to Runtime Performance of Distance Estimation Algorithm for the expected calculation times of the two real-time algorithm modes in different configurations.
SL_RTL_CS_ALGO_MODE_STATIC_HIGH_ACCURACY is recommended for scenarios where devices are stationary and measurement duration is not a concern, offering improved accuracy, especially in NLOS environments.
The results in the table below provide the 90th and 95th percentile absolute errors based on the measurements taken in the indoor office environment described above. The measurements were taken with the high channel map setting and ACI = 7 (4 antenna paths).
Measurement Mode | RTL algorithm mode | LOS | NLOS | ||
|---|---|---|---|---|---|
90th % Abs Error (m) | 95th % Abs Error (m) | 90th % Abs Error (m) | 95th % Abs Error (m) | ||
PBR | FAST | 0.74 | 0.82 | 4.17 | 5.11 |
BASIC | 0.39 | 0.42 | 3.18 | 4.89 | |
STATIC | 0.57 | 0.65 | 2.56 | 4.18 | |
RTT | BASIC | 1.89 | 2.29 | 13.99 | 20.02 |
PBR+RTT (submode)* | BASIC | 0.39 | 0.43 | 3.02 | 4.99 |
STATIC | 0.58 | 0.67 | 1.99 | 2.30 | |
*Measurements taken in PBR main mode.
Note: The accuracy of RTT in both main mode and sub-mode is currently sub-optimal. Channel Sounding is a new technology and software improvements are made in each software release to improve the performance of both PBR and RTT modes. See Known Issues and Limitations for more information.
The following sections detail the impact of channel map and antenna configuration settings on accuracy.
Effect of Channel Map on Accuracy#
The measurements in the table below were taken with ACI = 7 and real-time basic algorithm mode. It can be seen that as the number of channels decreases, the accuracy worsens especially in challenging NLOS environments.
Channel Map | LOS | NLOS | ||
|---|---|---|---|---|
90th % Abs Error (m) | 95th % Abs Error (m) | 90th % Abs Error (m) | 95th % Abs Error (m) | |
HIGH | 0.39 | 0.42 | 3.18 | 4.89 |
MEDIUM | 0.40 | 0.46 | 2.29 | 6.70 |
LOW | 0.75 | 0.96 | 9.42 | 10.43 |
Effect of Antenna Paths on Accuracy#
The table below shows how the number of antenna paths influences distance estimation accuracy in both LOS and NLOS environments. Measurements were taken using the high channel map setting in real-time basic algorithm mode. As the number of antenna paths decreases from 4 (ACI = 7) to 1 (ACI = 0), errors in both LOS and NLOS environments increase, with the most significant degradation observed in challenging RF environments. This highlights the importance of antenna diversity for achieving reliable and accurate Channel Sounding results.
ACI | LOS | NLOS | ||
|---|---|---|---|---|
90th % Abs Error (m) | 95th % Abs Error (m) | 90th % Abs Error (m) | 95th % Abs Error (m) | |
7 | 0.39 | 0.42 | 3.18 | 4.89 |
4 | 0.24 | 0.25 | 3.85 | 4.88 |
1 | 0.45 | 0.56 | 4.22 | 5.76 |
0 | 0.48 | 0.51 | 5.04 | 7.33 |
For further guidance on optimizing antenna diversity and polarization, refer to AN1493.
Runtime Performance of Distance Estimation Algorithm#
The distance calculation time is one of the most important performance metrics in CS, as it directly limits the update rate. The calculation time is defined as the duration between the ranging algorithm's input and output, and is affected by the chosen number of antenna paths and the number of channels used for channel sounding.
The table below provides the approximate calculation times for PBR measurements using BRD2606A at a distance of 2m.
The measurements include both SL_RTL_CS_ALGO_MODE_REAL_TIME_BASIC and SL_RTL_CS_ALGO_MODE_REAL_TIME_FAST modes with different numbers of channels and antenna paths.
Algorithm Mode | Number of Antenna Paths (NAP) | Number of Channels | Calculation Time (ms) |
|---|---|---|---|
SL_RTL_CS_ALGO_MODE_REAL_TIME_FAST | 4 | 72 | ~20.0 |
37 | ~10.0 | ||
20 | ~2.5 | ||
2 | 72 | ~10.0 | |
37 | ~6.0 | ||
20 | ~1.5 | ||
1 | 72 | ~6.0 | |
37 | ~3.0 | ||
20 | ~1.0 | ||
SL_RTL_CS_ALGO_MODE_REAL_TIME_BASIC | 4 | 72 | ~188.0 |
37 | ~40.0 | ||
20 | ~13.5 | ||
2 | 72 | ~91.5 | |
37 | ~22.0 | ||
20 | ~7.1 | ||
1 | 72 | ~45.0 | |
37 | ~10.2 | ||
20 | ~3.6 |
Note that the calculation time scales linearly with the distance. For example, when using SL_RTL_CS_ALGO_MODE_REAL_TIME_FAST, expect the calculation time to increase by approximately 0.3 ms per meter.
Reflector Current Consumption#
Similar to the update rate, the reflector's current consumption is affected by the chosen channel sounding procedure interval, number of connections, connection interval, number of antenna paths, PHY, and the number of channels used for channel sounding.
The reflector application used in these current measurements is based on the bt_cs_soc_reflector sample app, with the following configurations differing from the default settings:
TX Power set to 10 dBm
Application log disabled (APP_LOG_ENABLE = 0)
EM2 debug access disabled (SL_POWER_MANAGER_INIT_EMU_EM2_DEBUG_ENABLE = 0)
PTI disabled (rail_util_pti is excluded from the project)
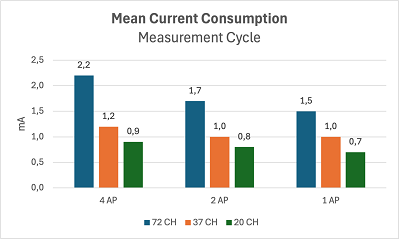
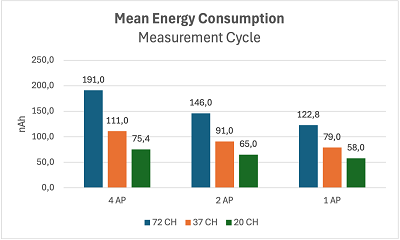
The table below provides the current consumption of the reflector from one whole CS measurement cycle, where:
Max connection count = 1
Connection interval = 20 ms
CS Procedure interval = 15
Max procedure count = 0 (free running mode)
Reference Board | Number of Antenna Paths (NAP) | Number of Channels | Mean Current Consumption (mA) | Mean Energy Consumption (nAh) |
|---|---|---|---|---|
BRD2606A | 4 | 72 | ~2.2 | ~191.0 |
37 | ~1.2 | ~111.0 | ||
20 | ~0.9 | ~75.4 | ||
2 | 72 | ~1.7 | ~146.0 | |
37 | ~1.0 | ~91.0 | ||
20 | ~0.8 | ~65.0 | ||
1 | 72 | ~1.5 | ~122.8 | |
37 | ~1.0 | ~79.0 | ||
20 | ~0.7 | ~58.0 | ||
BRD4198A | 1 | 72 | ~1.3 | ~109.5 |
37 | ~0.8 | ~70.1 | ||
20 | ~0.6 | ~51.2 |
Current Profile#
The current profile of the reflector during a CS measurement cycle can be divided into 5 sections, where the arrow-markers (1 and 2) specify the start and end of one whole CS measurement cycle:
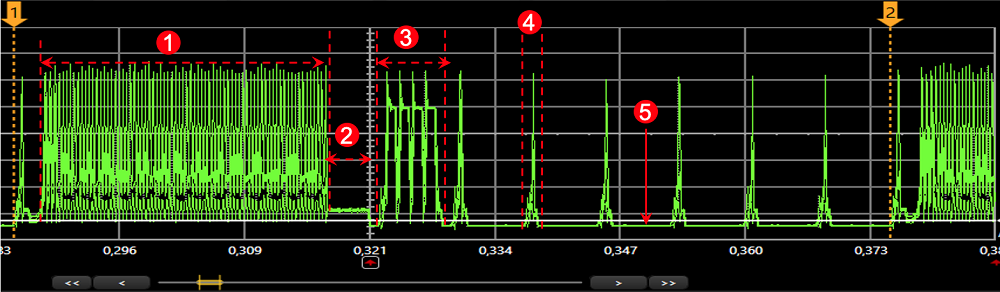
CS Procedure
HCI Event Generation
IQ Data transmission to the initiator
Empty PDU connection events
EM2 Sleep
EM2 Sleep Current#
Reference Board | EM2 Sleep Current (uA) |
|---|---|
BRD2606A | ~6.6* |
BRD4198A | ~4.2 |
Note: BRD2606A is known to have a higher EM2 current consumption compared to BRD4198A. This is due to an inverter that is required for the antenna switching circuit.**
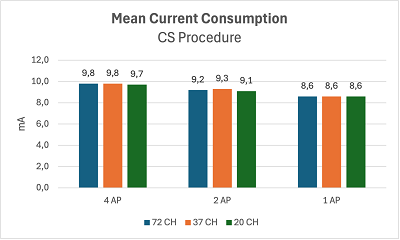
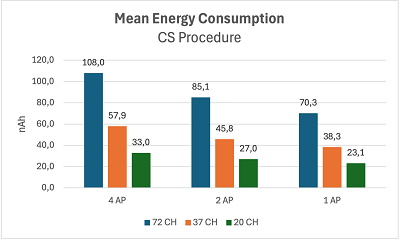
Reflector Current Consumption vs Number of Antenna Paths and Channels#
The following figures visualize how the number of channels and antenna paths affect the current and energy consumption for specific sections of the CS measurement cycle:
CS Procedure#
HCI Event Generation#

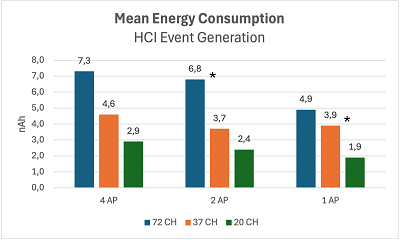
* Empty PDU interrupting the data processing.
IQ Data Transmission#
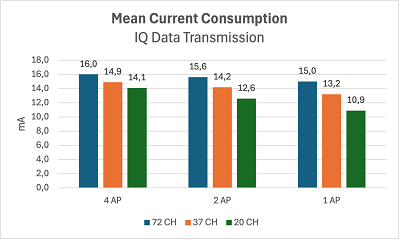
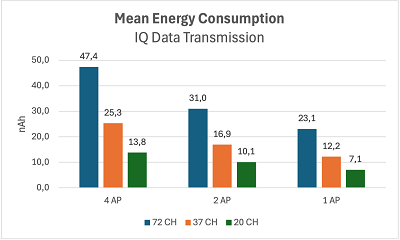
CS Measurement Cycle#