Session 4: Z/IP and Z-Wave Traffic Analysis#
This session involves Z-Wave over IP and Z-Wave traffic analysis, which means looking at the interfaces between the individual blocks in the Z-Wave controller stack.
Collecting Data at the Transition between Individual Components#
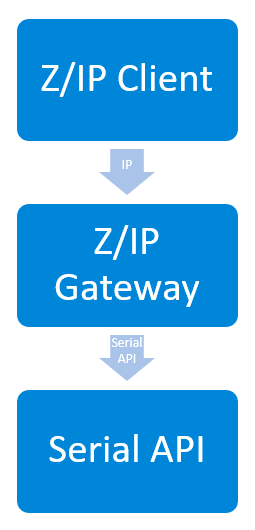

In the Z-Wave implementation, the Z-Wave module (the USB key in the developer kit), runs the serial API firmware that exposes the serial API interface to Z/IP Gateway. Serial API data can be captured using a COM port sniffer.The next layer down from the Z-Wave module is the Z-Wave RF interface where traffic can be captured using the Zniffer. Data about the status of Z/IP Gateway can be captured from Z/IP Gateway's log file. Between the Z/IP clients and Z/IP Gateway is the IP layer, where traffic can also be captured. When working with these components, it is often necessary to capture both the input and the output of the Z/IP Gateway. To analyze, it is typically necessary to look at both the Wireshark trace, to see the traffic between Z/IP client and Z/IP Gateway, and the Zniffer trace, to see the RF traffic, and Z/IP Gateways log file in order to fully understand what the state is, and what may be triggering a specific state.
Z/IP interface between Z/IP Client and Z/IP Gateway
Serial API, between Z/IP Gateway and Z-Wave hardware module
Z-Wave RF interface
Z/IP Gateway a look at logs, IP trace and Zniffer#
You should look at all of these interfaces because, depending on what needs to be diagnosed, different information is visible on different interfaces. For example, looking at the PCAP from Wireshark showing the IP traffic during a Z-Wave inclusion, you can see the network management command class commands, and they can be seen in the zipgateway.log as well. However, you can't see the resulting Z-Wave commands sent on the RF interface. This data has to be captured separately to have full visibility of the current state. The same is true for Z-Wave inclusion and S2 security inclusion, whereas for runtime Z-Wave traffic, where a Z/IP client is sending application payloads to a Z-Wave node, the traffic can be seen on all layers.
PCAP | zipgateway.log | Zniffer trace | |
|---|---|---|---|
Network management commands | x | x | |
Z-Wave inclusion | x | x | |
S2 boot strapping | x | x | |
Runtime communications | x | x | x |
Finding Information about which Data to Collect#
The first part of this section is revisiting section 2, which describes the contents of Z/IP Gateways log file. The log file provides an insight into where to find the information about which data to collect on IP and Z-Wave interfaces. If a Zniffer trace is required, it is helpful to know the home and node IDs to filter Z-Wave traffic. In the same way, if looking to capture traffic on the IP layer, you need to know the IP addresses, either IPv6 or IPv4 depending on the network configuration, to filter out the relevant traffic. As if just capturing all data arriving on the IP interface, it will typically result in mostly traffic unrelated to Z-Wave.
A Look into zipgatway.log - Header#
ESC[32;1m36037 Starting zipgateway ver7_11.02 build ver7_11.02
ESC[0mESC[32;1m36037 Resetting ZIP Gateway
ESC[0mESC[32;1m36037 Using serial port /dev/ttyACM0
ESC[0mESC[32;1m36153 500 series chip version 0 serial api version 8
ESC[0mESC[32;1m36161 I'am SUC
ESC[0mESC[34;1m36335 Key class 80
ESC[0mBD4682167F13D13CACB0B6898C35FB1F
ESC[33;1m36339 sec0_set_key
ESC[0mESC[34;1m36351 Key class 1
ESC[0m283B6DEE0124DE5ADA046F2B49F88030
ESC[34;1m36360 Key class 2
ESC[0mAE66D6B35136A3CEDAA1014853A357E2
ESC[34;1m36368 Key class 4
ESC[0m287000AA28A2A2459265C2ABF31EAF74
ESC[32;1m36372 Network scheme is:ESC[0mESC[32;1m36372 S2 ACCESS
ESC[0mESC[34;1m36375 Resetting IMA
ESC[0mESC[34;1m36375 Indicator blink script from config file (not sanitized): zipgateway_node_identify_generic.sh
ESC[0mESC[32;1m36375 Using indicator blink script: /usr/local/etc/zipgateway_node_identify_generic.sh
ESC[0mESC[32;1m36375 I'm a primary or inclusion controller.
ESC[0mESC[32;1m36383 Command classes updated
ESC[0mESC[34;1m36387 nodeid=1 0x00
ESC[0mESC[34;1m36395 Waiting for bridge
ESC[0mESC[32;1m36406 Version: Z-Wave 6.04, type 7
ESC[0mESC[34;1m36435 ...... Firmware Update Meta Data command class version: 0 ......
ESC[0mESC[34;1m36439 Magic check 191da1 == 191da1
ESC[0mESC[34;1m36443 NVM version is 2
ESC[0mESC[32;1m36457 L2 HW addr ESC[0m00:1e:32:14:6d:c2
ESC[32;1m36457Hardware generation
Protocol version
Network capabilities
SUC/SIS
Inclusion controller
Secondary controller
Security
Keys
highest granted key
Zipgateway.log, Header - Continued#
ESC[0mESC[34;1m36457 ZIP_Router_Reset: pan_lladdr: f4:cd:ab:f5:00:01 Home ID = 0xf5abcdf4
ESC[0mESC[32;1m36457 Tunnel prefix ESC[0m::
ESC[32;1m36458 Lan address ESC[0mfd00:aaaa::03
ESC[32;1m36458 Han address ESC[0mfd00:bbbb::01
ESC[32;1m36458 Gateway address ESC[0mfd00:aaaa::1234
ESC[32;1m36458 Unsolicited address ESC[0mfd00:aaaa::4ec1:e0c1:6c58:753a
dynamic
ECDH Public key is
00212-31828-39607-45613-
46794-62324-17693-33451-
51881-56367-41919-19511-
36433-22301-05718-64029-
ESC[32;1m36647 DTLS server started
ESC[0mESC[33;1m36647 mDNS server started
ESC[0mESC[32;1m36647 DHCP client started
ESC[0mESC[34;1m36647 Starting zip tcp client
ESC[0mESC[32;1m36647 ZIP TCP Client Started.
ESC[0mESC[32;1m36647 No portal host defined. Running without portal.
ESC[0mESC[32;1m36665 DHCP client started
ESC[0mESC[34;1m36665 Found storage file /usr/local/var/lib/zipgateway/provisioning_list_store.dat
ESC[0mESC[34;1m36665 Using file /usr/local/var/lib/zipgateway/provisioning_list_store.dat for provisioning list storage.
ESC[0mESC[34;1m36686 Imported 0 provisions, stored 0
ESC[0mfd00:aaaa::03
fd00:bbbb::01
fe80::21e:32ff:fe14:6dc2
ESC[32;1m38557 Comming up
ESC[0mtemp_assoc_virtual_nodeids (4): 2 3 4 ... 5
ESC[32;1m38599 virtual_nodeid_init_count: 4
ESC[0m903
ESC[32;1m38605 Bridge init done
ESC[0mESC[32;1m38609 HomeID is f5abcdf4 node id 1Home ID
Node IDs
Virtual nodes
The virtual node ID provides a lot of information about the network and gateway usage
Collecting IP Traffic#
Collection of IP traffic is typically done using either TCPdump or Wireshark.
Tools#
Wireshark is used in the examples because it has a graphical user interface. However, the same captures can be done using TCPdump. The main benefit of TCPdump is that it is very light weight and has a small footprint enabling it to run on embedded Linux platforms. It can even be used to stream data off the embedded platform to Wireshark running on a remote host, using a SSH tunnel if required for remote debugging.
TCPdump
Wireshark
Z/IP Frame types#
Z/IP frames have two frame types. The zip packets, which have previously been described, with the header field, 0x23 0x02, which is for Z-Wave payloads, and the zip keep alive, 0x23 0x03, which does not carry any payload, but is used to keep security sessions, such as DTLS, going.
COMMAND_ZIP_PACKET
0x23 0x02COMMAND_ZIP_KEEP_ALIVE
0x23 0x03
Decrypting IP Traffic#
When working with IP traces, it is crucial that the DTLS (or TLS) handshake is included in the trace. If the handshake is not captured, it is impossible to decrypt any subsequent frames despite having the key, and it will be impossible to tell anything about the payloads. This is a similar to working with S2 on the Z-Wave RF interface, where you also have to capture the initial nonce exchange to decrypt the frames.
Wireshark can decrypt
DTLS
TLS
Handshakes must be included in the trace.
Capturing Traffic with Wireshark#
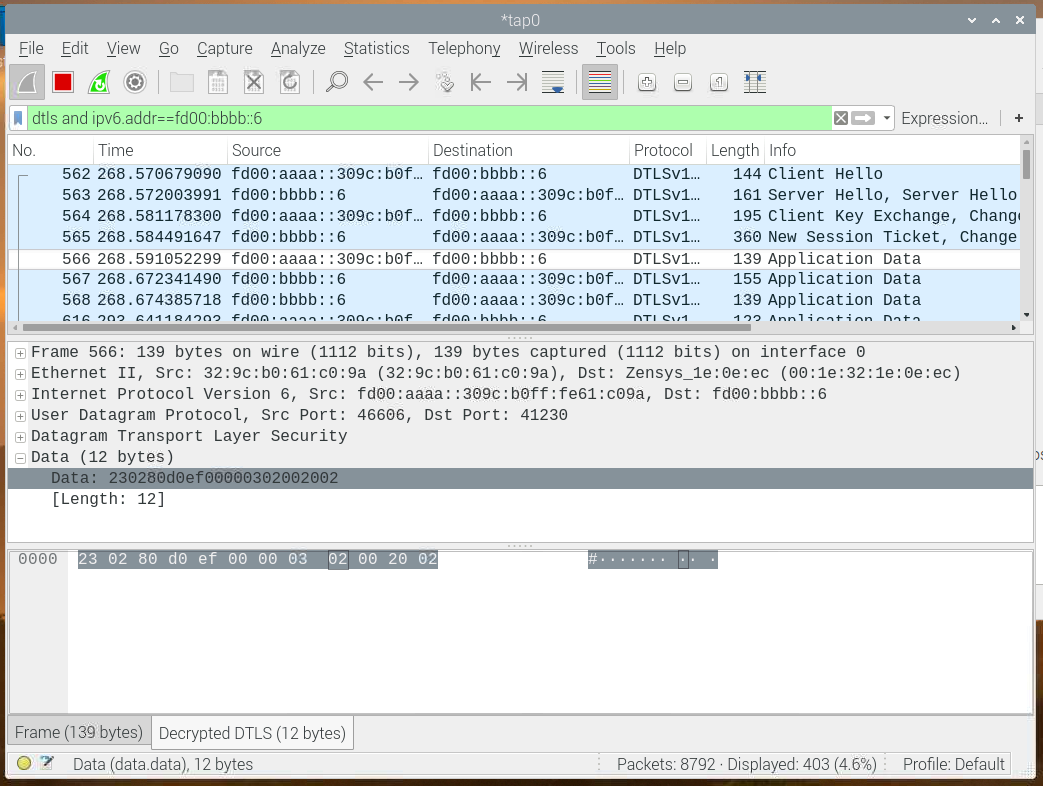
Below is an image of Wireshark showing a capture including the handshake. At the top is the initial DTLS handshake with the client hello, and server hello, client key exchange, a few frames, and then actual application data. In this image, Wireshark has been configured to decrypt the traffic, so the payload can be seen. It includes a Z/IP packet starting with 0x23 0x02, then it has 0x80, ACK request, 0x0b, which from the spec means, header extension included, Z-Wave command included and secure origin, 0xef sequence number, source and destination endpoints, and header extension, which can also be found in the command class spec, it is length 0x03, type 0x02; installation and maintenance get, which is covered later. Finally, the Z-Wave command, 0x20 0x02, Basic get. This is how to work through the Z/IP frames, byte by byte, manually.

Example: Sending a Get and Receiving a Report#
This is the very same frame exchanged as shown above, which will be decoded in detail. This example covers sending a get, the first frame (line), and then, receiving a report back.
230280d0ef00000302002002
23024090ef00001e031b00010001020001020500000000000305d07f7f7f7f040100050100
230200d01e000005840202002003000000The outgoing get:#
230280d0ef0000|030200|2002This is the get command, sent from the Z/IP client. Again, the first byte is 0x23, command class zip, 0x02, zip packet, 0x80, ack request, 0xd0, sequence number, source and destination endpoint, header extension, installations maintenance get, and the command, basic get. As the frame carries and ACK request, the Z/IP client expects to receive an ACK response from the destination.
23COMMAND_CLASS_ZIP02COMMAND_ZIP_PACKET80Ack requestD0Header ext. include | Z-Wave cmd included | secure orginEfSeq No0000Source End Point | Destination End Point
03Header Extension Length02INSTALLATION_MAINTENANCE_GET00Option length
20COMMAND_CLASS_BASIC02BASIC_GET
Z/IP ACK#
The next frame is an ACK command.
23024090ef0000|1e031b00010001020001020500000000000305d07f7f7f7f040100050100Again beginning with 0x23 0x02, command class Z/IP, zip packet, the next byte has value is 0x40, bit 7 is set, meaning "ack response". 0x90, header extension included, from a secure origin, notably this frame does not carry any Z-Wave payload, it is just an ACK to a previous frame. Next byte is the sequence number 0xEF. If going backto the previous frame, it can be seen that the ack request and ack response sequence numbers are identical. Z/IP Gateway and the Z/IP clients use the sequence number and the source and destination addresses to determine which frame and ack response belongs to.
This frame carries a very long header extension. For educational purposes, |-characters have been inserted where the header ends, and the header extension begins.
23COMMAND_CLASS_ZIP02COMMAND_ZIP_PACKET40Ack response90Header ext. included | secure originEfSeq No0000Source End Point | Destination End Point
1e031b00010001020001020500000000000305d07f7f7f7f040100050100Header extension – see below!
IME Header Extension#
1e031b00010001020001020500000000000305d07f7f7f7f040100050100First byte is 0x1e, the header extension length. This is not relevant when the frame does not carry any Z-Wave payloads. If carrying a Z-Wave payload, the header extension indicates where the payload begins. Next, is the type of header extension, installation, and maintenance report. If going back to the outgoing command, it includes an installation and maintenance get, and therefore the report is included in the ACK frame. The installation and maintenance data indicate a lot about the Z-Wave network RF performance, which can be used to determine the health of the network. The header extension can be parsed by looking into the header extension fields from the command class spec. These are multiple different options, put together in a type, length, and value structure. The first type 0x00, route change, length 1, and false, meaning that the route did not change. The transmission time given in milliseconds, last working route used, length 5, and in this case all zeros. If having a Z-Wave network using multiple repeaters, this field would indicate about which repeaters where used. Then, the RF RSSI levels that tell the signal strength on the RF interface. In this case there is one value, as 0x7f means RSSI_NOT_AVAILABLE, but if routing using multiple Z-Wave repeaters more RSSI values will be present. Then, the channel used to receive the ACK, and the channel used to transmit the frame. In all, a lot of information about the performance of the Z-Wave network.
1eHeader Extension Length03INSTALLATION_MAINTENANCE_REPORT1bOption Length00Route Changed01IME – Length00False
01Transmission Time (TT)02IME – Length0001[ms]
02Last Working Route (LWR)05IME – Length0000000000Repeaters 1-4|speed
03RSSI05IME – LengthD07f7f7f7f
04ACK channel0100
05Transmit channel0100
Incoming Report#
Finally, this is an example of the incoming report.
230200d01e000005840202002003000000Again, starting with 0x23 0x02, command class zip, zip packet. The first byte is zeros, as the gateway has no way of reporting failed delivery on the IP layer to a Z/IP node, it does not request an ACK, and none of these flags are set. The next byte is 0xd0, which indicates that a header extension is included, a Z-Wave command is included, and the frame is originating from a secure origin. Then, follows the sequence number, which is not particularly interesting unless looking for retransmissions, as this frame is not requesting an ACK. The source and destination endpoints are next, all zeros, which is expected, as the initial get frame was sent to endpoint zero, from endpoint zero. Then, you see a new header extension, 0x05840202 where the first byte indicates whether it is a critical header extension that must not be ignored, which is the case here. Type 0x04 is the encapsulation format information. The length is 0x02, and the payload, which security key class is used, in this case S2 authenticated. The last byte indicates whether the CRC16 command class was used. In this case, you can see the header extension being used on an incoming frame, but it may also be used by a Z/IP client to specify transmission using a specific key class. When looking at Wireshark traces, this is seen from time to time, because there are certain situations where it is a Z-Wave certification requirement to send specific frames with specific key classes, depending on the situation. Then, finally, you see the Z-Wave payload, 0x20, command class basic, 0x03, basic report, first byte current value, and target value and duration. In this case, the device is currently off, and is set to be off, so it will not change.
23COMMAND_CLASS_ZIP02COMMAND_ZIP_PACKET00D0Header ext. included | Z-Wave Cmd Included | Secure Origin1eSeq No0000Header ext. included | secure origin
05Header Extension Length84Critical | ENCAPSULATION_FORMAT_INFO02Option Length02S2_AUTHENTICATED00
20COMMAND_CLASS_BASIC03BASIC_REPORT00Current Value00Target Value00Duration
Serial API#
The serial API is a low-level interface between the Z/IP Gateway and the protocol stack running on the Z-Wave module.
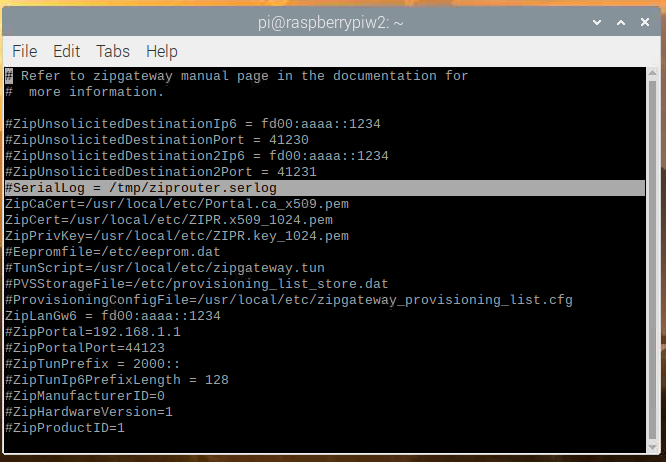
It is very rare that this interface needs to be parsed for debugging purposes. If it is required to capture data, there is an entry in the gateway configuration file to enable it. It is by default commented, but logging can be enabled by uncommenting the entry. Z/IP Gateway will log the traffic on the serial interface to a separate log file.

Secure Runtime Communications (S0)#
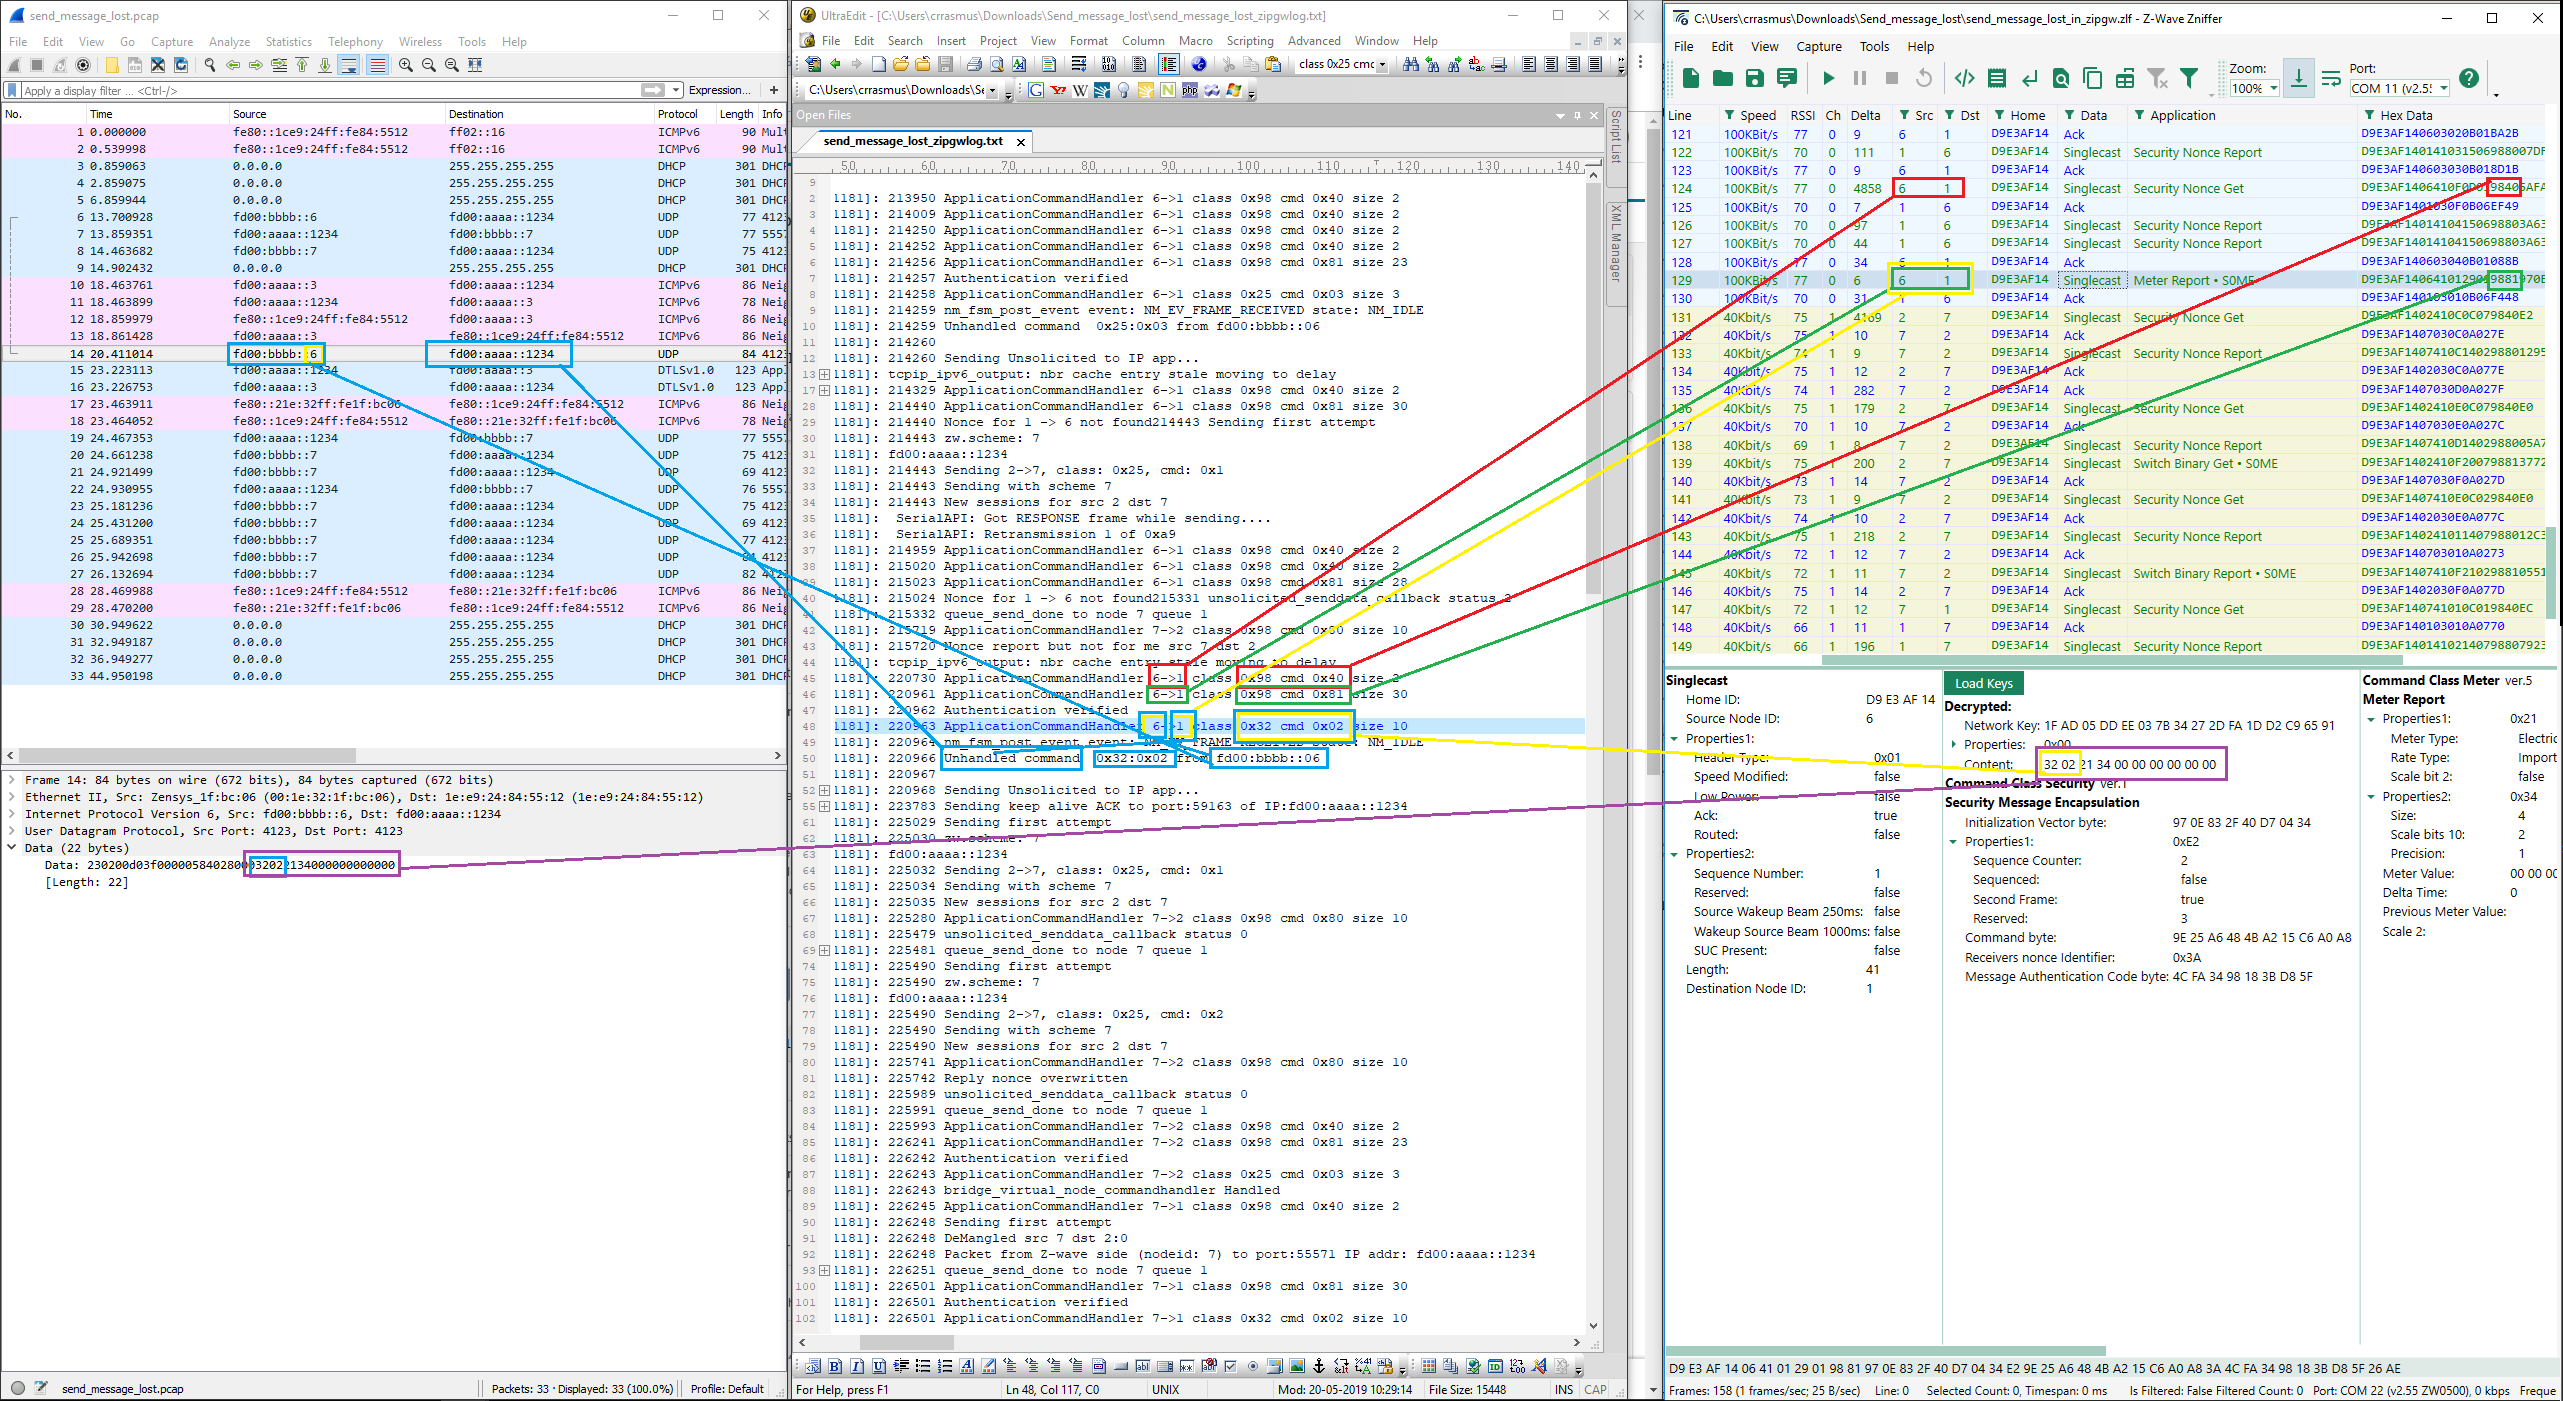

This figure shows an example of correlating traffic between Wireshark, zipgateway.log, and the Zniffer. Note the two connected purple boxes on the bottom, which represent the full payload that travels from the end device on the right hand side, through the Z/IP Gateway, to the Z/IP client, on the left hand side. This example is using S0, so it takes significantly more frames than unsecure or S2 because a nonce exchange is required for each payload.
S2 Bootstrapping from Z/IP Gateway#
This is the way S2 inclusion looks from the Z/IP Client, the controller, Z/IP Gateway, and from the joining node. From the Z/IP client, it is a question of starting the process granting the keys, setting the DSK, and receiving a status back. Whereas, between Z/IP Gateway and the node, a lot of frames are exchanged to include the device, start the security inclusion, and grant the keys.
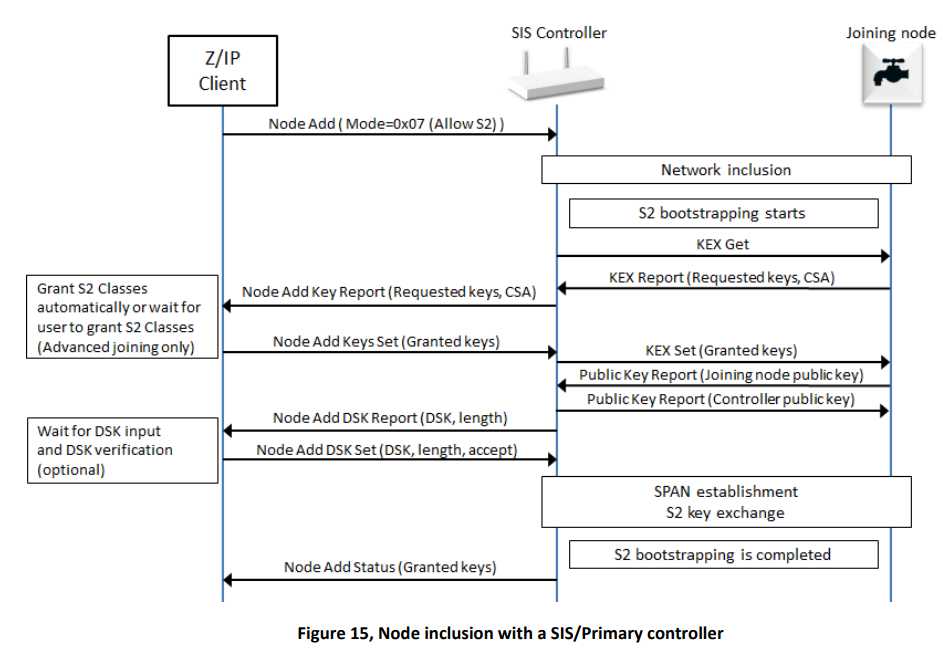

S2 Bootstrapping, Z-Wave Layer#
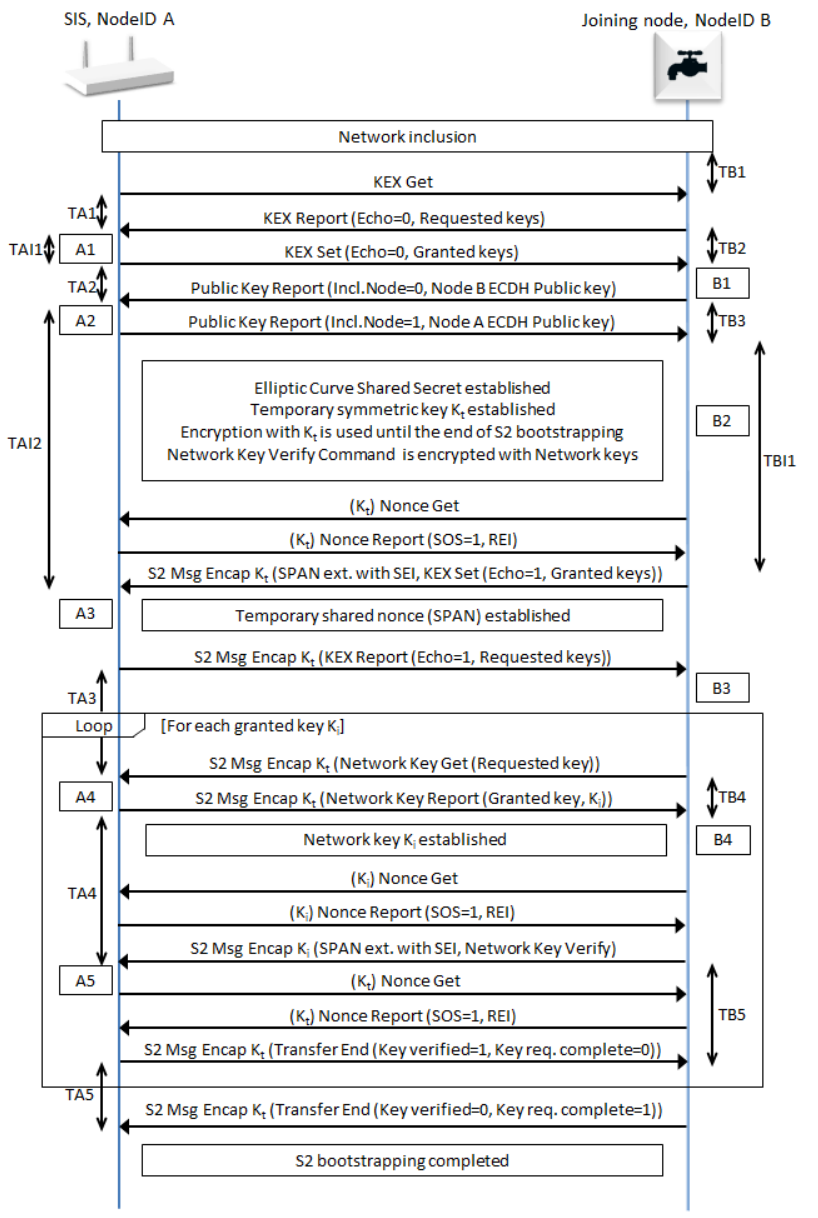
If looking into the security specifications, this is the actual frame flow, where the last part may be repeated multiple times depending on how many keys where granted. This is an indication that there is a huge difference in what is seen on the individual layers, and that everything is not always reflected on all layers. Having the gateway log provides an insight into the process. Having the Wireshark trace and the Zniffer provides even more insight into the process. The more data is available, the better an understanding of the current state and how to reproduce it.
