Using Network Analyzer for Bluetooth Mesh Traffic#
Overview#
Simplicity Studio® 5 Network Analyzer enables debugging complex wireless systems. This tool captures a trace of wireless network activity and provides a comprehensive way to analyze it. This lab focuses on learning about the Network Analyzer GUI and how to use it for effective troubleshooting.
Topics#
Configuring PTI interface
Advanced features of the Simplicity Studio 5 Network Analyzer
Provision a Bluetooth Mesh network with a smartphone
Analyzing BT Mesh traffic on multiple adapters simultaneously
Importing encryption keys to Network Analyzer from a smartphone
Capturing packet trace on a custom hardware
Getting Started#
Ensure that you have the correct hardware and software to successfully complete the lab.
Prerequisites#
For this lab, you will need the following:
EFR32BG22 Thunderboard (SLTB010A). Most of the lab is achievable with one board, but, if possible prepare two boards.
Micro-USB to USB Type-A cable, which is not a power cable. This cable is not included with the Thunderboard. It must include data lines.
Simplicity Studio v5
Gecko SDK Suite 3.2.1 or later
Bluetooth Mesh SDK 2.1.1 or later
Bluetooth Mesh by Silicon Labs Mobile App
Accept Location Access. “While using the App” will work. This is required for the Traffic Browser.
Network Analyzer#
With Network Analyzer, users can tap into the data buffers of the radio transceiver via a dedicated serial hardware interface called the Packet Trace Interface (PTI). PTI data can be then transferred via USB or Ethernet to a computer running Simplicity Studio. Finally, the time-stamped data can be interpreted and displayed in Network Analyzer. It is provided as part of the Simplicity Studio tool set.
PTI is an interface, which provides serial data access directly to the radio transmitter/receiver frame controller. Most Silicon Labs’ development kits have the PTI embedded and ready to use. It is also possible to use the network analysis features when working on custom hardware if the PTI pins are exposed via a debug interface. It is implemented in hardware so there is no software overhead for the application.
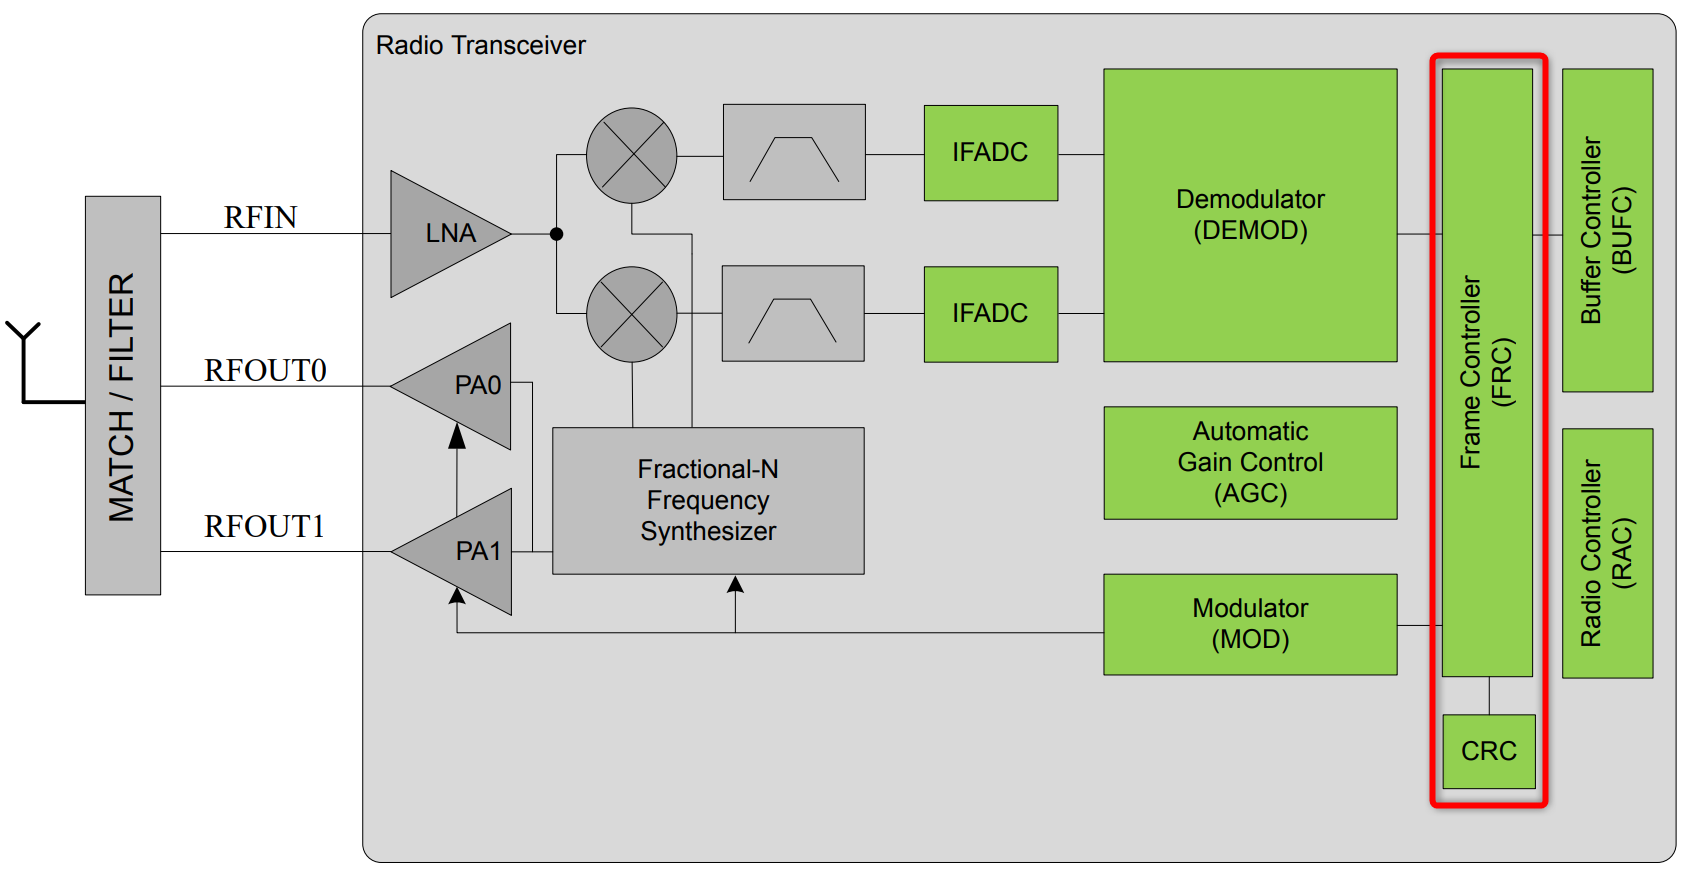

A clock and data signal are connected to the frame controller to monitor all packets received/transmitted by the chip. At the chip level, a signal is dedicated to trigger the timestamping of each PTI frame by the debug adapter. Network Analyzer can capture data from nodes of any connected adapters, either from one node at a time or from multiple nodes. It can display data from Live sessions as well as Recorded sessions. Network Analyzer saves session data to an ISD (.isd) file, which is a compressed file that stores session data and the network state. Network state includes display settings such as map modifications, which the Network Analyzer restores when you reload the session file.
Bluetooth Mesh#
The Bluetooth mesh technology is based on Bluetooth LE advertising packets. Bluetooth mesh traffic is differentiated from the regular Bluetooth LE traffic through the AD types used by the Bluetooth mesh advertising packets. The Silicon Labs Bluetooth mesh stack is an advanced Bluetooth mesh protocol stack implementing the Bluetooth mesh standard. It can run alongside the Bluetooth Low Energy (LE) stack, using a common link layer, which allows using LE features in parallel.
The figure below illustrates the architecture of both Bluetooth LE and mesh technologies as well the supported network topologies. As shown in the figure, Bluetooth LE and Bluetooth mesh share the same RF and link layer but at the upper protocol stack layers differ significantly.
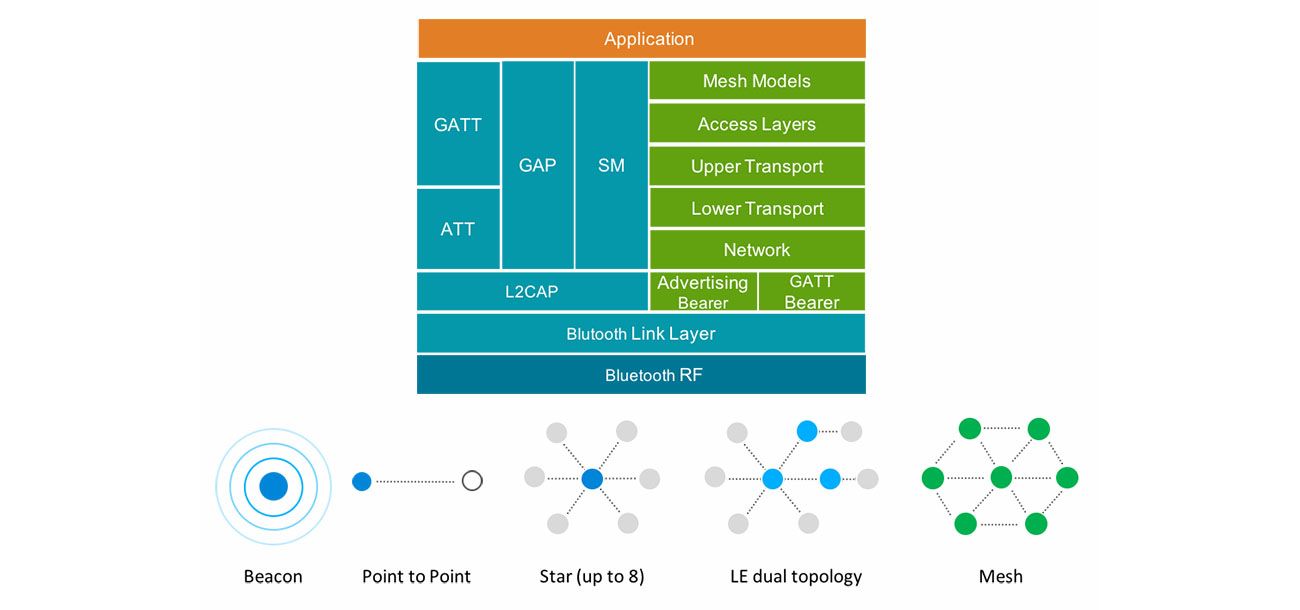

Bluetooth mesh can be used either over the advertising bearer or the GATT bearer. In a typical Bluetooth mesh network, nodes use the advertising bearer to communicate with each other. The advertising bearer uses the Bluetooth LE non-connectable advertisement messages to broadcast messages to all nodes within range. The GATT bearer on the other hand is used to send and receive Bluetooth mesh messages over point-to-point connections using Bluetooth LE GATT based services. The purpose of the GATT bearer is to enable non-native mesh devices like smart phones and tablets to communicate and participate in Bluetooth mesh communications.
Lab#
Set up Thunderboard Kit and Simplicity Studio#
To start the lab, create a Bluetooth Mesh - SoC Sensor Server example, which will generate radio traffic that you will capture with the Network Analyzer. Default project settings ensure that the Thunderboard can be provisioned into a Bluetooth Mesh network using the Mobile app.
Launch Simplicity Studio from your desktop.
Connect the Thunderboard BG22 to your PC using a micro-USB cable.
When the device is connected to your PC, you should see it listed in the Debug Adapters window in Simplicity Studio.
Select the J-link for the device to display the associated Overview, Example Projects, Documentation, and Demos.
Set the preferred SDK to Gecko SDK Suite v3.2.1 or newer.
Ensure that the Secure Firmware Version is the latest one. Read and Update if not displayed.
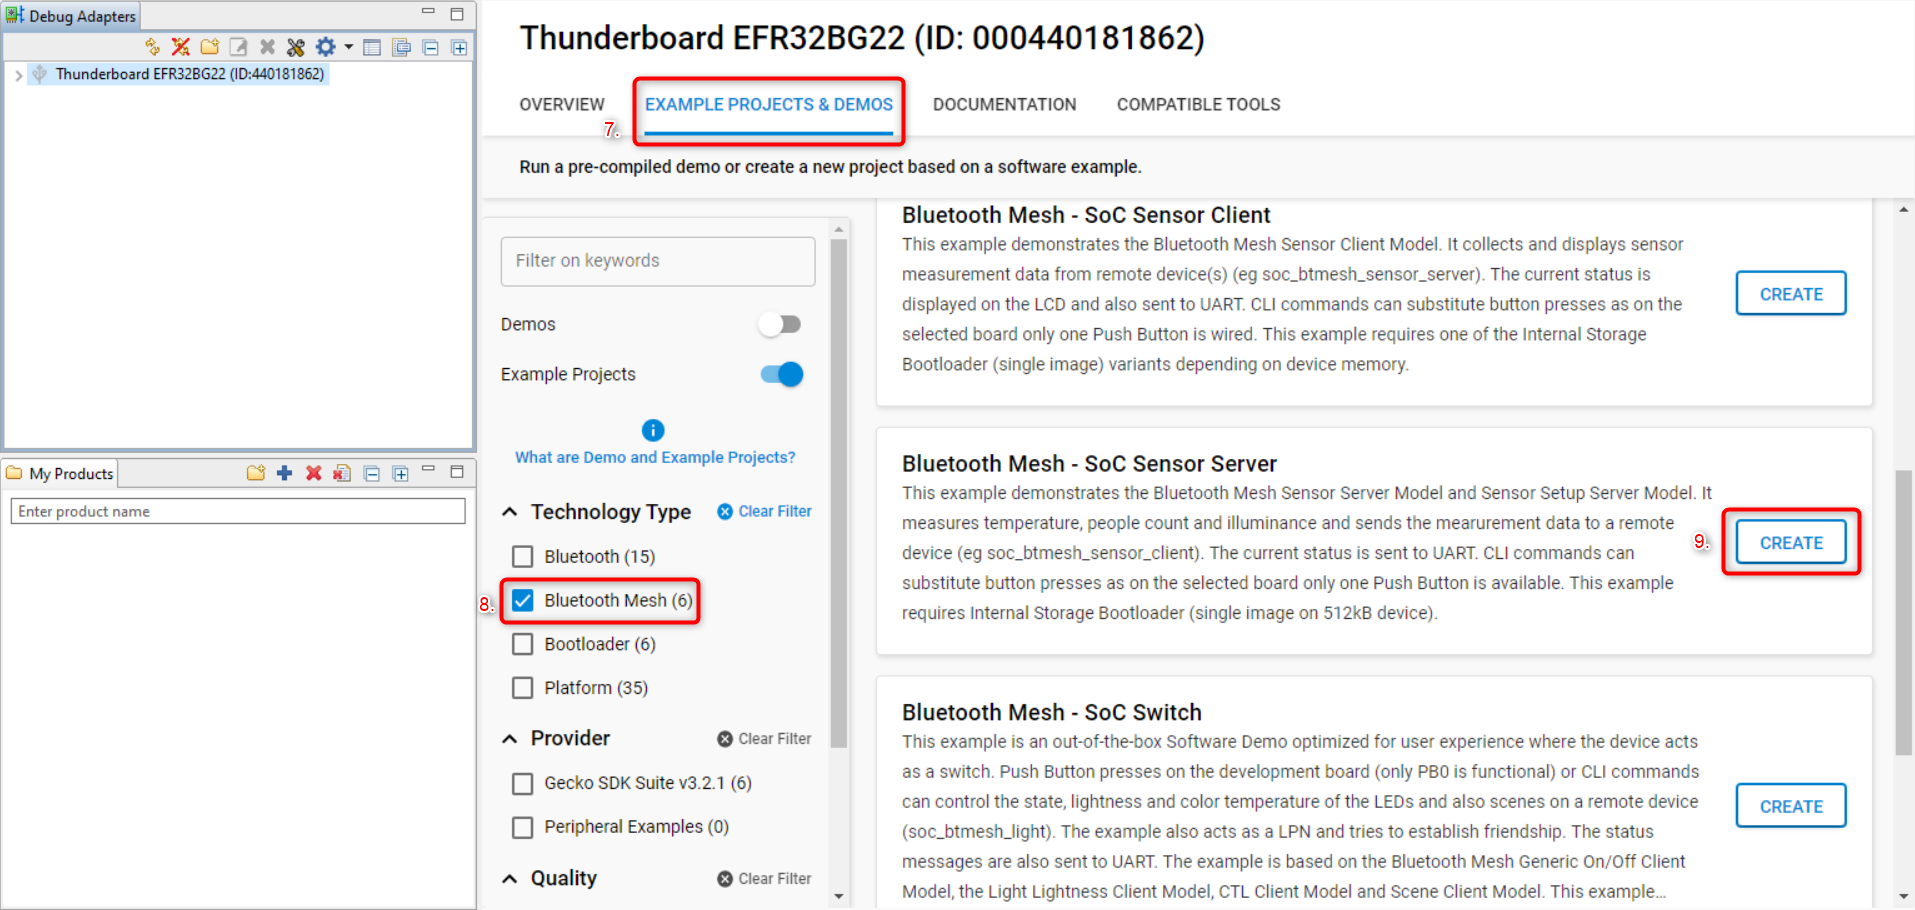
Click on Example projects & Demo’s tab to browse the example projects.
Select “Bluetooth Mesh” from the Technology Type filters.
Select Bluetooth Mesh - SoC Sensor Server from the Bluetooth examples and click Create.

Click “Finish” on the following prompt to create the example project and switch to the Simplicity IDE perspective.
Configure the PTI Interface#
On EFR32 series 1 and 2 devices, a mechanism is provided for the user to tap into the data buffers at the radio transmitter/receiver level. From the embedded software perspective, this is available through the RAIL Utility, PTI component in Simplicity Studio. That component is effectively a simple packet trace interface driver.
By default, all Bluetooth demos and examples have PTI enabled. However, to capture with the device, ensure that you have the RAIL Utility, PTI software component installed.
A single-pin UART signal is used for PTI data transfer. This can be configured in the RAIL Utility, PTI component.
Open the .slcp file (Project Configurator) of the previously created project.
Go to the Software Components tab.
Click on the Platform -> Radio -> RAIL Utility, PTI component.
Click on the Configure button.
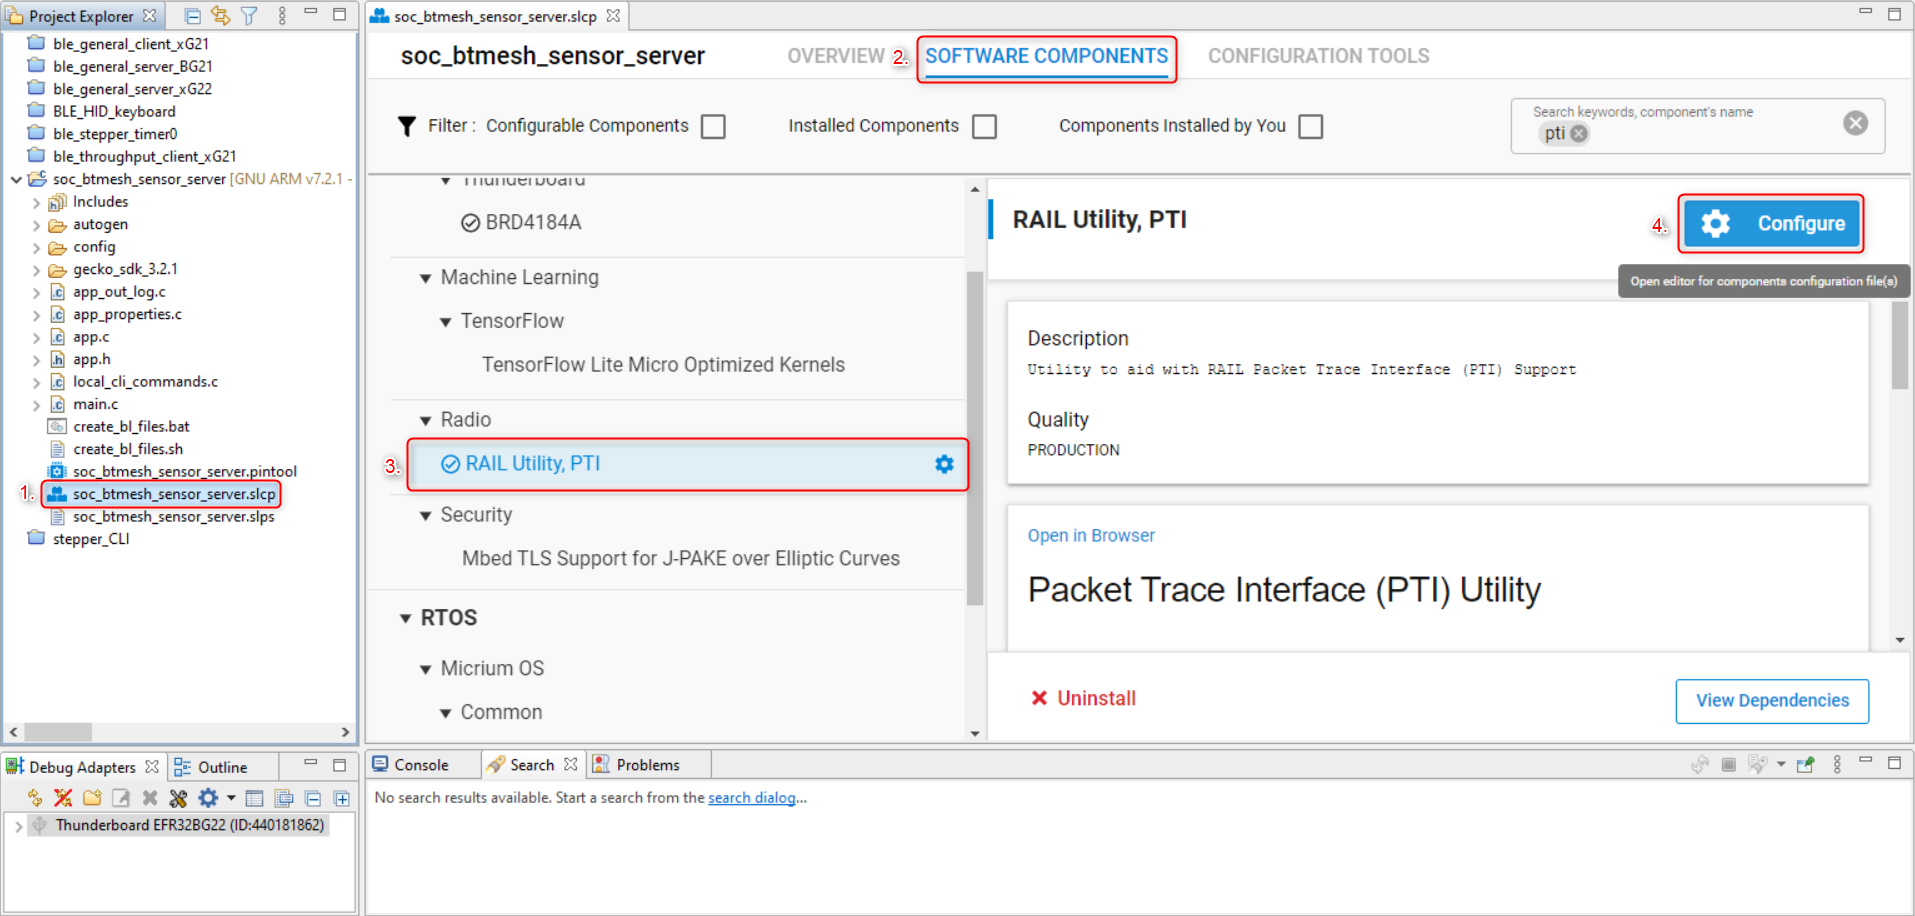

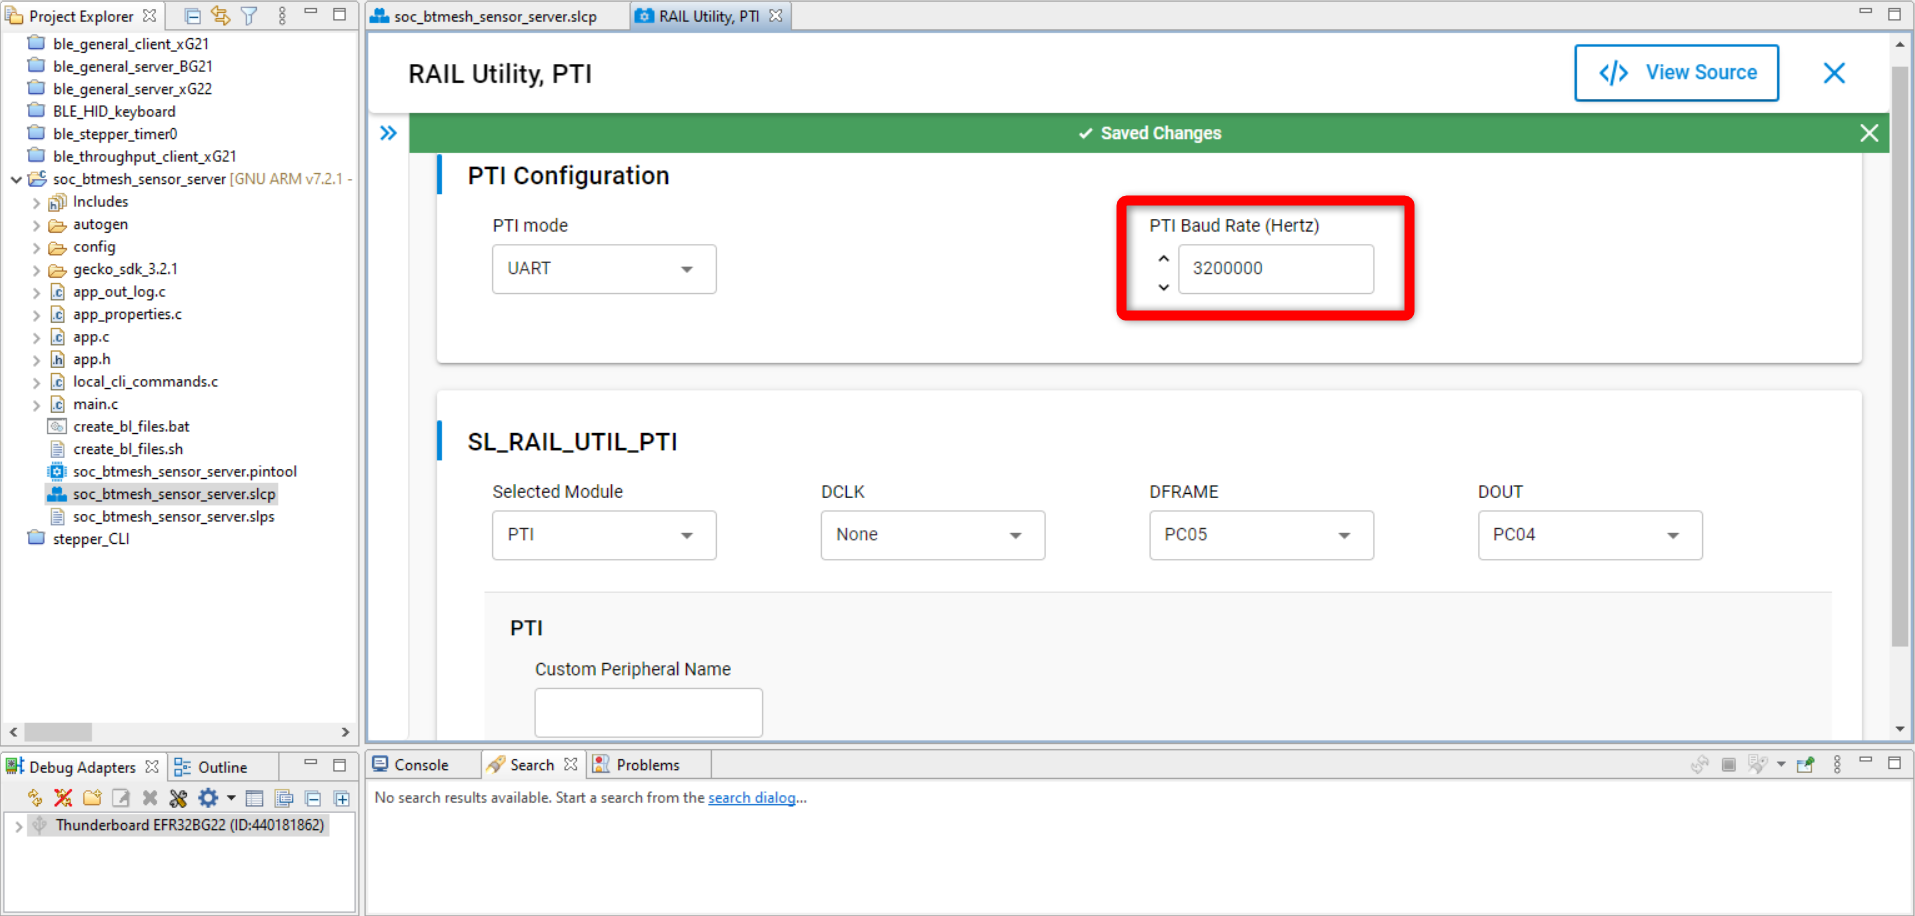
The baud rate is selectable. The default baud rate is 1.6 Mbps. The maximum baud rate is 3.2 Mbps.
Note: when using 2M PHY with Bluetooth Low Energy, the default PTI-over-UART speed (1.6 Mbps) should be increased to a higher baud rate.
Change the PTI Baud Rate (Hertz) field from 1600000 default to 3200000:

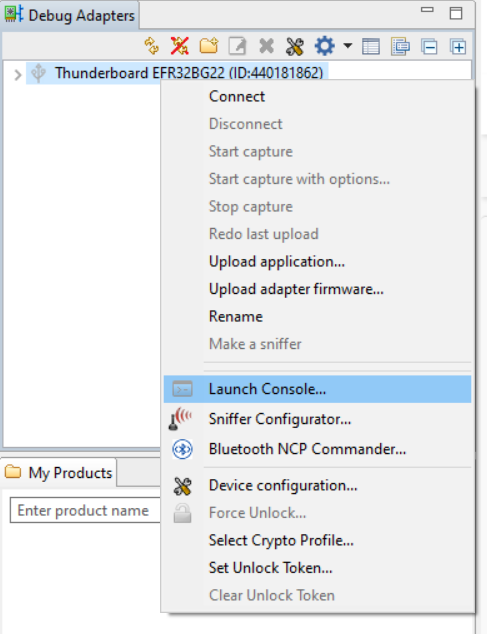
Additionally, the speed at which the PTI frames are forwarded from the EFR32 back to USB/UART must also be increased by setting the PTI config corresponding to your adapter at the correct baud rate through the Admin Console interface.
Right click on the device in the Debug Adapters view and select Launch Console...

Select the Admin tab and execute the following command.
pti config 0 efruart 3200000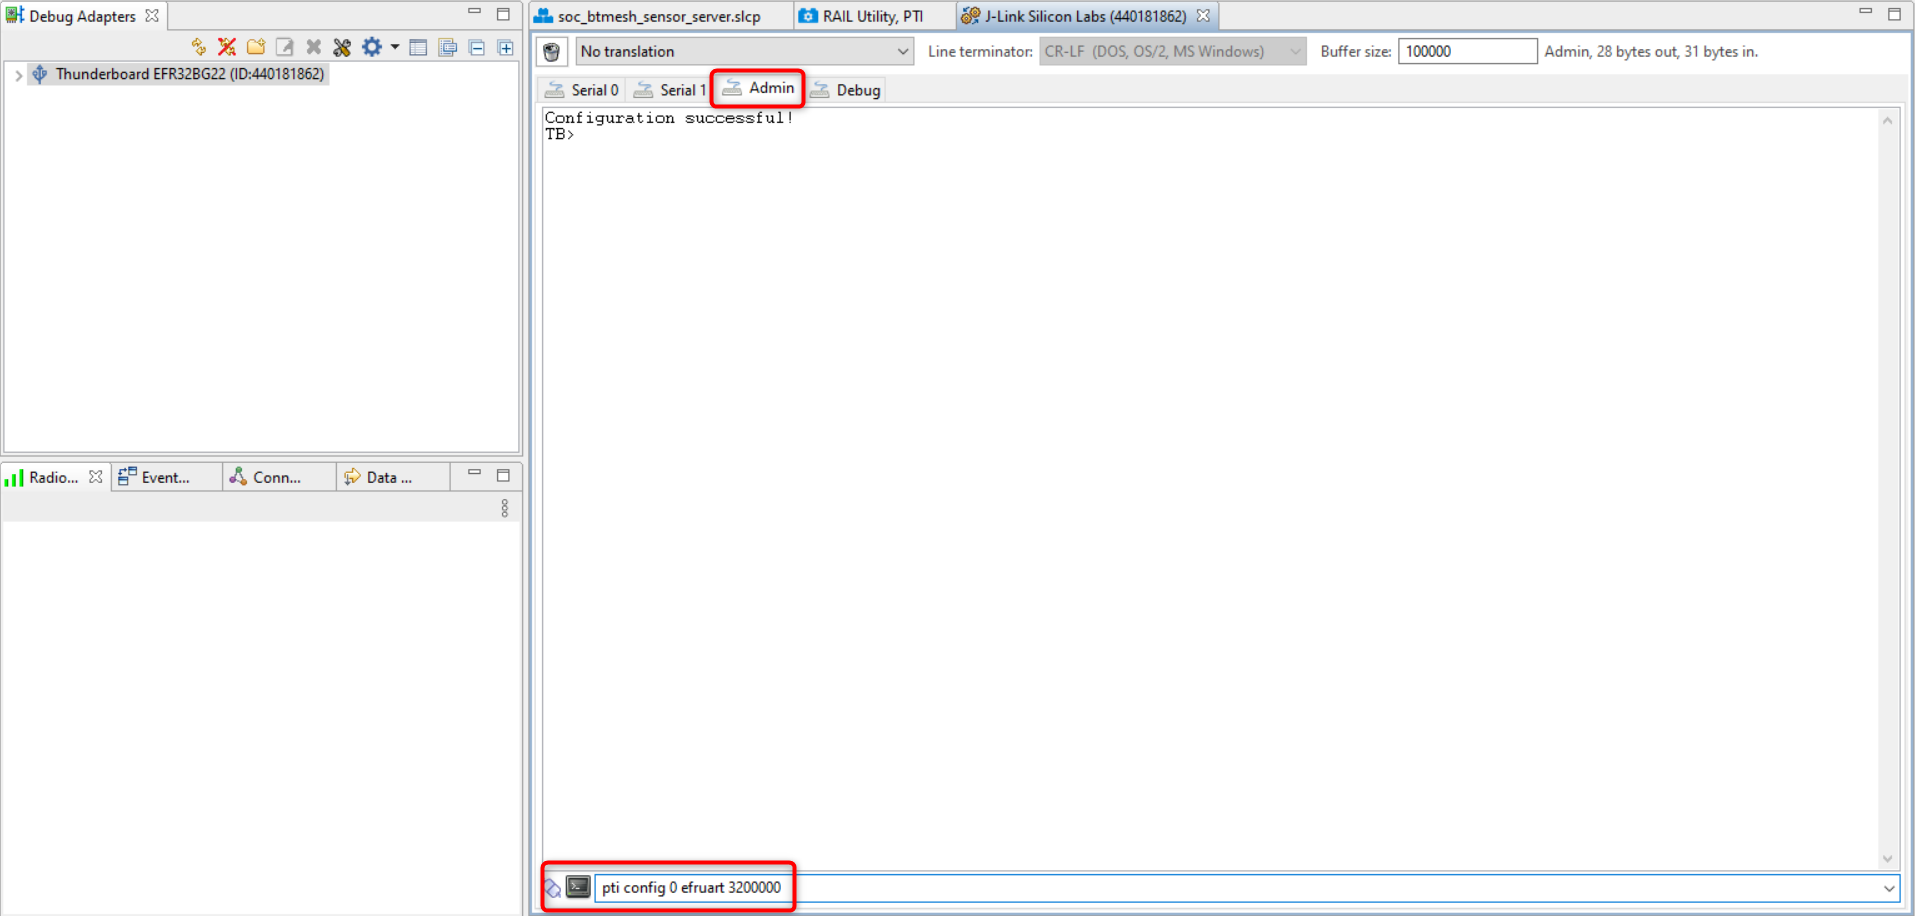

This command will configure the debug adapter part of the Thunderboard. Note that erasing or flashing the target does not have any effect on this configuration.
Close the console.
Switch back to Simplicity IDE tab and build the project by clicking on the hammer icon, which will generate the application image to be flashed to your device.
Flash the application image to your device by going into the project explorer tab. In your project root folder, in the binaries folder, click on the drop down arrow and right click on "soc_btmesh_sensor_server.hex" > Flash to device. Click on the Program button in the pop-up window.
Discover the Basic Capabilities of Network Analyzer#
This exercise describes the main features of the Network Analyzer user interface.
Start a Network Data Capture on the Connected Device#
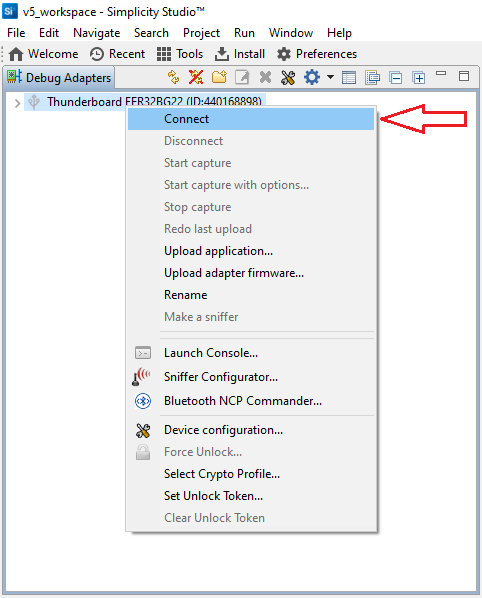
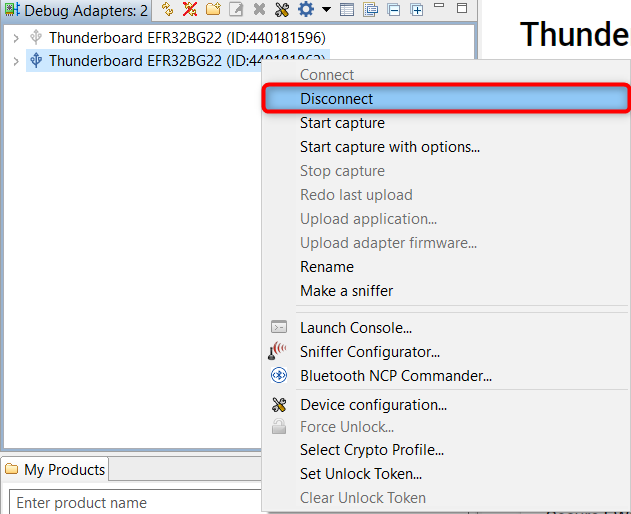
Right click on the device in the Debug Adapters view and press Connect. In this step, you are connecting to the Debug MCU (debug adapter) on the back of the Thunderboard. The 2 PTI signals, which were explained before are connected to this MCU.

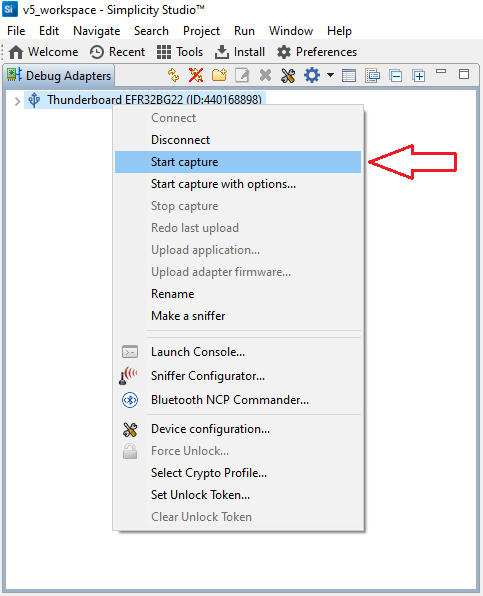
Right click on the device again and press Start capture.

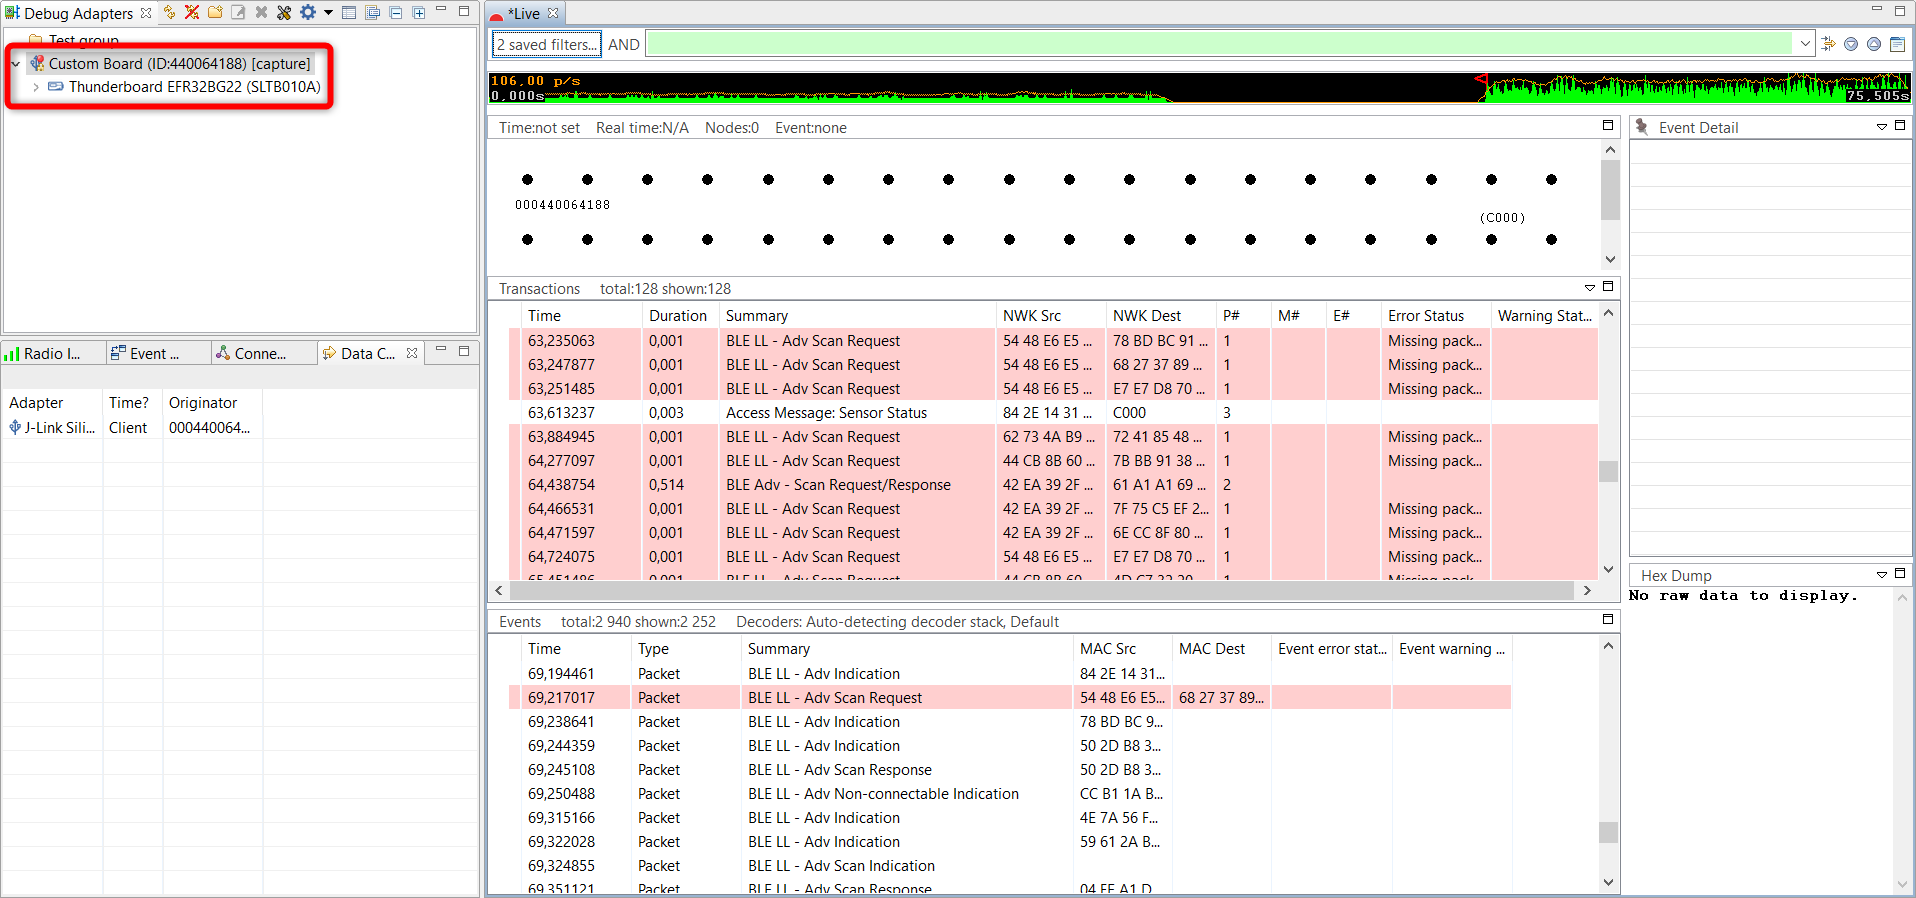
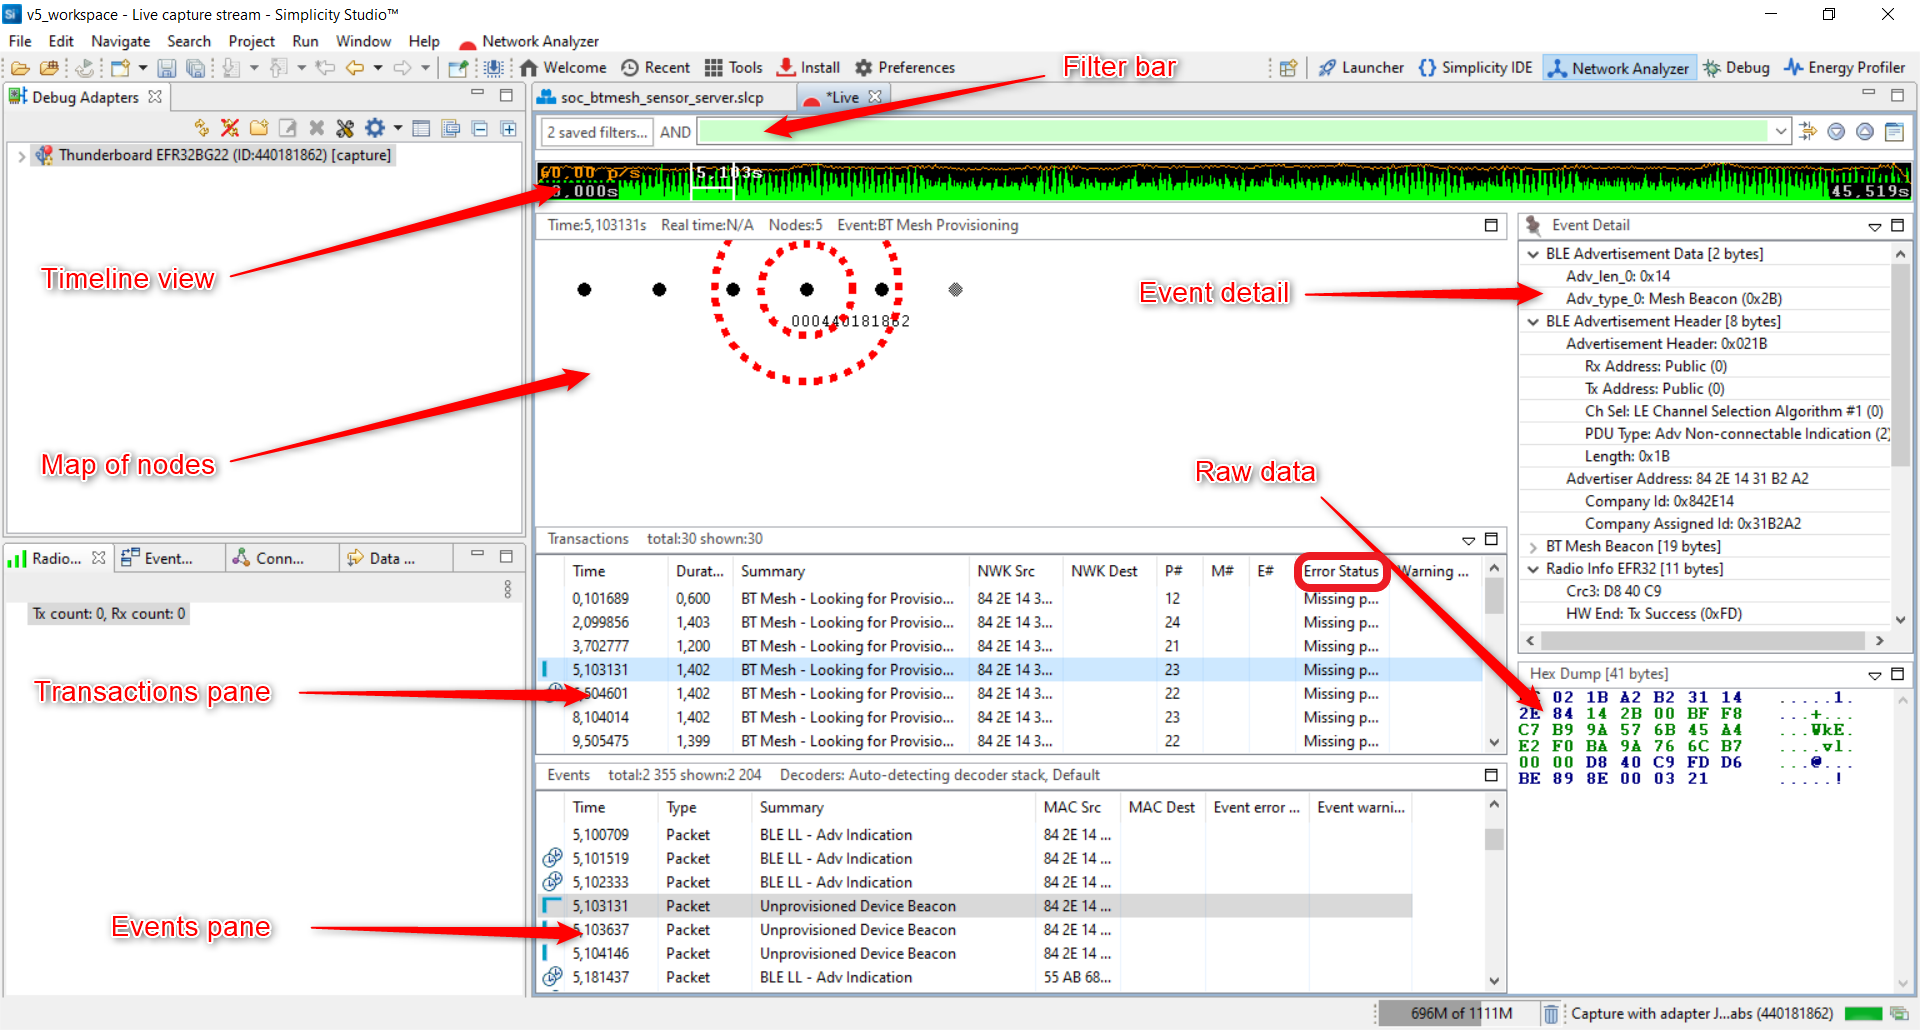
The Network Analyzer view is automatically opened. The basic elements in the GUI are as follows:

Transactions and Events Pane#
The events displayed in the event pane are directly linked to the transactions displayed in the transaction pane. When a transaction is selected, Network Analyzer jumps to the corresponding events in the event pane. In the Error Status field, “Missing packets” indicates that a packet expected in the transaction has not been received within the current timeout window.
Raw Data#
Raw data pane displays data of the selected event in raw bytes. Network Analyzer highlights bytes that map to the data currently selected in the Event Detail pane.
Event Detail Pane#
The event detail pane shows all data present in the corresponding packet in a readable decoded format. When a bit field is selected, the corresponding data is automatically highlighted in the hex dump view of the packet. You can toggle between hex and decimal formats by right click on the field and press Hex/decimal toggle.
Node Map#
Node map provides a graphical view of the network, where nodes are displayed with their network identifiers. The map also displays network activity.
Timeline View#
Timeline view displays traffic data present in the recorded session. The data points corresponding to the green curve represent the number of packets per unit of time.
Filter Bar#
By default, the Events pane displays all session events. You can build and apply filters that constrain Network Analyzer to show only events that are of interest. By filtering events, you can analyze results more efficiently.
Using Bookmarks#
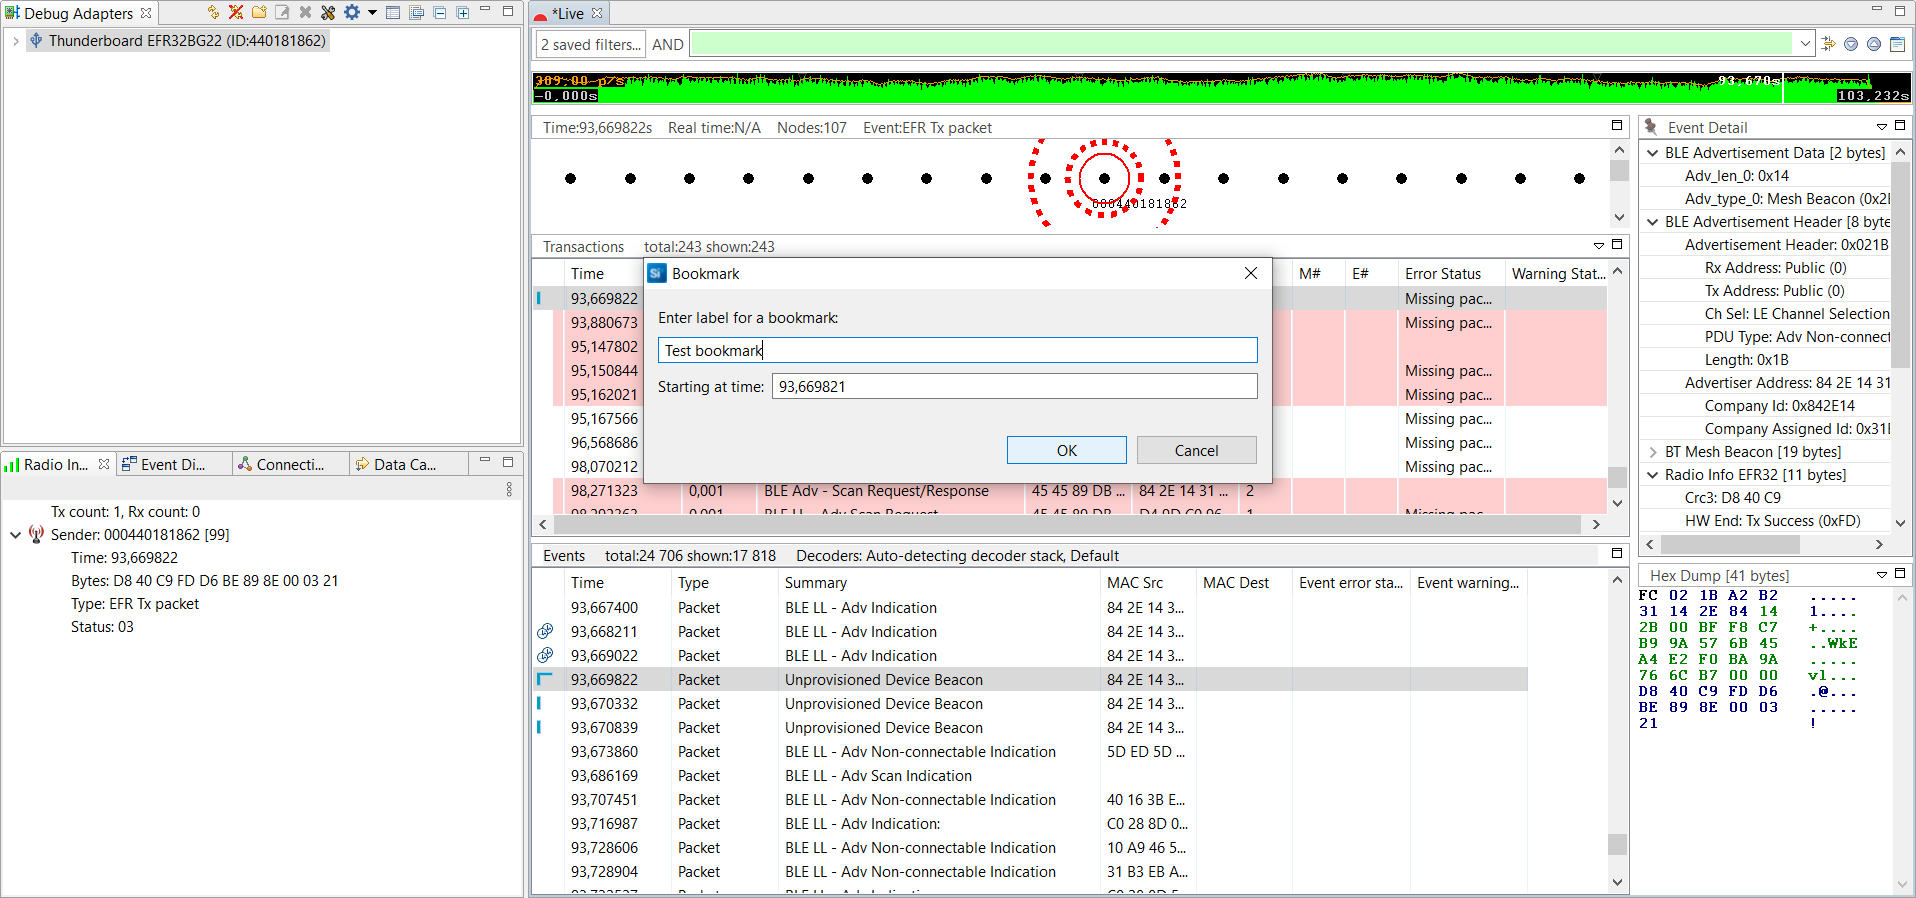
You can use bookmarks for marking events. These are actual bookmarks that point to a certain Bluetooth event. This feature is useful for pinpointing a significant event that can be problematic. It is really helpful when the trace is shared with somebody else.
Select the event and right click on it.
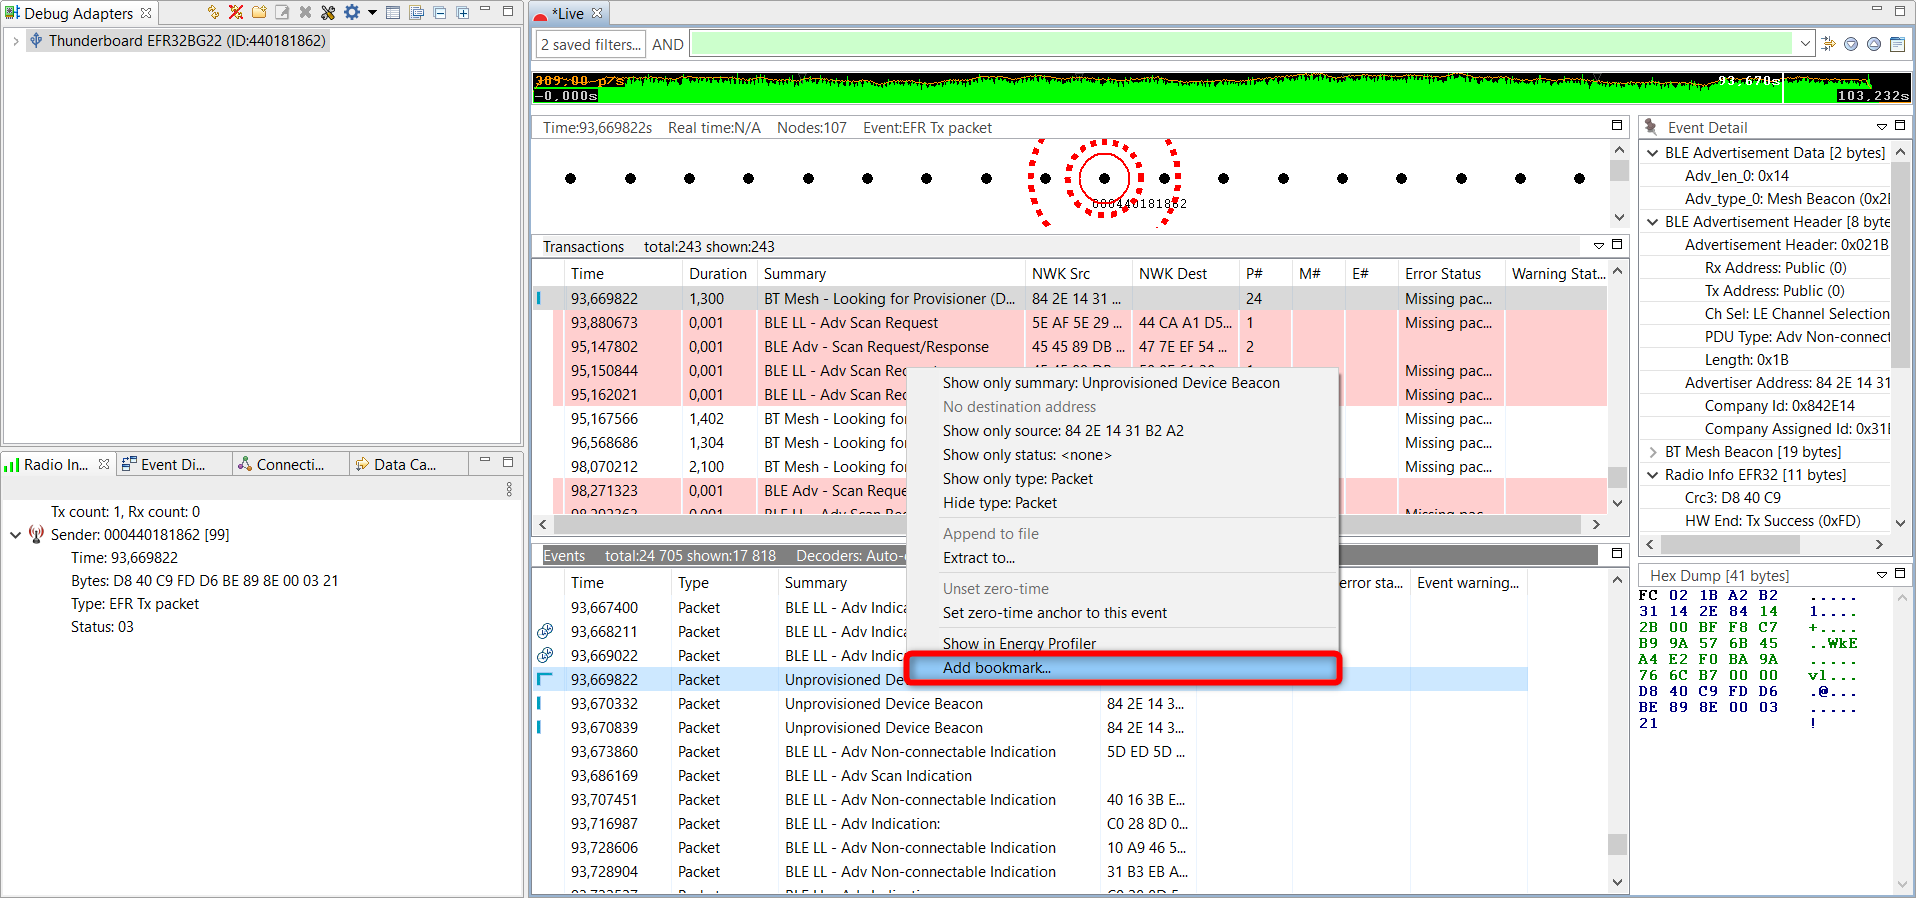

Enter the bookmark name.

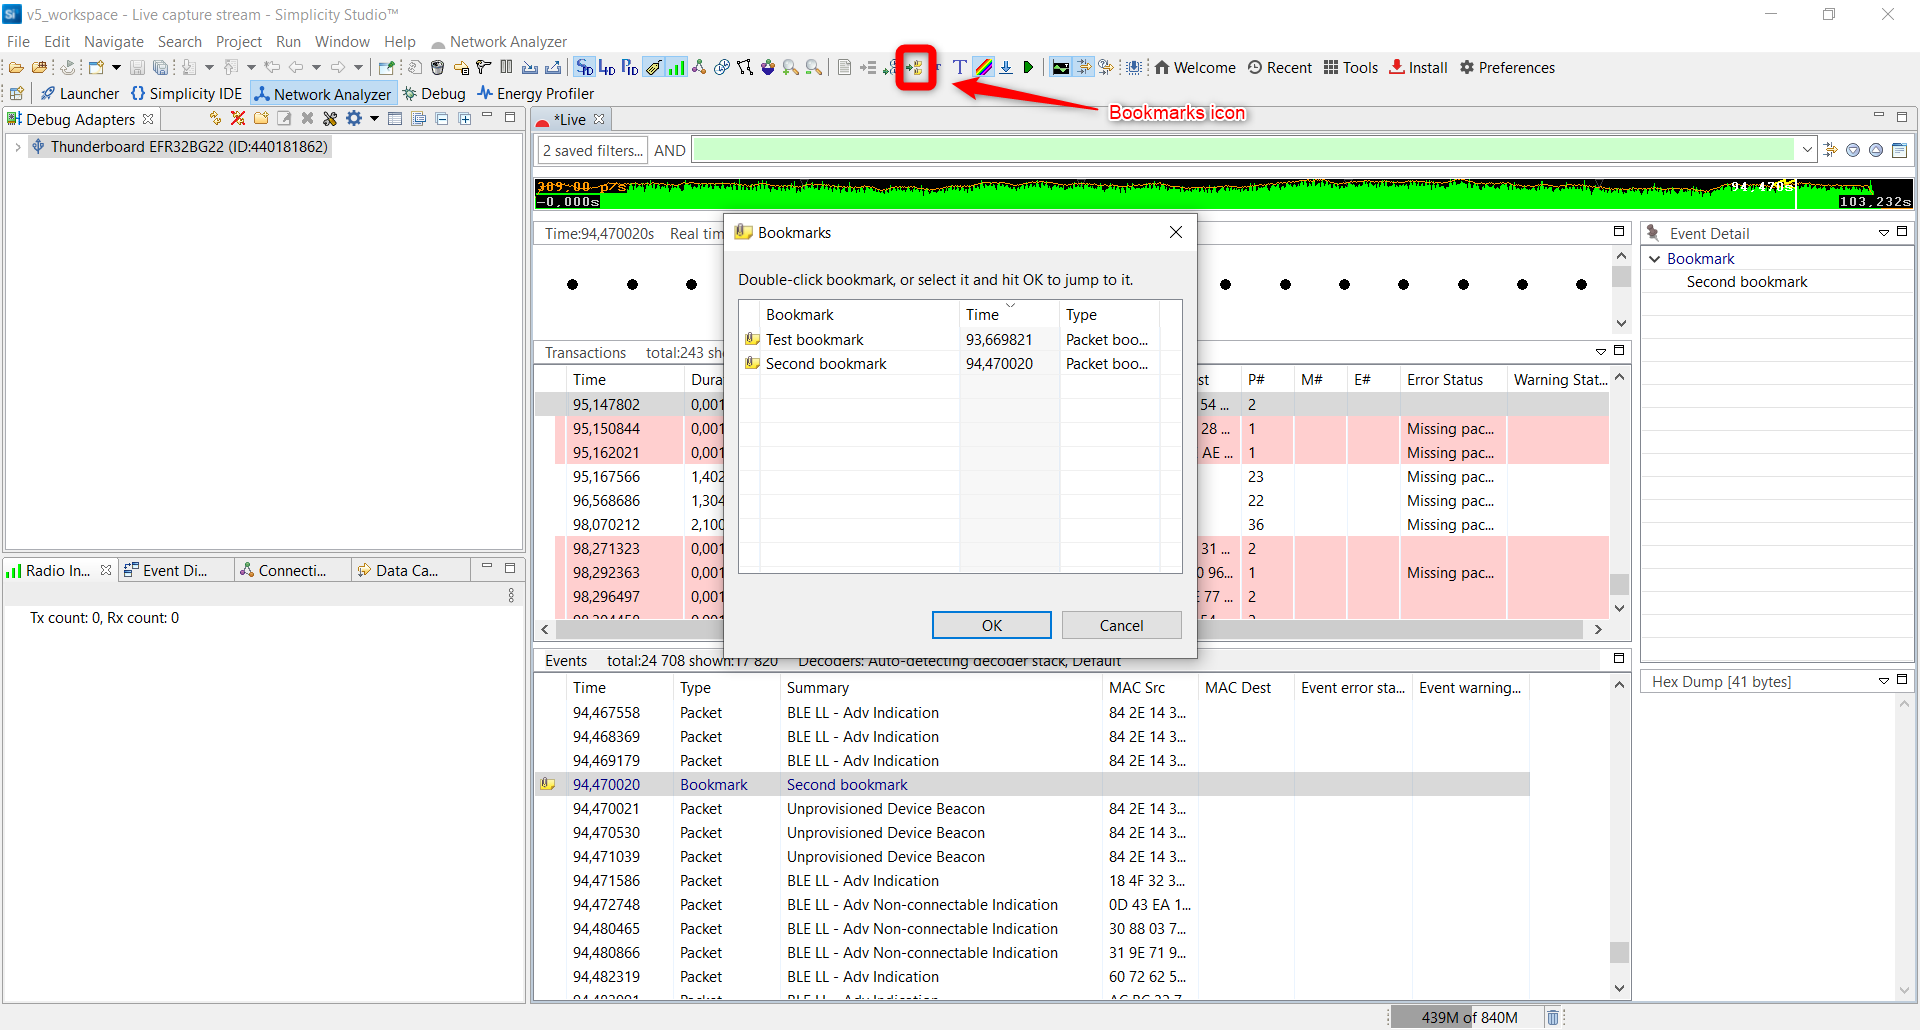
You can then manage the saved bookmarks by clicking on the Go To Bookmarks icon on toolbar.

Set Zero-Time Anchor#
When studying a particular event or a transaction, it is sometimes useful to set it as the time reference. Practically, this means setting the timestamp corresponding to that event or transaction to zero, and then seeing all subsequent timestamps updated according to the new time reference.
Select the particular transaction or event, right-click to open the context menu, and then click Set zero-time event anchor to this event.
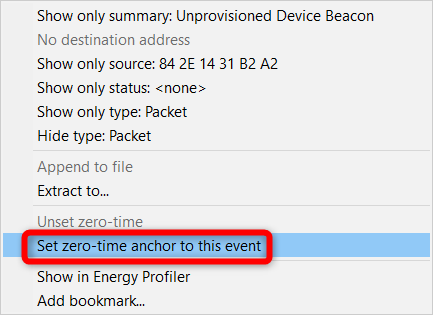

The timestamps of all events and transactions are then updated, taking into account the new anchor as a time reference.
Stop capturing. For this, right click on the device in the Debug Adapters window. After it, close the trace called Live.
Advanced Debugging of a Bluetooth Mesh Network#
Network Analyzer has many powerful features for Bluetooth mesh development. This exercise provides a hands on experience working with those.
Capture on Multiple Adapters and Provision a Bluetooth Mesh Network with a Smartphone#
First, plug in the second Thunderboard and flash the Bluetooth Mesh - SoC Sensor Client demo.
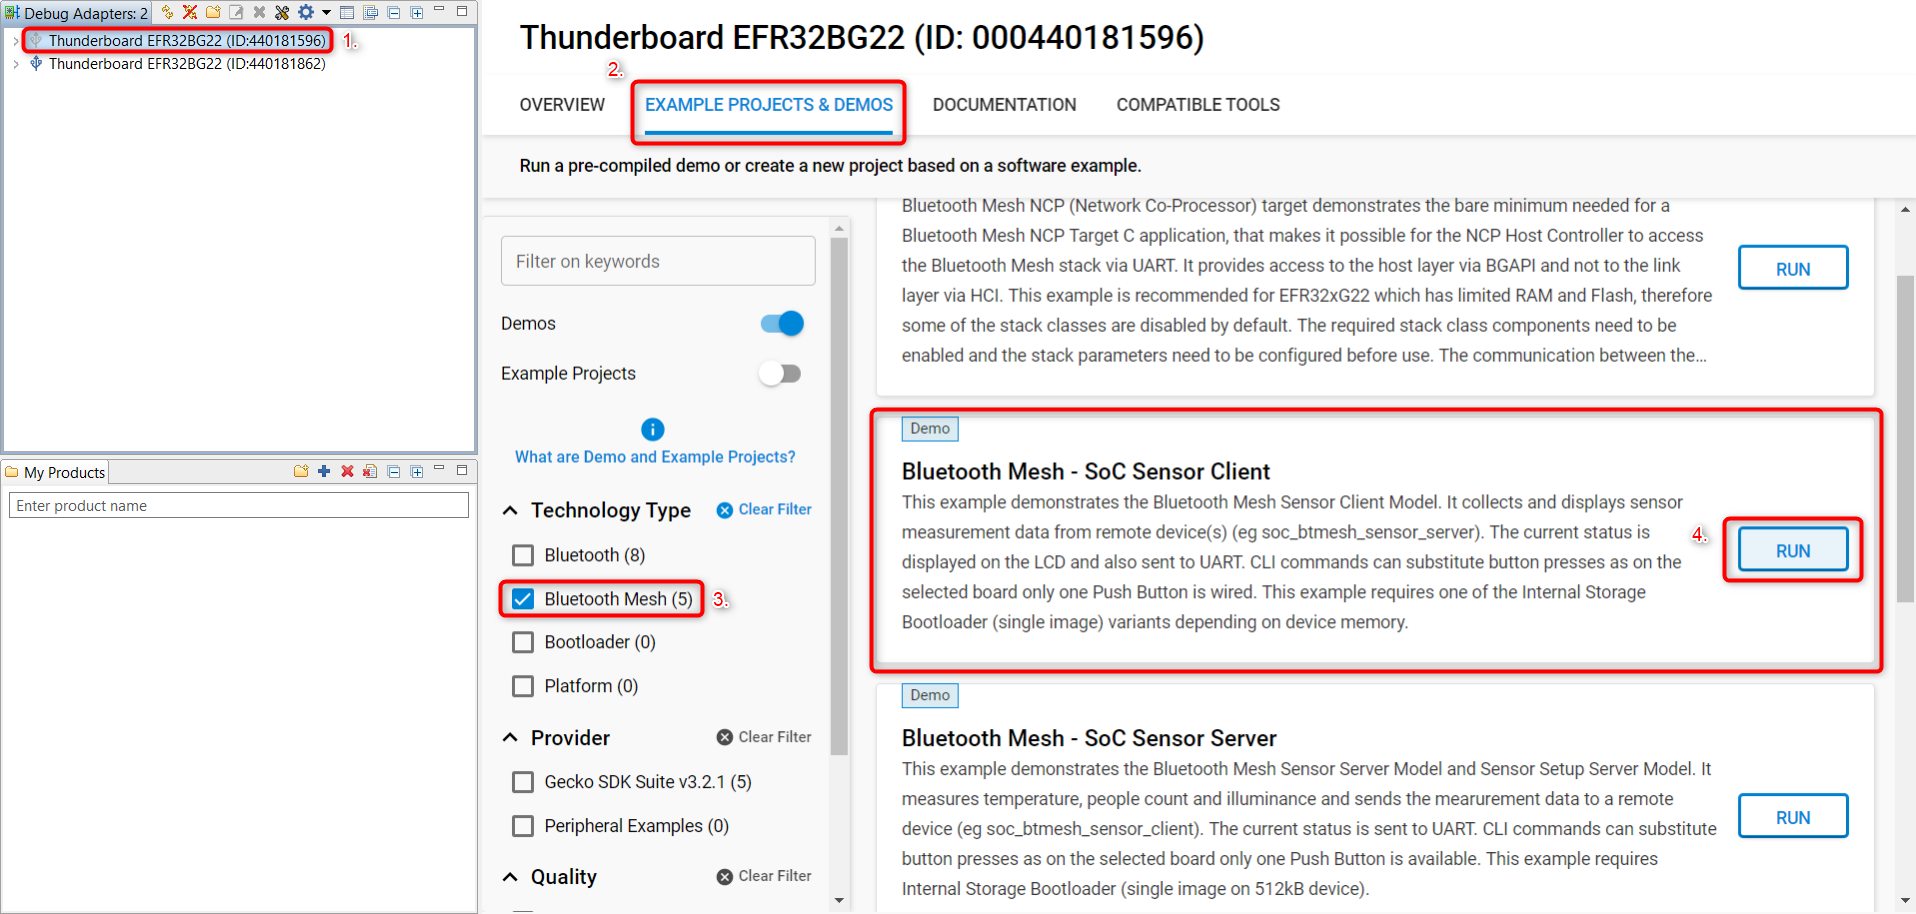
Click on the second Thunderboard in the Debug Adapters window. You can differentiate it from the first one because that is already connected and has a blue icon.
Click on Example projects & Demo’s tab.
Select “Bluetooth Mesh” from the Technology Type filters.
Run the Bluetooth Mesh - SoC Sensor Client demo.

Before going forward, please disconnect the previously opened debug connection with the first Thunderboard.

With Bluetooth mesh, capturing from multiple nodes makes more sense than capturing from only one because Bluetooth mesh nodes are constantly scanning for incoming packets. For example, some nodes might be emitting Bluetooth mesh messages or beacons at the same time the node being used for capturing is answering a configure request. As a result, data that was sent will not be received because the link layer of the underlying Bluetooth LE stack was in the advertising state and not scanning. Additionally, there are three primary advertising channels and the radio transceiver can only listen to one channel at a time.
To start capturing on several adapters, follow these steps:
Click on the New Group icon and rename the group.
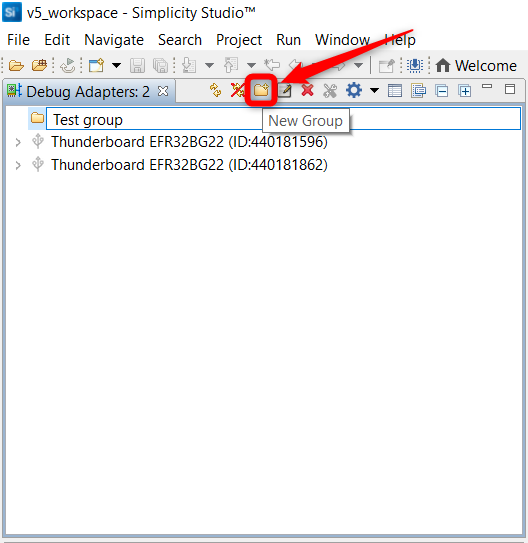

Drag and drop the Thunderboard devices to the group.
Right click on the newly created group folder and press on Group: Connect.
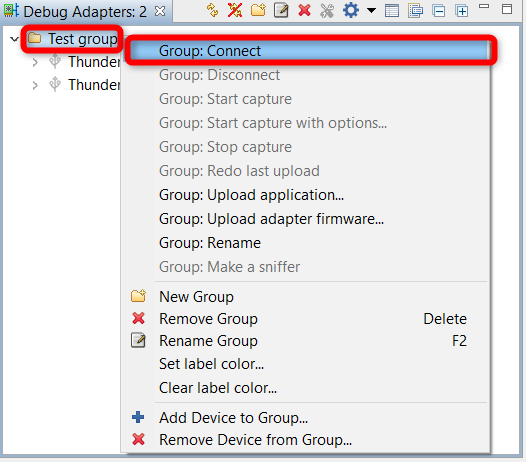

Right click on the folder again and press Group: Start Capturing.
Capturing from all nodes in a network yields a perfect trace session. The session data compiles all incoming and outgoing data from each node in chronological real time, providing a richly layered view of all activity within a network.
In unprovisioned mode, both examples behave the same way. The devices are unprovisioned and transmitting unprovisioned beacons. They do not have any network keys or application keys configured and publish and subscribe settings are not set. In this state, the devices are waiting for the provisioner to assign them into a Bluetooth mesh network and configure publish and subscribe settings and mesh models. In this state, the devices can be detected by the smartphone application.
Let's begin the troubleshooting using Network Analyzer. If you don't see 'Unprovisioned Device Beacon' events from both devices periodically in the trace, it probably means that the device may have old network configuration data in flash that needs to be cleared. In this case, perform factory reset on the device by holding down BTN0 button during reset. Keep pressing the button for at least 5 seconds after reset.
Provision and configure the sensor model nodes using the Silicon Labs Bluetooth Mesh mobile application. In the provisioning phase, the provisioner adds sensor servers and clients to the Bluetooth mesh network. A network key is generated and distributed to the nodes and each node is assigned a unicast address. In the configuration phase, the provisioner configures groups, publish and subscribe settings, application-level security, and mesh models. After provisioning and configuration, the Bluetooth mesh network is operational and clients can be used to configure and request data from the sensors.
For detailed step-by-step description on how to provision a network with both Android and iOS devices see QSG176: Bluetooth® Mesh SDK v2.x Quick-Start Guide. These are the steps needed for this exercise:
Open the Bluetooth Mesh by Silicon Labs app on your smartphone.
Create a Bluetooth mesh network.
Select the network and create a group.
Go to the provisioning view.
Search for unprovisioned devices.
Select the Bluetooth mesh device you want to provision.
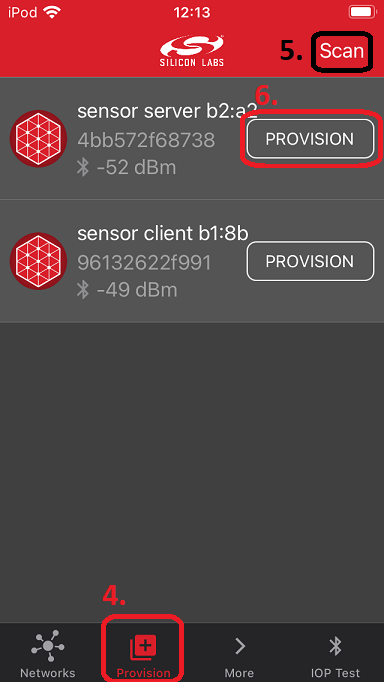

Select the created network and continue.
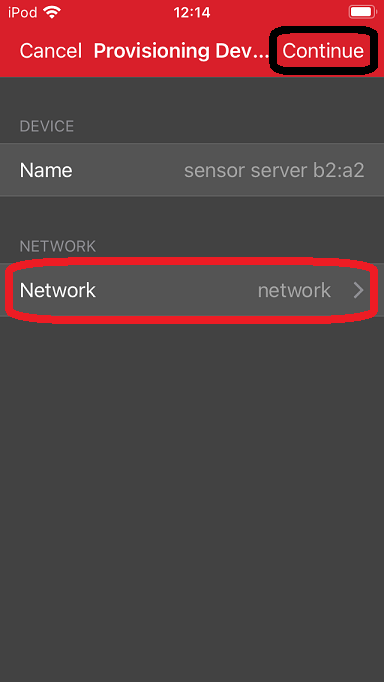

Assign the node to the created group.
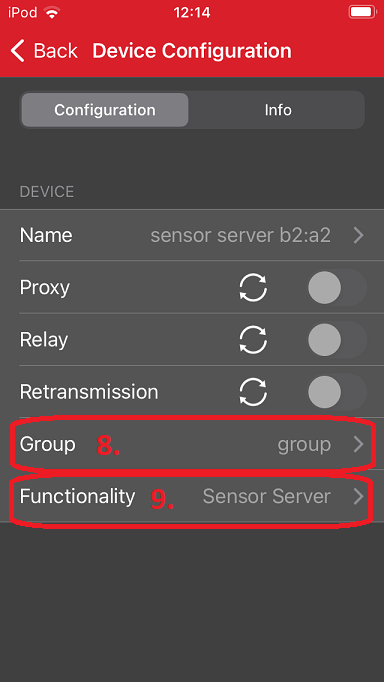

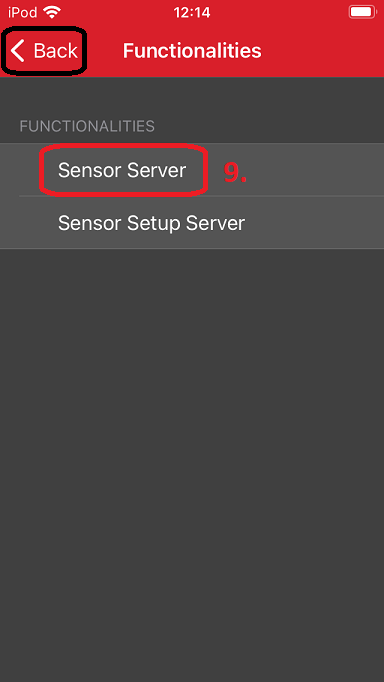
Set the Functionality to Sensor Server for the server device or Sensor Client to the client device and press Back.

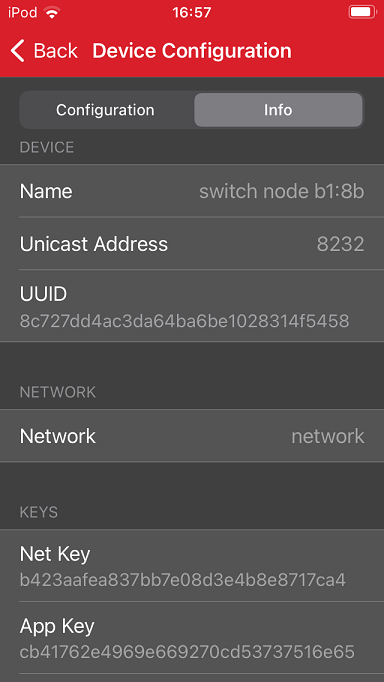
The information view shows the Bluetooth mesh node features, such as Unicast address, UUID, and security keys as well as the supported mesh models. It can be used for debug purposes.

Note: the network and node database can be erased by left-swiping the network in the main view and then pressing the trash icon.
Do it for the other device from point 5. After provisioning, if you scroll down in Network Analyzer, you can only see encrypted Bluetooth Mesh packets:
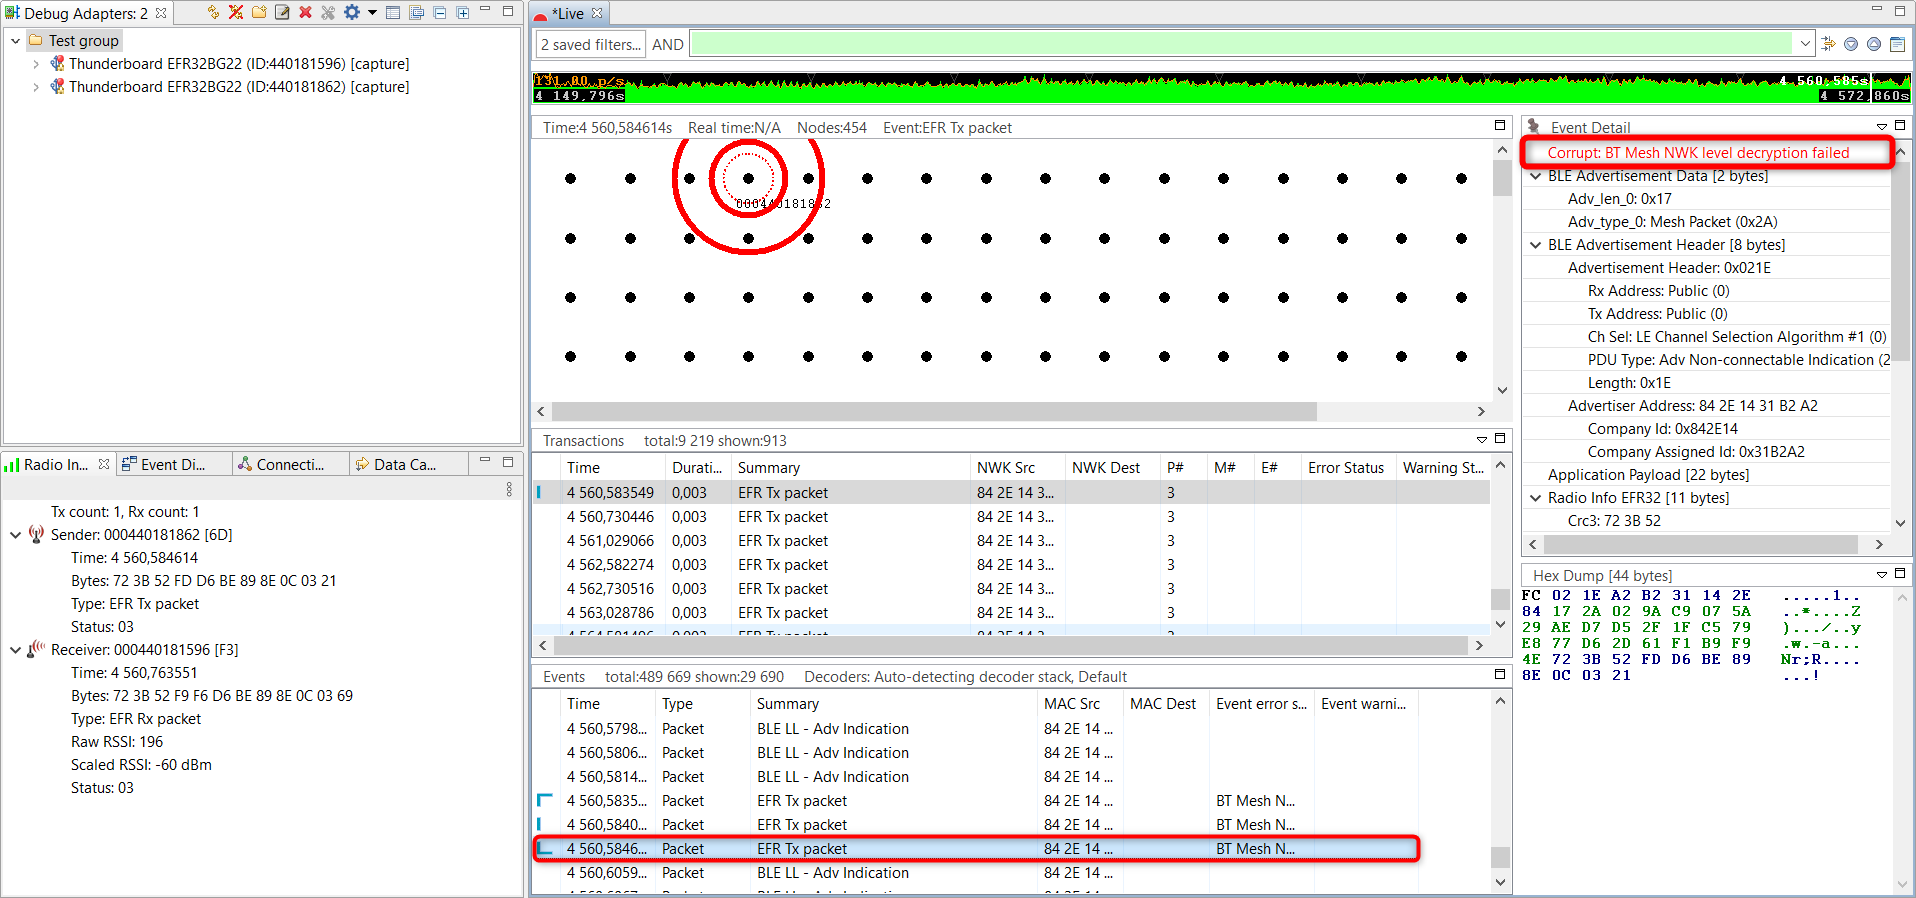

The Bluetooth mesh stack is composed of several layers, starting from the network layer up to the access layer. Data traffic can be encrypted in various context (that is, stack layer levels):
Network: Each Bluetooth mesh network has its associated network key. A node can have several network keys.
Device: Each device in a particular network has its own device key.
Application: Each application, depending on how it is configured, has its own application key.
When building a Bluetooth Mesh network using a smartphone application, you can export the corresponding security keys. These keys then can be imported in the Network Analyzer.
The following steps indicates how to export keys using the Silicon Labs Bluetooth mesh phone application. Note that the steps are independent from the phone operating system, but the graphic layout of the smart phone application might differ.
Browse to the Export cryptographic keys menu.
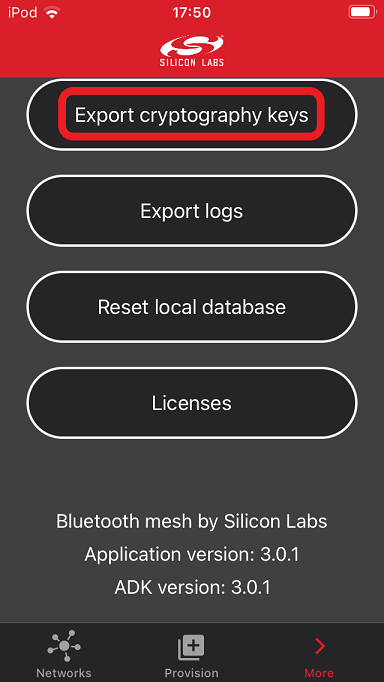

Use the Export cryptographic keys button to create the corresponding JSON file. The MeshDictionary.json JSON file can now be sent via email.
Now import these keys to Network Analyzer:
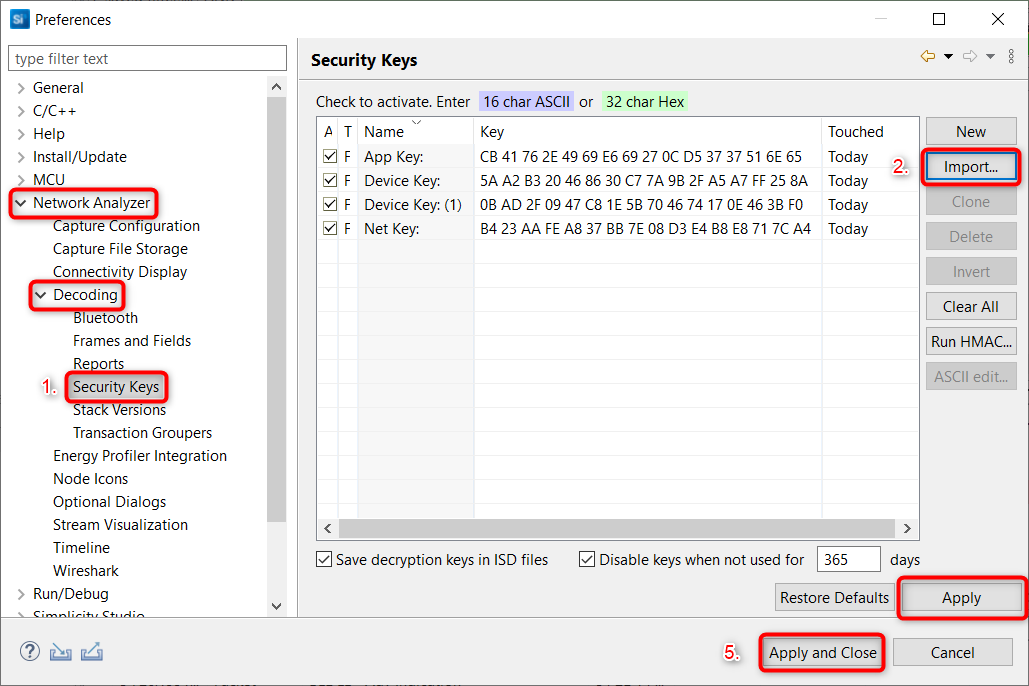
Go to Window -> Preferences, then Network Analyzer > Decoding > Security Keys.
Click Import.
Browse to the MeshDictionary.json file.
Click Open and see the keys imported in the “Security Keys“ window. For debugging purposes, the decryption keys can be saved in the ISD file (by checking the corresponding checkbox).
Press 'Apply' and 'Apply and Close'.
After importing the keyfile, select File > Other Network Analyzer Actions … > Reload to refresh the data.

Now you can see the decrypted, decoded packets in the Network Analyzer.
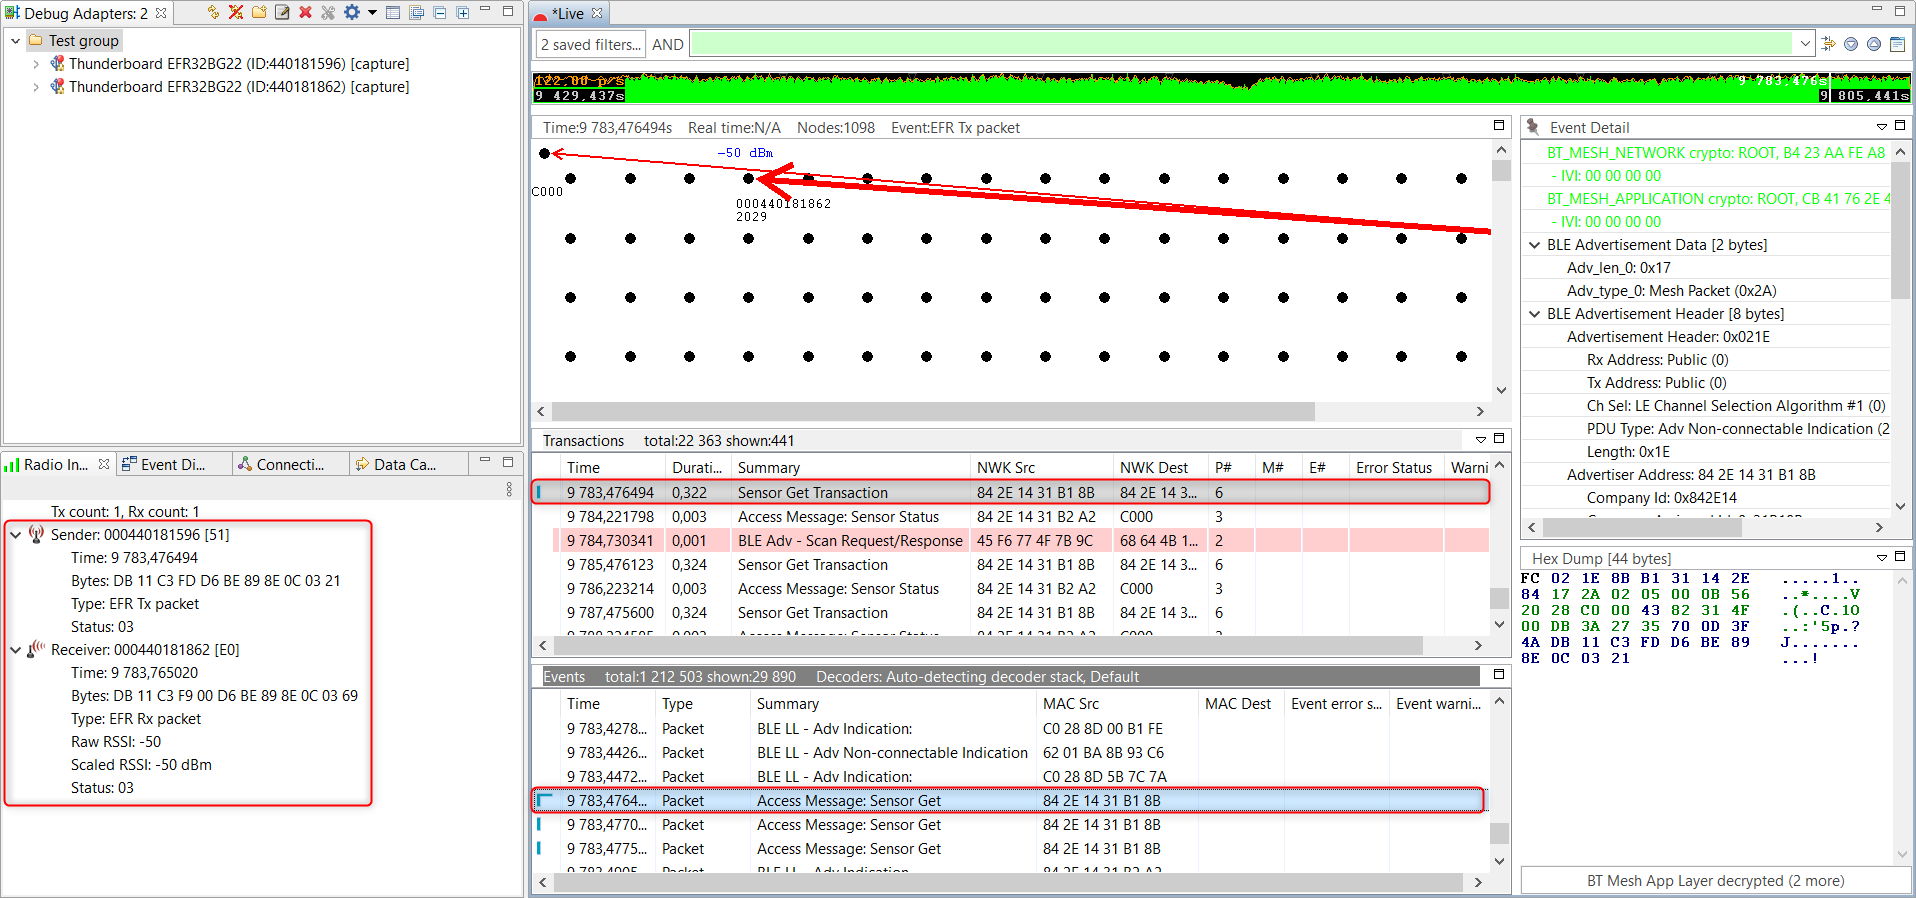

Bluetooth Mesh Sensor Client Model collects sensor measurement data from remote device with Sensor Get requests. The Sensor Server Model example measures temperature and people count and sends the measurement data to a remote device with the Sensor Status message.
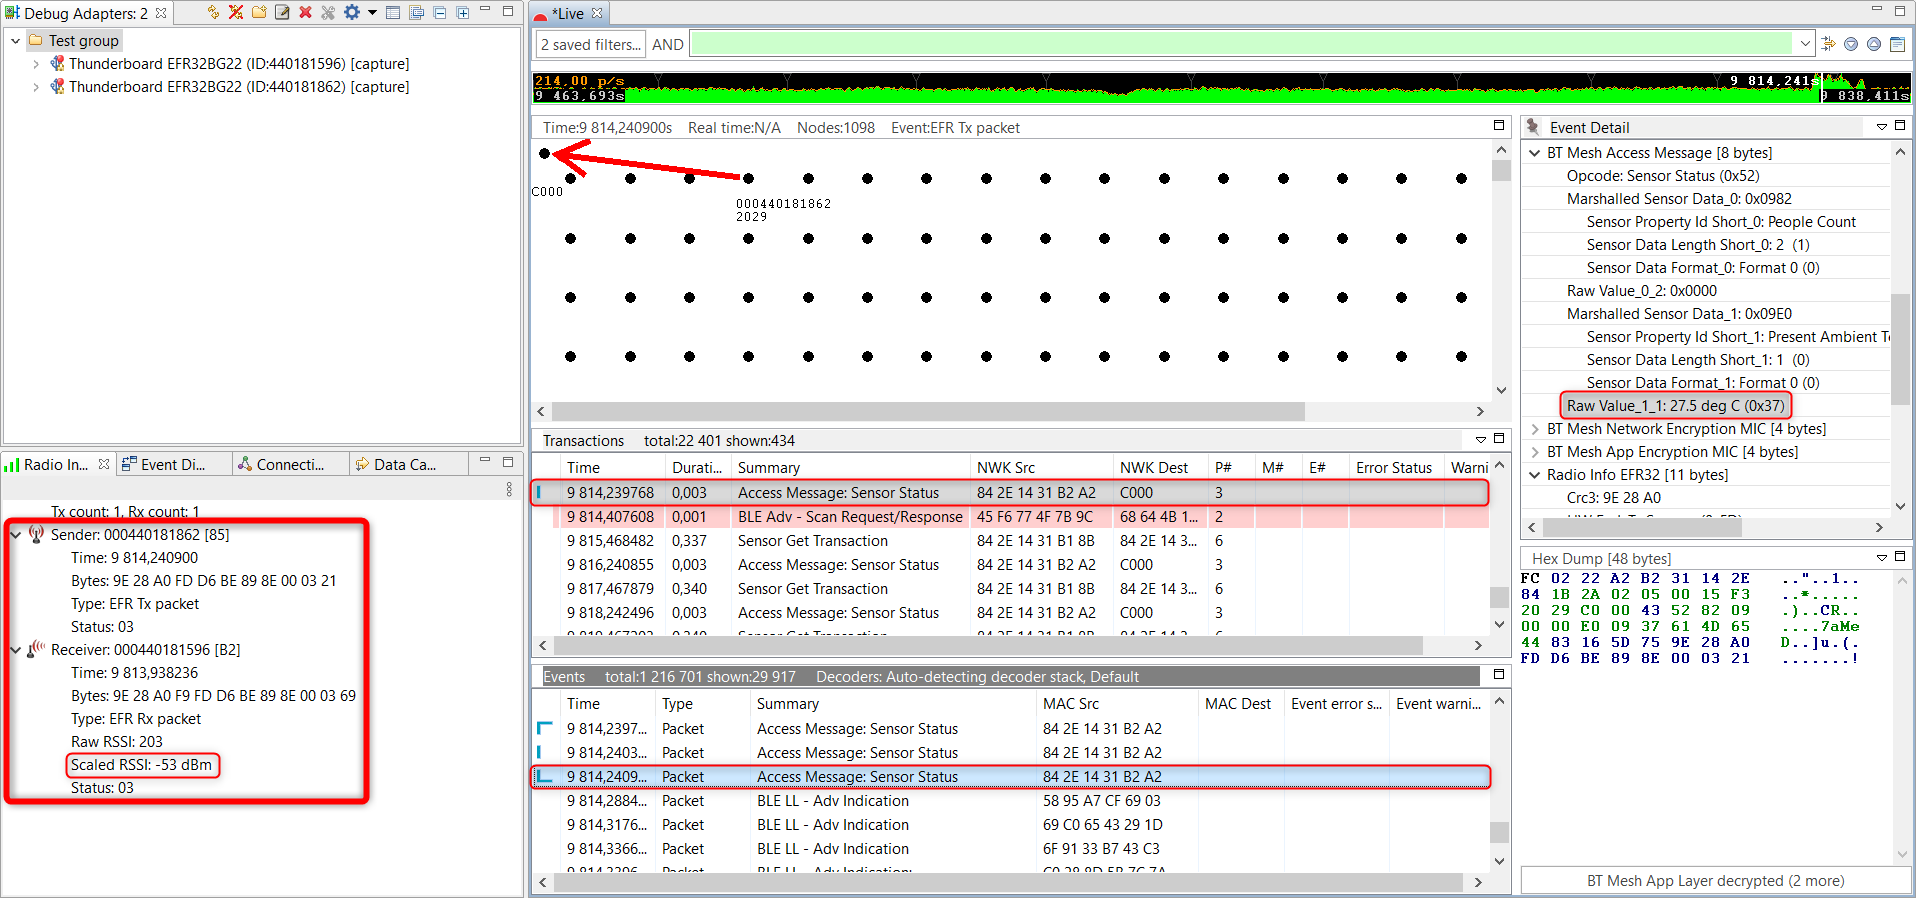

The Radio Info window on the left side is showing information on both the transmit and receive sides because both devices are capturing. In this pane, you can see who sent and who received the corresponding packet and what was the actual RSSI value. This is the exact RSSI value from the receiver, which is a huge advantage compared to an external sniffer device.
The current status is also sent via UART so you can log the applications with a serial terminal.


Using Filters#
Network Analyzer supports using a set of built-in, manual filters.
The filter bar is used to filter transactions and events. Each capture session has its own filter settings. When a session’s filter is changed and the filter is applied by clicking Apply in the Filter pane toolbar, the Network Analyzer will refresh the display showing only the corresponding transactions or events. When you exit Network Analyzer, all sessions filters are cleared and must be reapplied when Network Analyzer is restarted.
The Network Analyzer provides two ways to edit filters:
Filter Manager: Maintains internally a set of saved filters that you can review and edit. You can also add new filters by specifying any of the saved filters for display on the Filters menu, where they are accessible for use in one or more sessions.
Filter Bar: An editor that attaches to a given session, where you can enter one or more filter expressions on the fly. The Network Analyzer discards filter bar expressions for all sessions when it exits. It does, however, store the expression for easier future access.
Multiple filters can be combined using logical expressions:
&& - And operator
|| – Or operator
Alternatively, conditions for individual filters can also be used:
== - Equals
!= - Not equal
|= - Contains
You can easily filter for a specific message. Right click on a Bluetooth Mesh Sensor Get transaction and click on Show only type: BtMeshAcc.
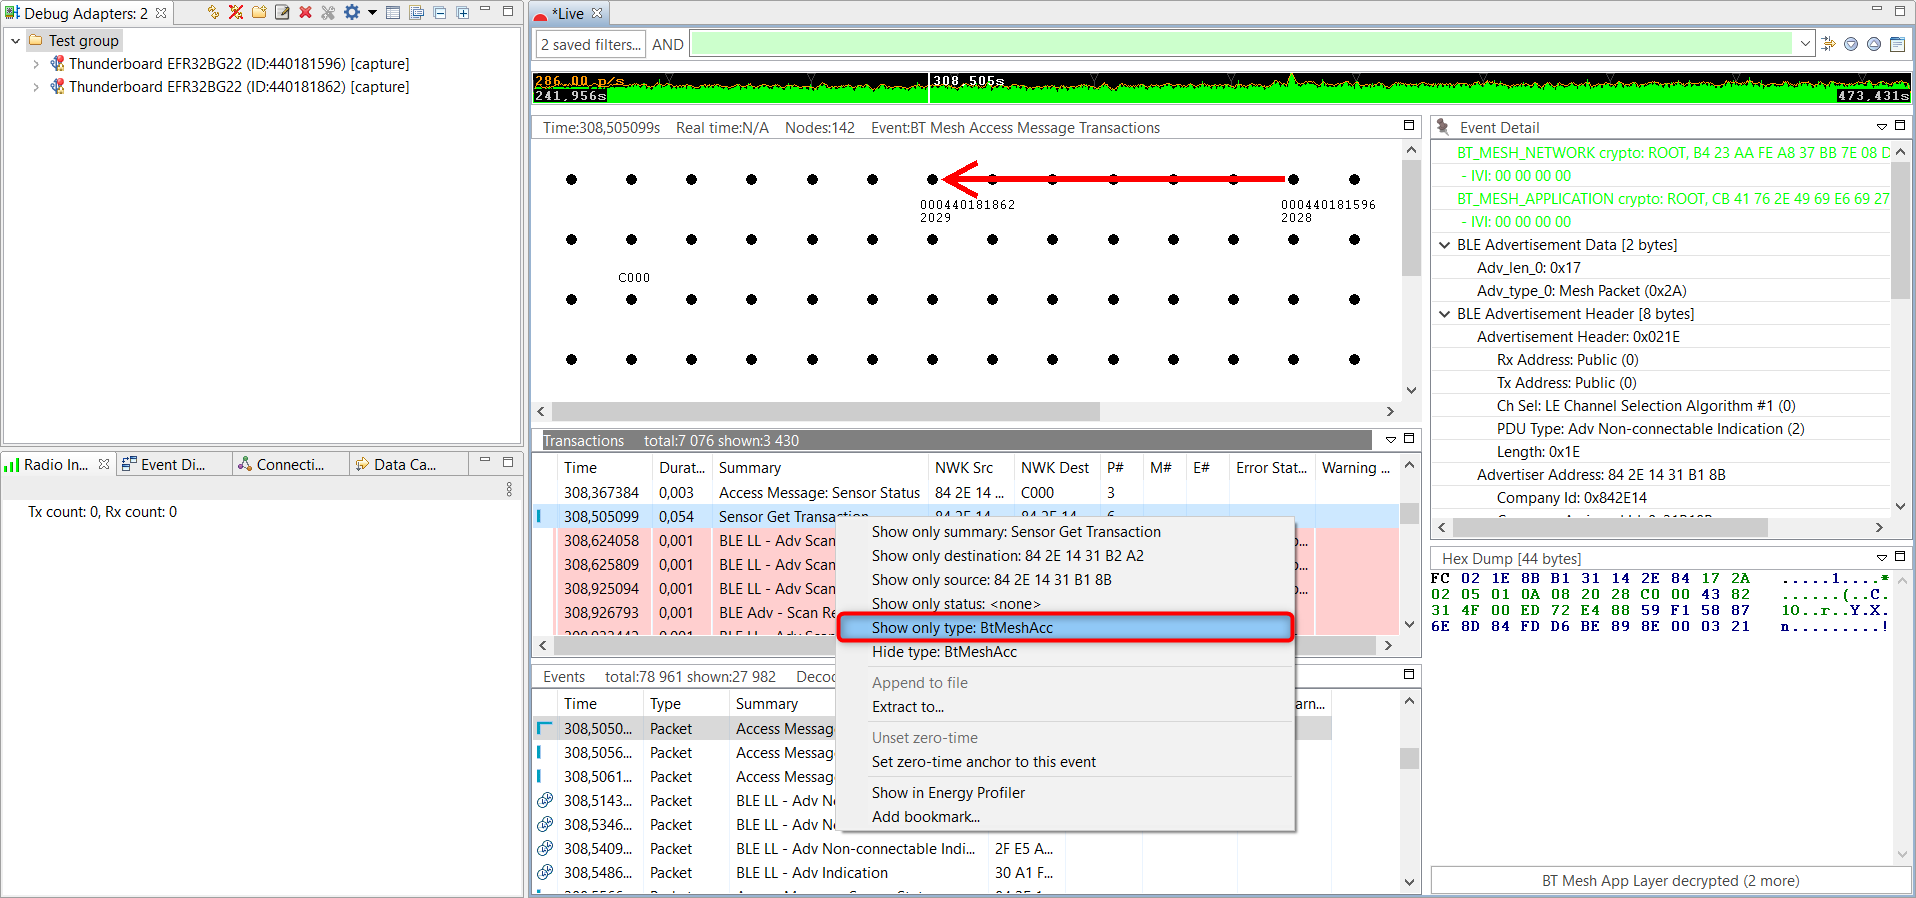

A filter expression is automatically generated in this way.
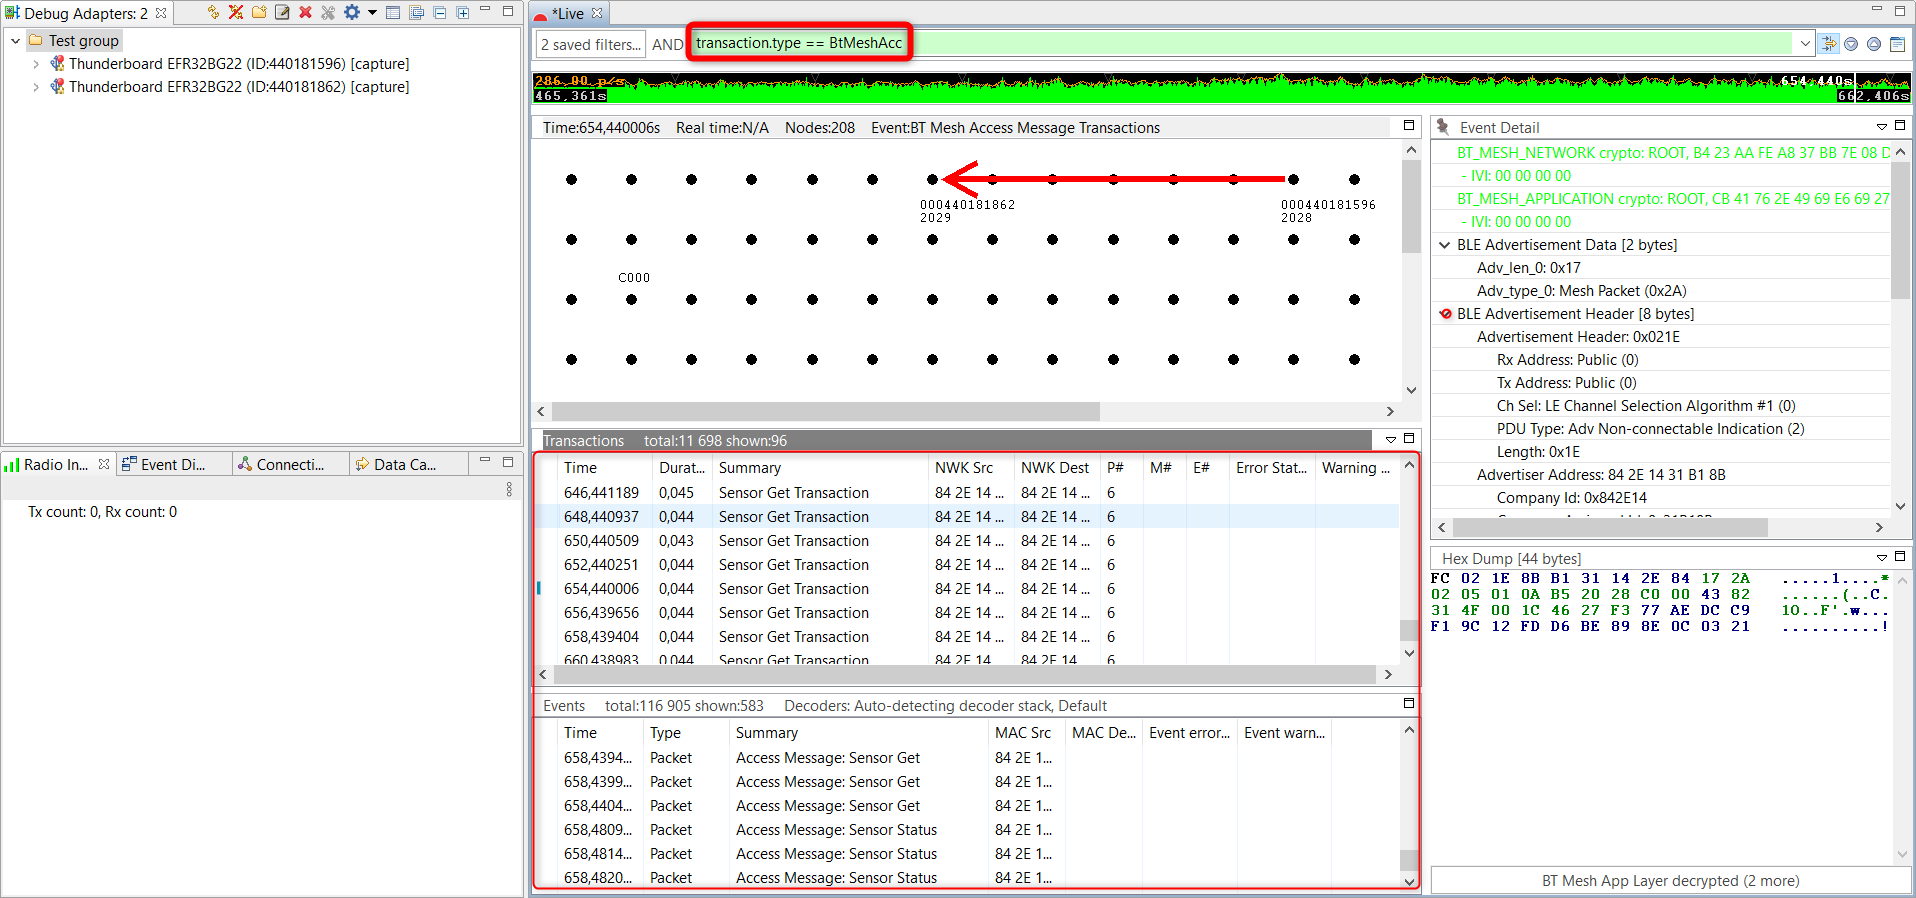

When you change the session's filters, the Network Analyzer immediately refreshes the display. When you exit the Network Analyzer, all session filters are cleared and must be reapplied when you restart.
Event Difference Pane#
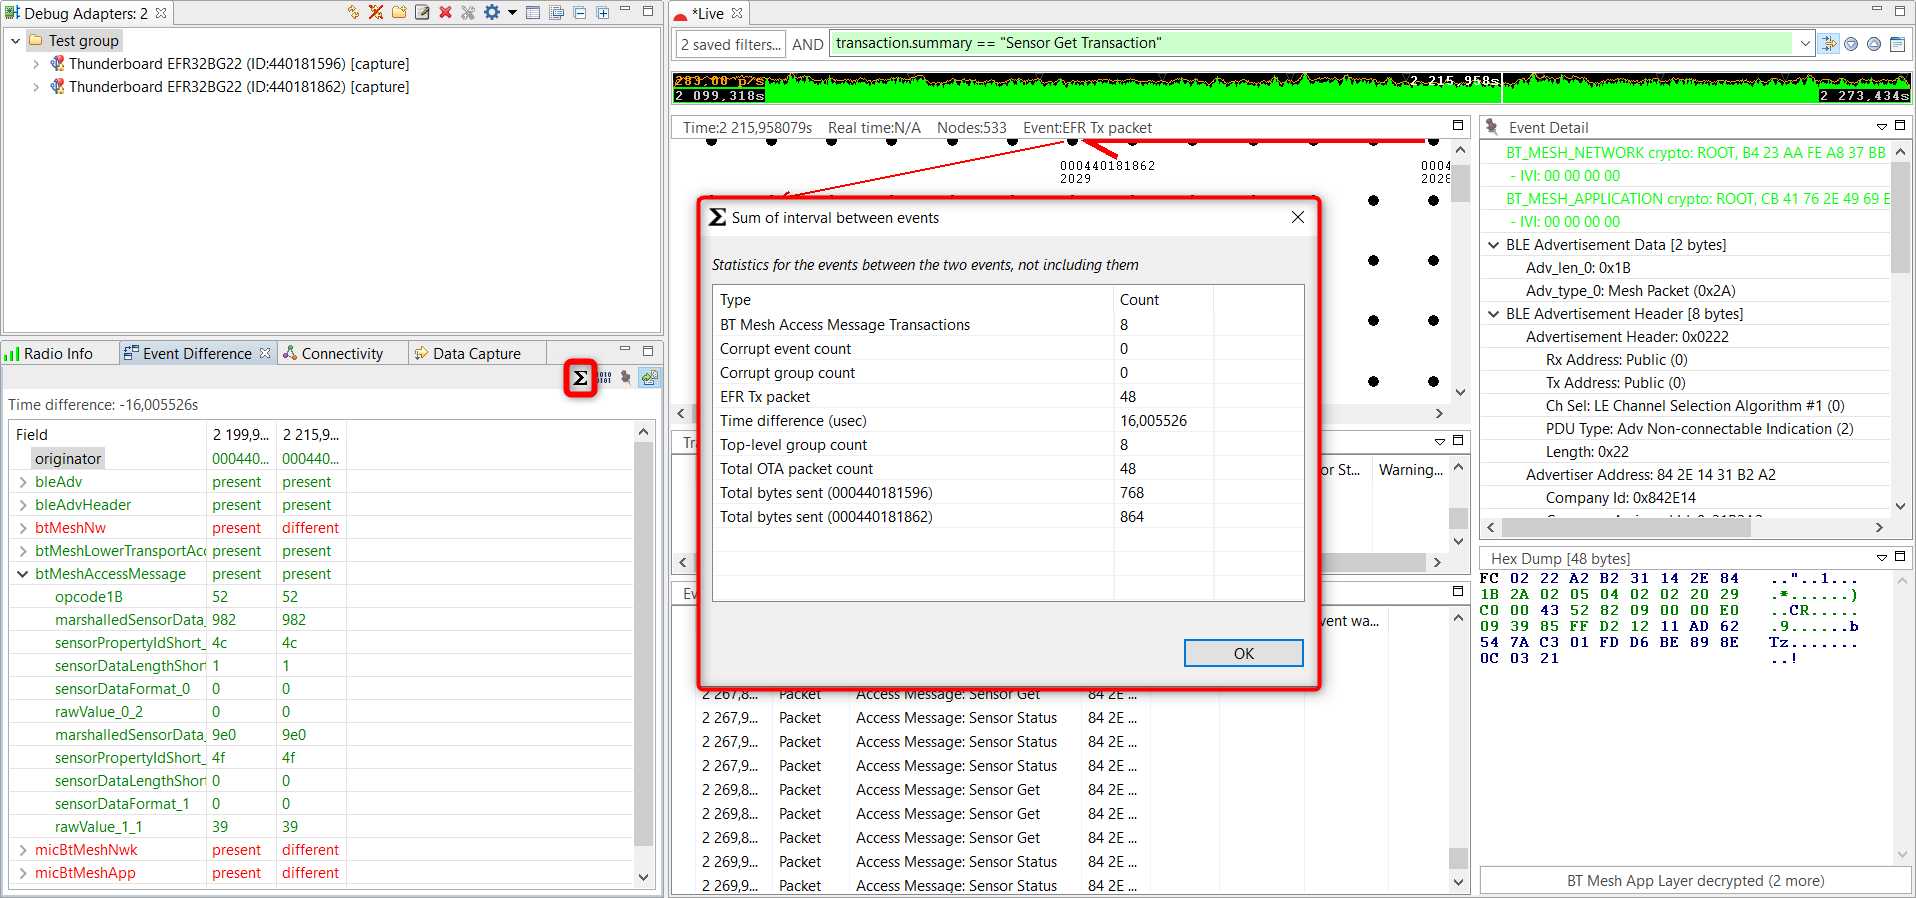
This feature can be used as a diffing tool between two different events. After opening this pane, click on two different events one after the other.
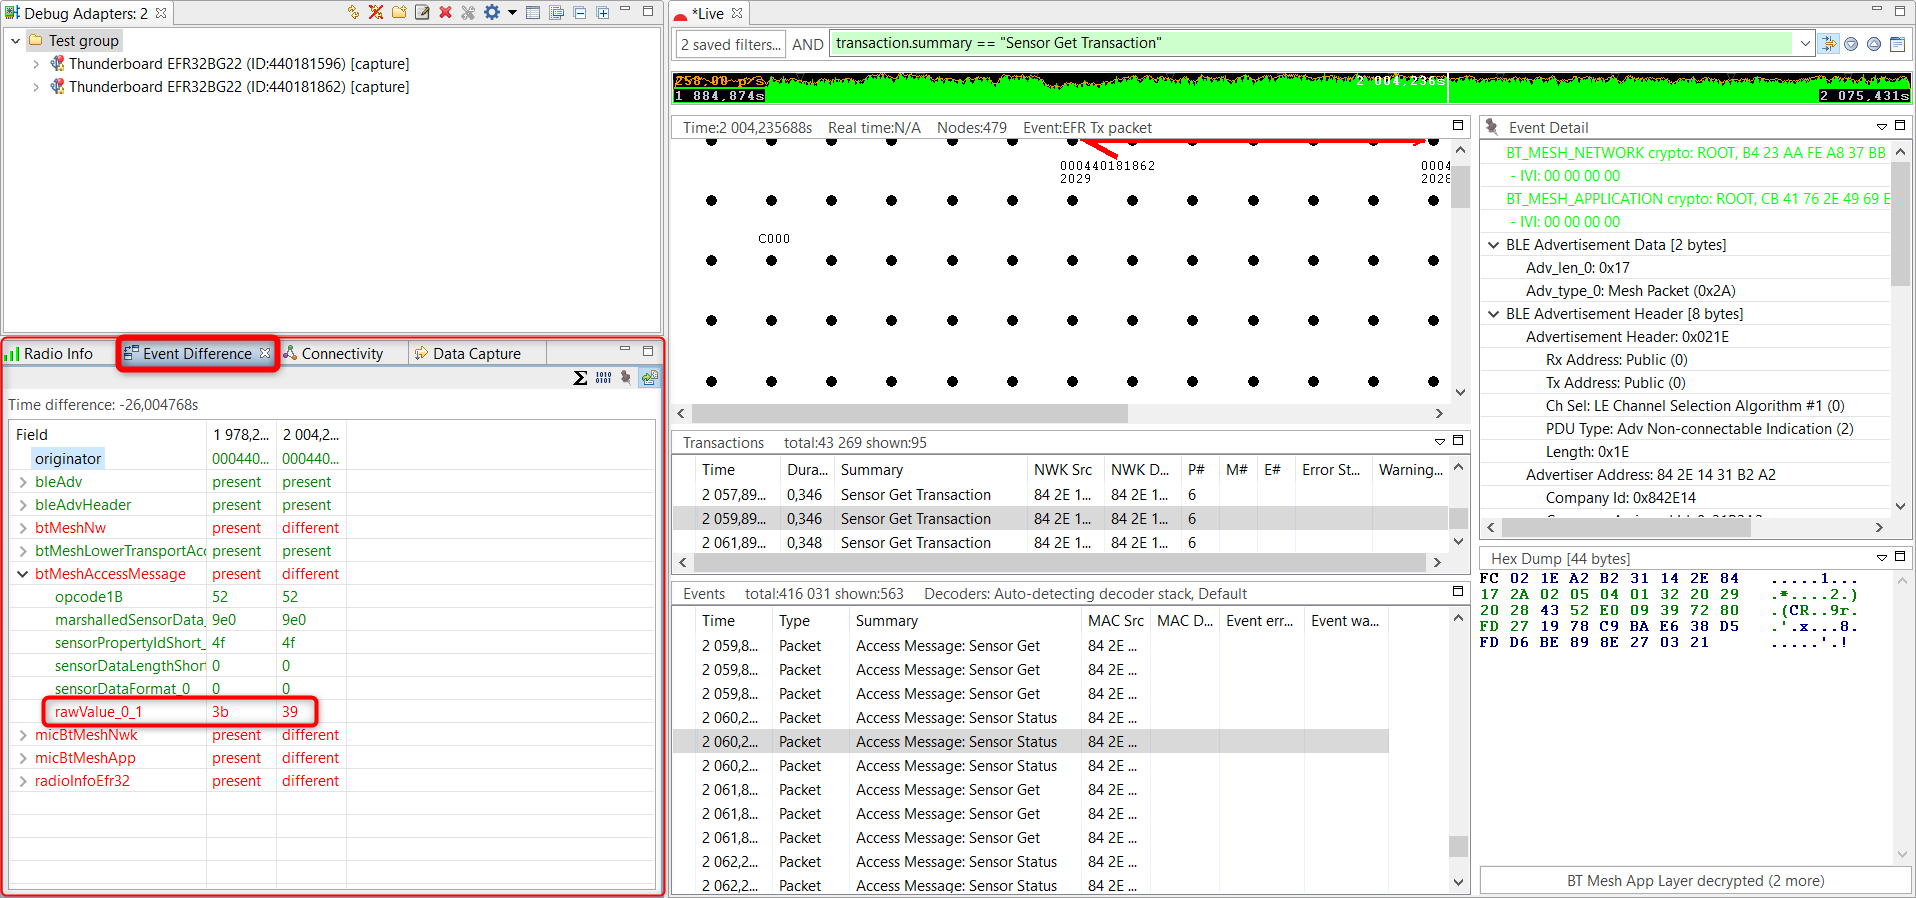

Differences are in the fields marked with red. For example, if two Sensor Status messages are compared, you can see that the temperature has changed (rawValue). There is also a Sum of interval between event feature for analyzing statistics between two designated packets.

Debugging the Bluetooth Mesh Proxy Feature#
In this example you will debug a use case when the smartphone's access to the Bluetooth Mesh network is lost.
The Bluetooth Mesh technology is mainly based on Bluetooth LE advertisement packets used along with Bluetooth Mesh AD types. Smartphones do not implement the Bluetooth mesh advertisement bearer (Bluetooth Mesh AD types), but only support Bluetooth connections and GATT application layer. In other words, the phones are not able to directly communicate with the mesh network over the advertisement bearer, but need one or multiple nodes in a network with a proxy feature enabled to accomplish that. A Proxy node is capable of acting as a proxy between the Bluetooth mesh nodes and network and a device that only implements the GATT bearer. This node establishes a GATT connection with the smartphone that supports the Bluetooth LE ATT bearer, called GATT bearer, and uses the Proxy protocol to forward messages to other nodes with the advertising bearer.
If you open the previously created network on your smartphone app, an active proxy connection is established.
If you disable proxy feature on a node, the node can no longer be directly accessed over GATT. Let's disable the Proxy feature on the node that has no active proxy connection and observe the difference in the Network Analyzer.
Note the last 2 bytes of the MAC address of the corresponding node in the app.
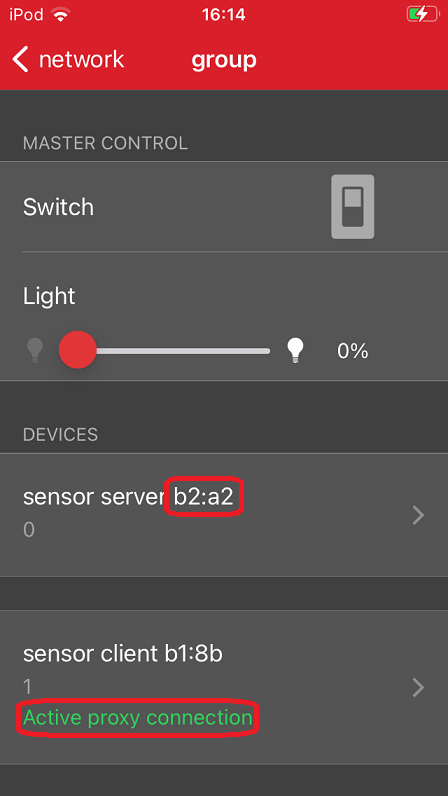

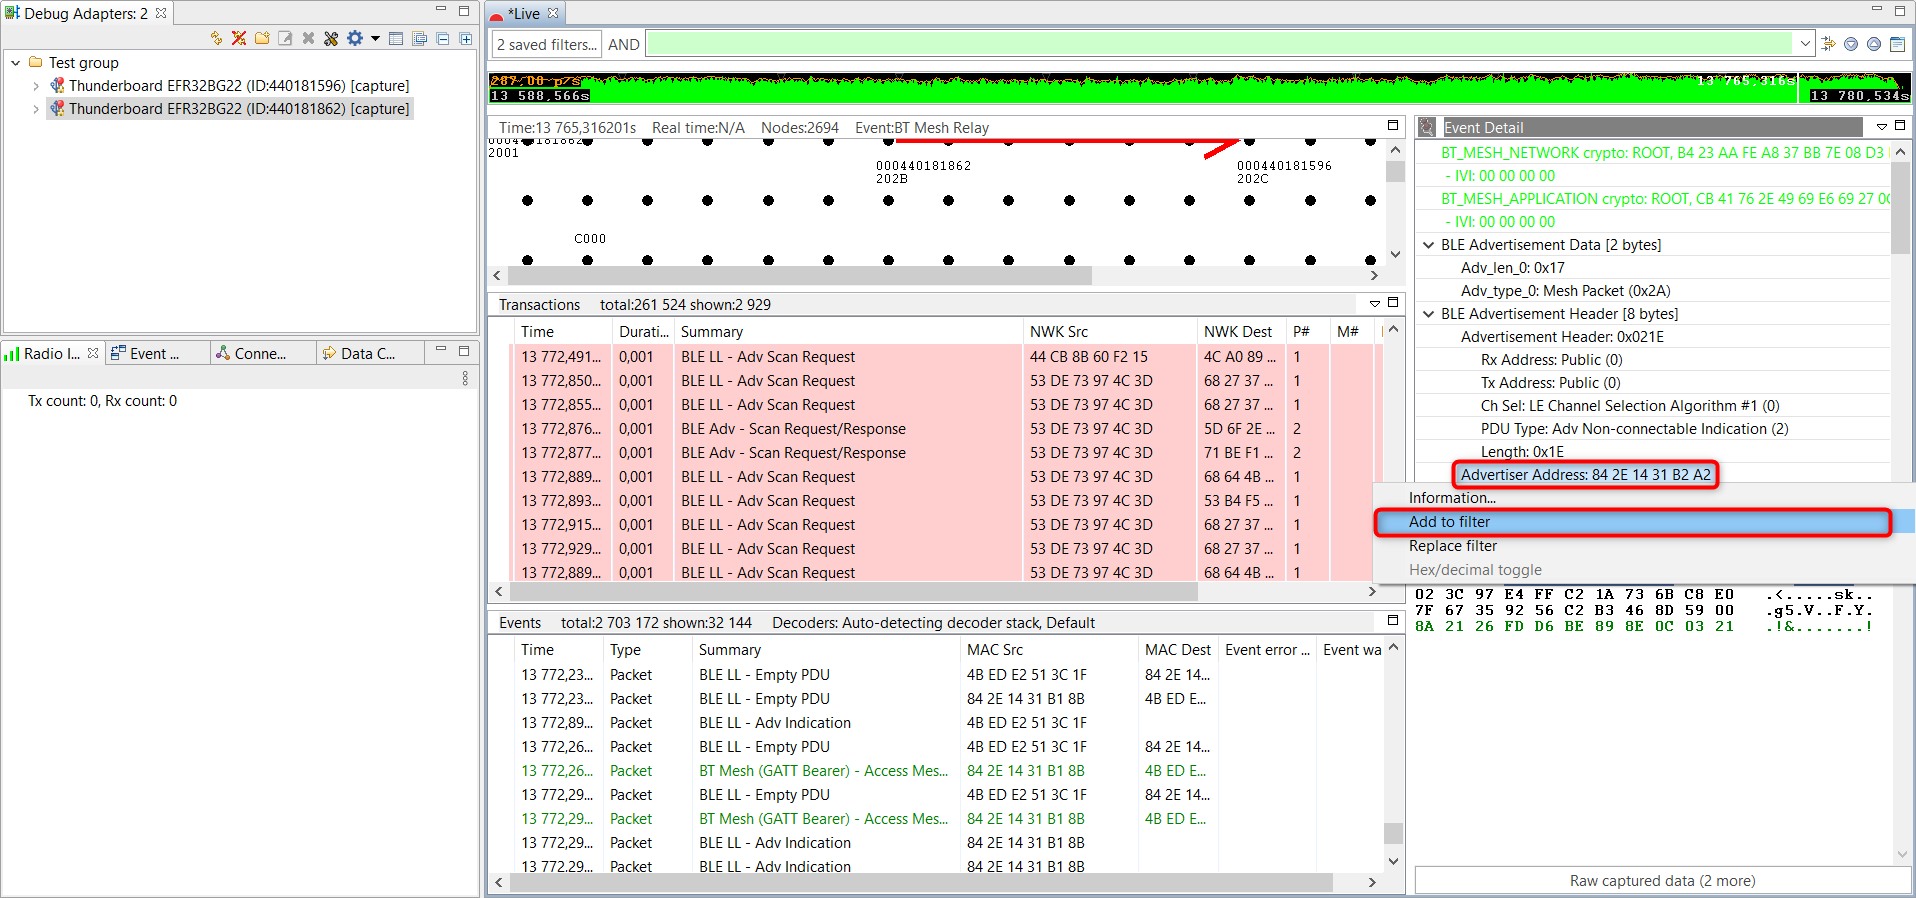
Find a packet in the Network Analyzer where this node is the source (look for the last 2 bytes in the address).
Right click on the Advertiser Address field in the Event Details pane and click on Add to filter.

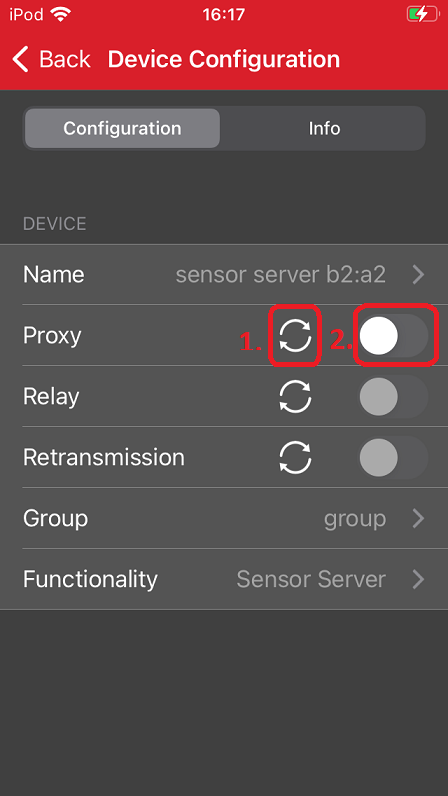
Disable the Proxy feature in the smartphone app by clicking on the refresh icon and then on the toggle button to disable the feature.

After disabling the Proxy feature, you can see that there are no Bluetooth LE advertisements anymore, only Bluetooth Mesh messages. The node cannot be scanned with a smartphone anymore.
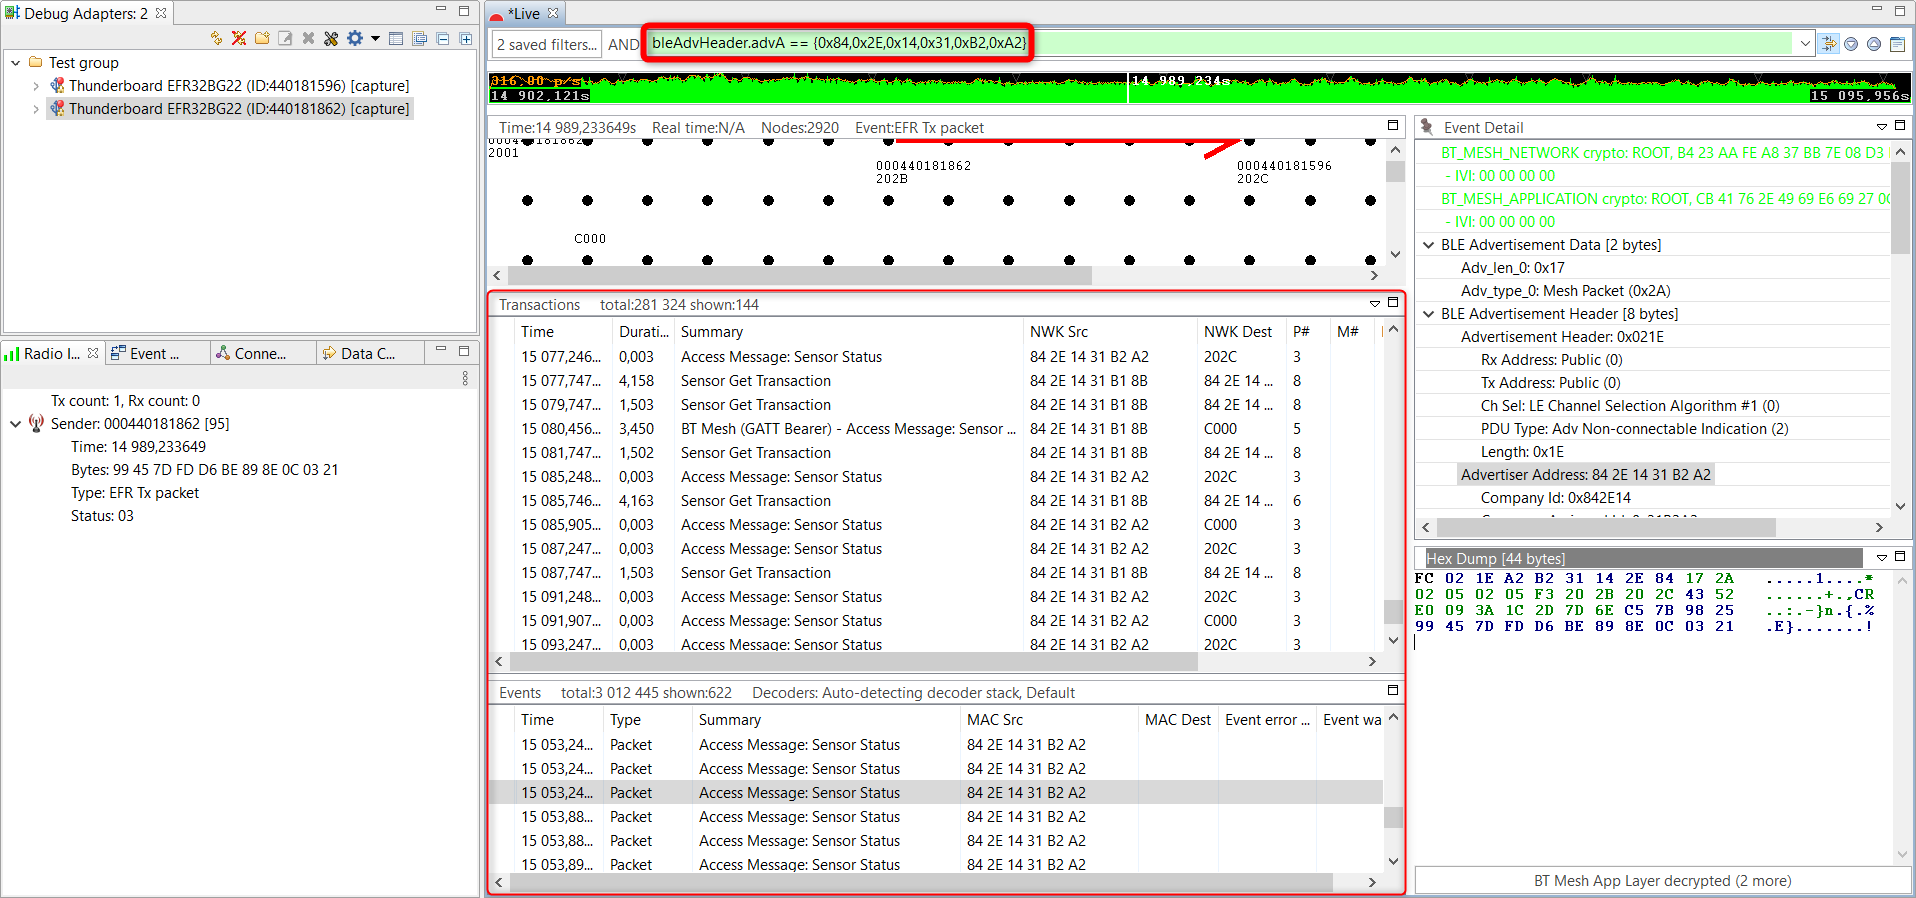

Now, let's simulate that we are moving out of the proxy node's radio range by removing the node from the network by left swiping the node and pressing the trash icon.
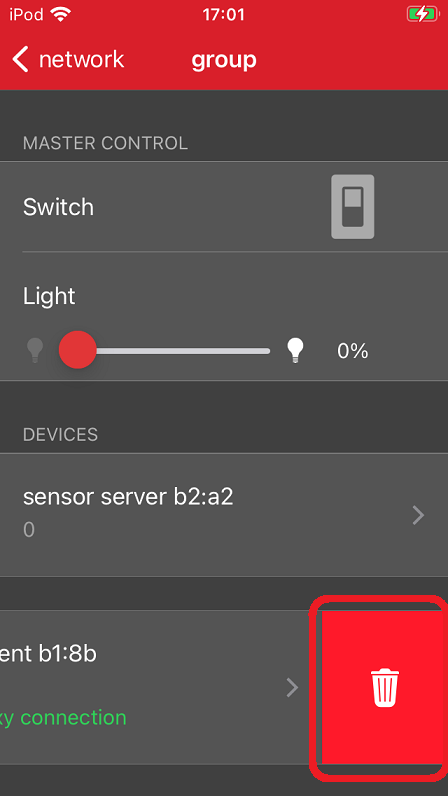

The access to the remaining nodes in the network is lost from the smartphone because, as you saw, the smartphone cannot connect to the network. In this situation, you cannot read, configure, or remove the other node. If you provision the removed device again, by default the proxy feature is enabled and you will have access again.
Capture Packet Trace on Custom Board#
You can also use the network analysis features when working on custom hardware if the corresponding PTI pins are exposed (via the 20-pin Simplicity Connector on the WSTK or the Simplicity Mini connector on the debug adapter for example), as shown below.


For this exercise, you will need the following additional hardware:
WSTK mainboard
Simplicity Debug Adapter Board
10-Pin ribbon cable
Custom board with a Mini Simplicity header or a Thunderboard BG22.
In the following use case, the Thunderboard BG22 is the custom board which is connected to the WSTK mainboard via the 10-pin Mini Simplicity connector and a Simplicity Debug Adapter Board, as shown below.


Ensure that the power switch on the WSTK mainboard is in AEM position. Remove the radio board from the WSTK.
Connect the Simplicity Debug Adapter Board to the WSTK and the Mini Simplicity Connector to the Thunderboard.
Connect the WSTK Mainboard to the PC via USB.
Go to the Overview tab and set the Debug Mode to OUT.
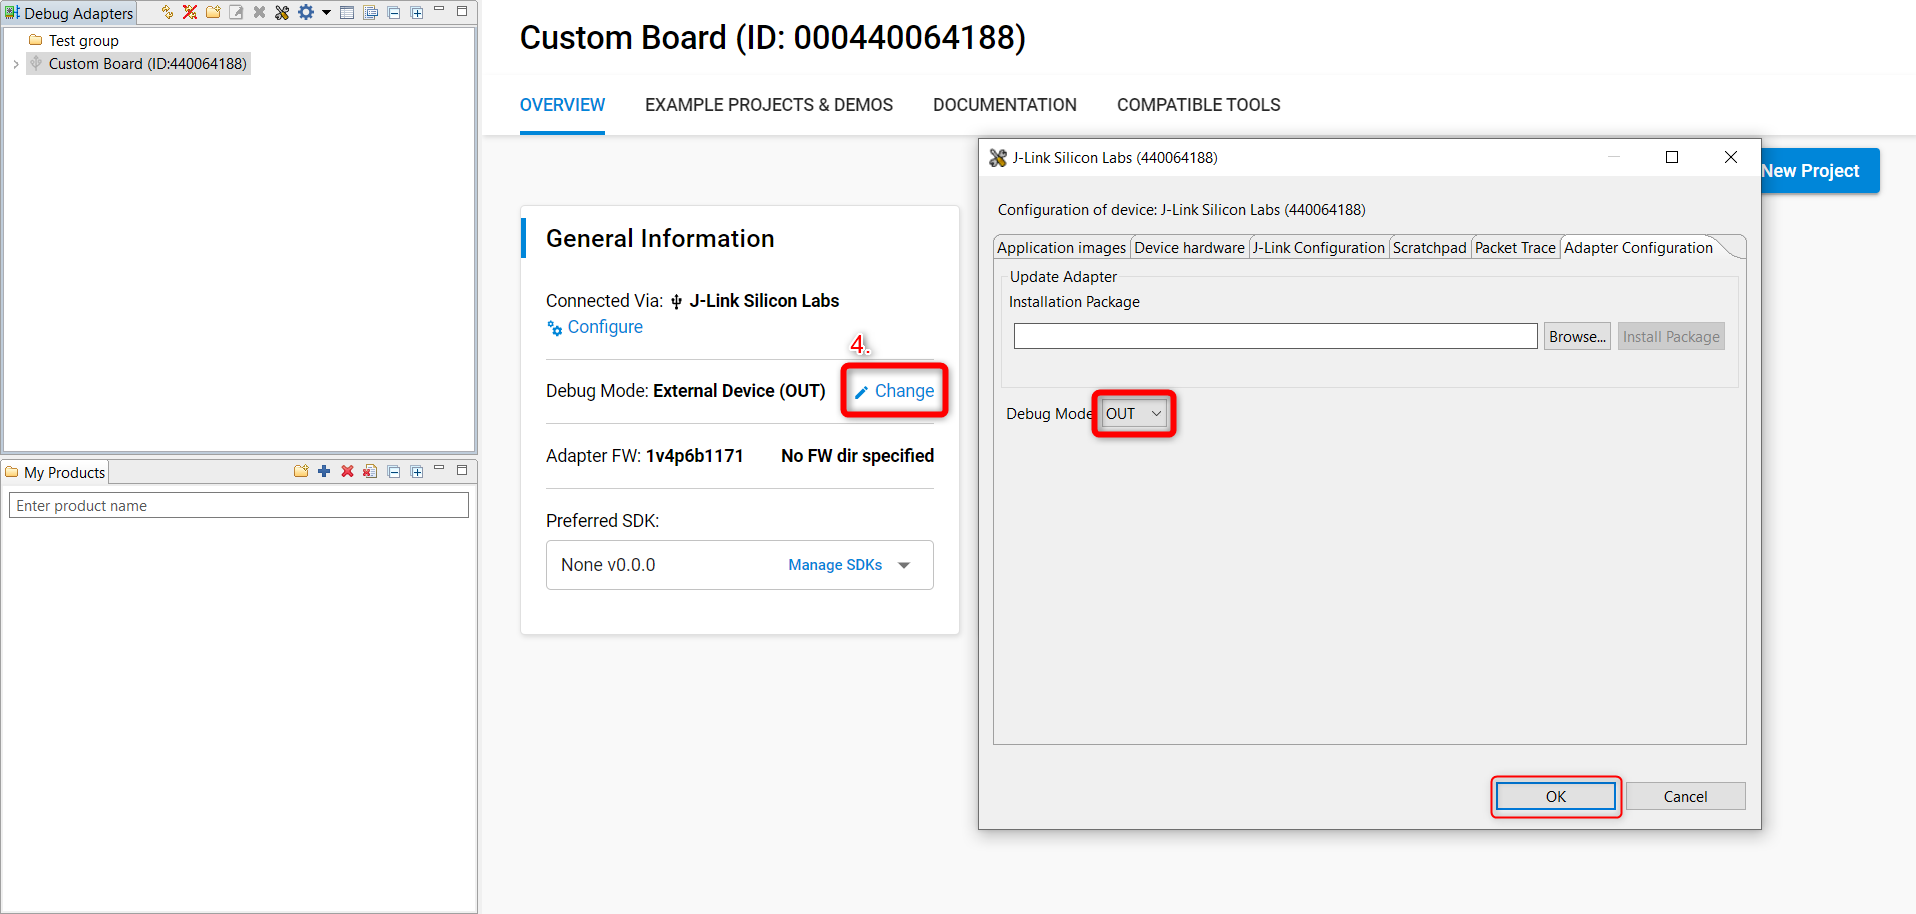

Right click on the WSTK Mainboard in the Debug Adapters pane and select Device Configuration....
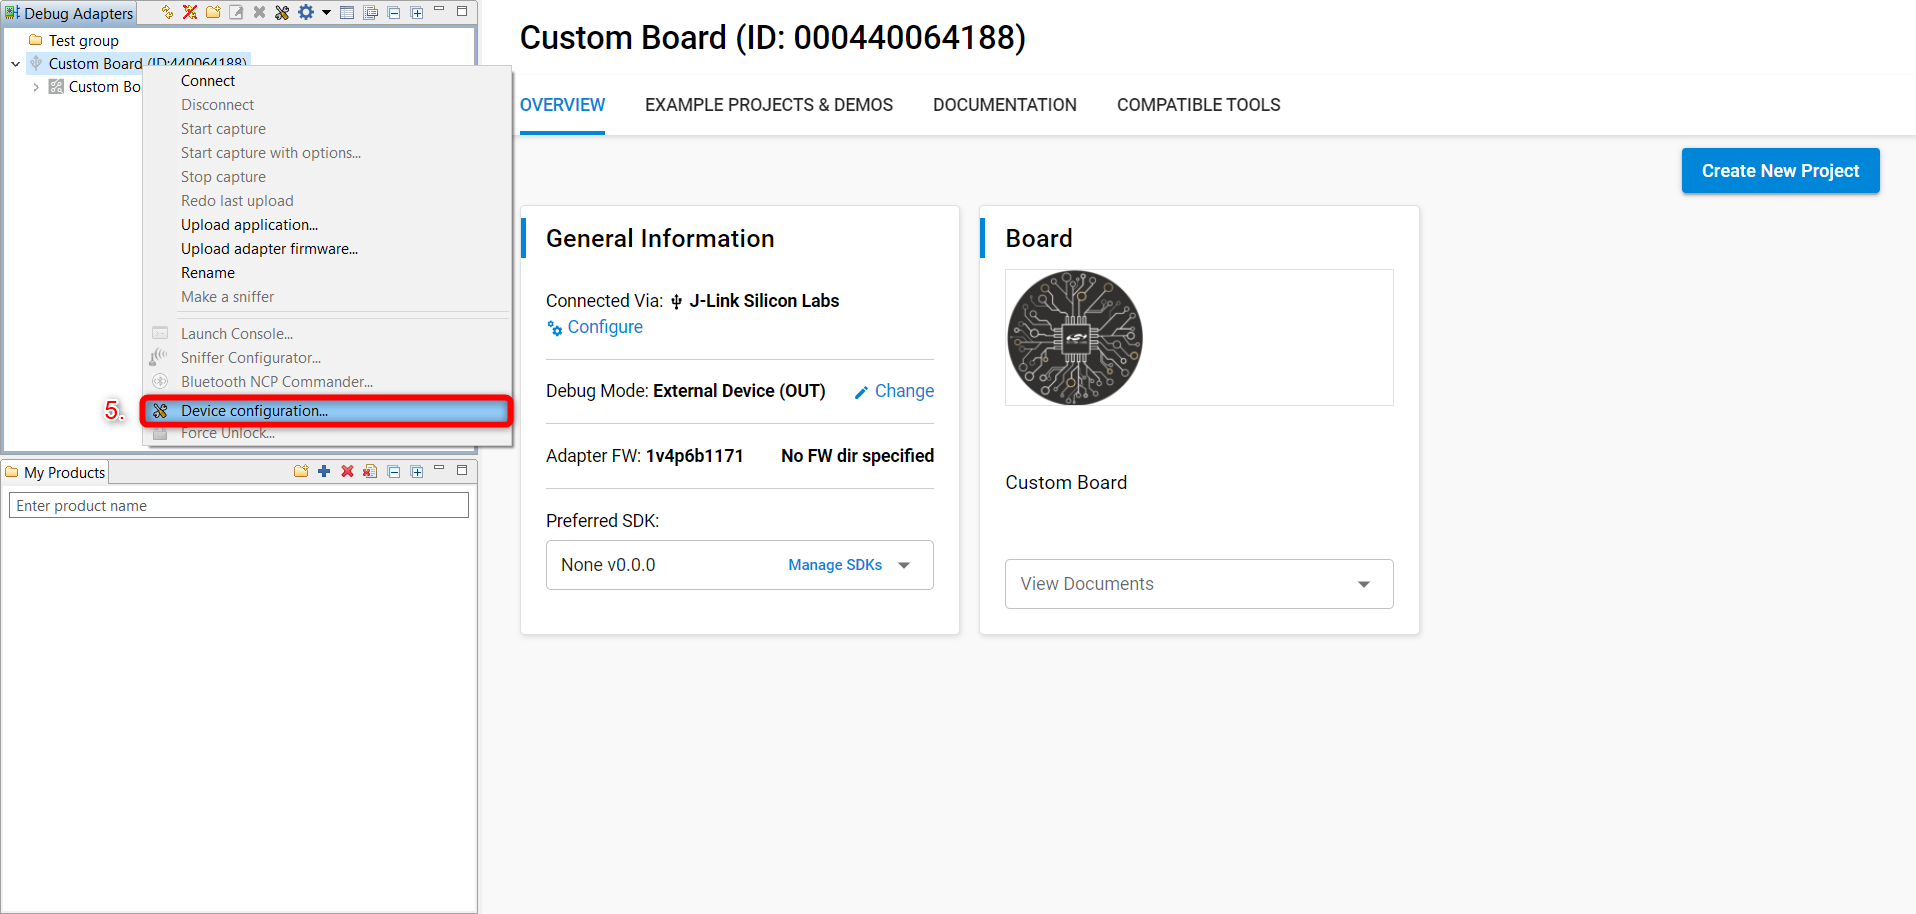

Go to the Device hardware tab and type BRD4184A on the Boards field. If you have a custom board, select the device in the Target part section.
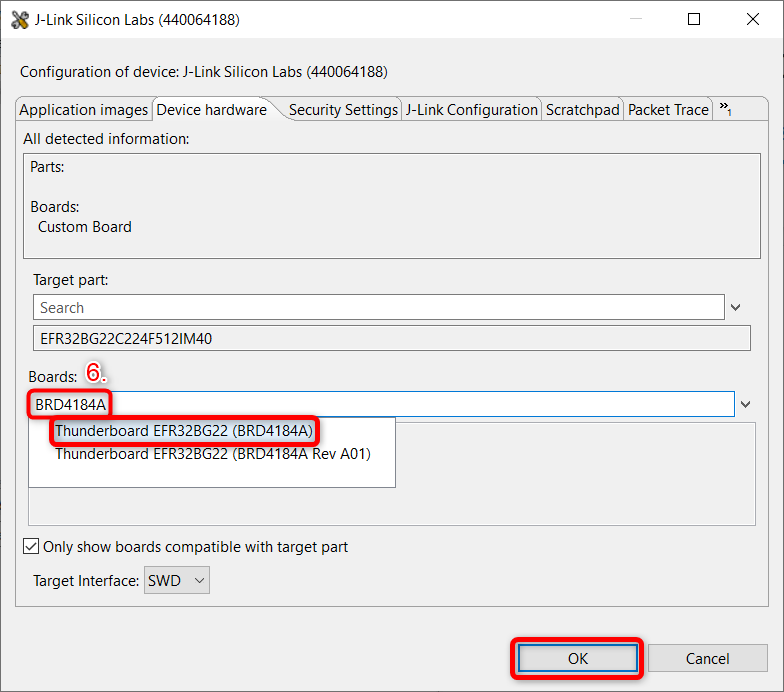

Likewise, you can connect to the adapter and start a capture session.
