Energy Profiler User Interface#
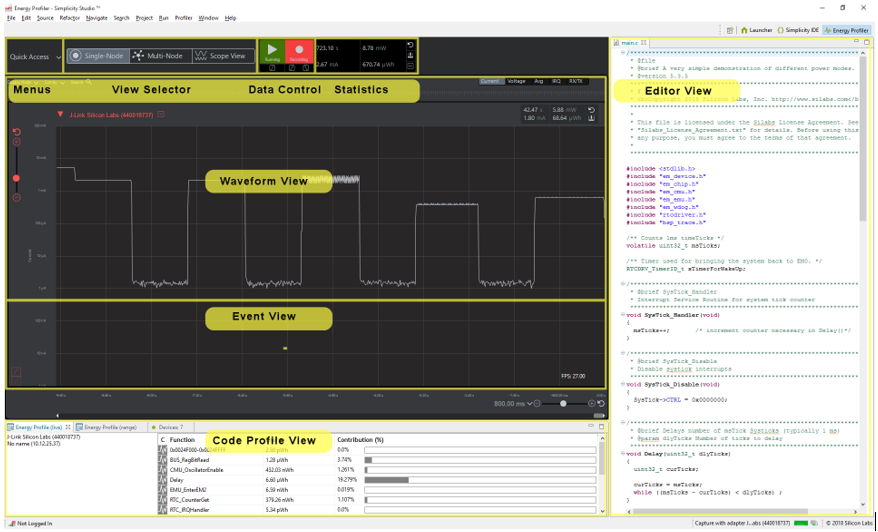
The Energy Profiler perspective is divided into six primary sections. The following figure shows Single-Node view.
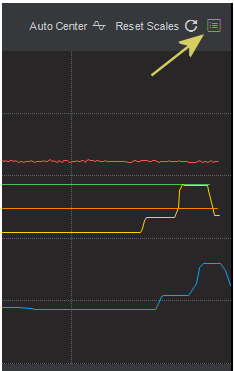
Quick Access Menus - The most frequently used menus for Multi-Node Energy Profiler are available on the user interface itself and also from the Profiler menu at the top menu bar.
View Selector - Three views for Multi-Node Energy Profiler can be selected by clicking the View Selector bar.
Data Control - Controls in this area are used to enable and disable data flow to the user interface and to disk.
Statistics - Energy data for the waveform is shown in the statistics area.
Code Correlation - Function execution related to power consumption is shown in the Code Correlation view.
Editor - Source code for the program is shown here and works in conjunction with the Code Correlation view.
Three views are available for evaluating power performance:
Single-Node View#
Single-Node view is used to display a single device’s waveform and events. It displays a high-detail waveform and ensures that all events rows are visible, without the need to scroll the UI. The Energy Profiler perspective combines this Single-Node view, the Code Correlation view, and the source code Editor view, allowing you to perform in-depth analysis of a single device from many viewpoints. Any active device may be selected through the Display Nodes menu.
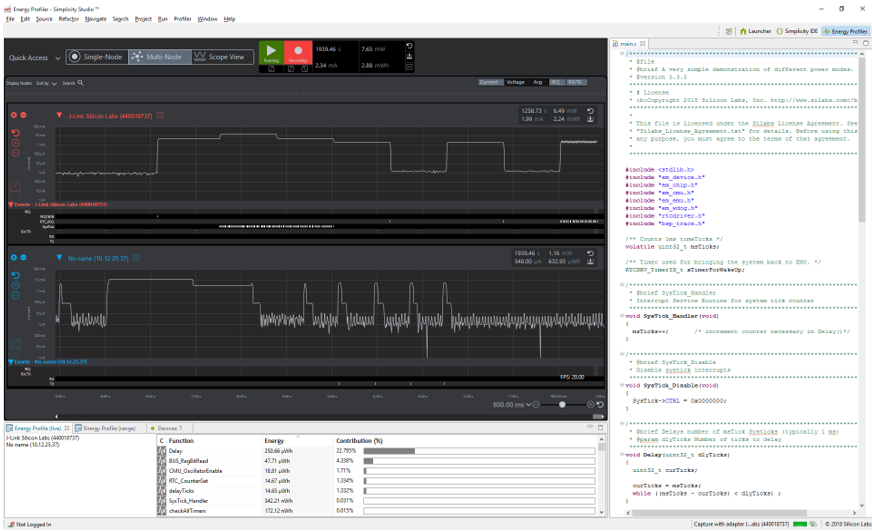
Multi-Node View#
Multi-Node view is used to display multiple device waveform and events. It allows you to investigate system behavior and interactions between devices. Two devices are visible in the main portion of the UI, while others are viewed by scrolling. The Multi-Node view groups each individual device’s waveform and events together. The Energy Profiler perspective combines this Multi-Node view, the Code Correlation view, and the source code Editor view, allowing you to perform in-depth analysis of multiple devices from many viewpoints.
Multi-Node view offers the following capabilities:
Sorting
Node display control
Sorting
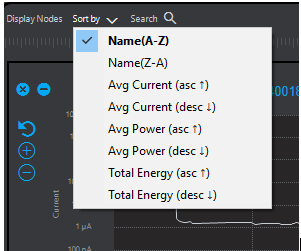
Sorting in Multi-Node view allows you to order waveforms based upon several criteria. For example, it may be useful to sort descending by average power, such that the highest power consumers are easily identified at the top. As shown in the following figure, devices may be sorted ascending and descending by name, average current, average power, or total energy.
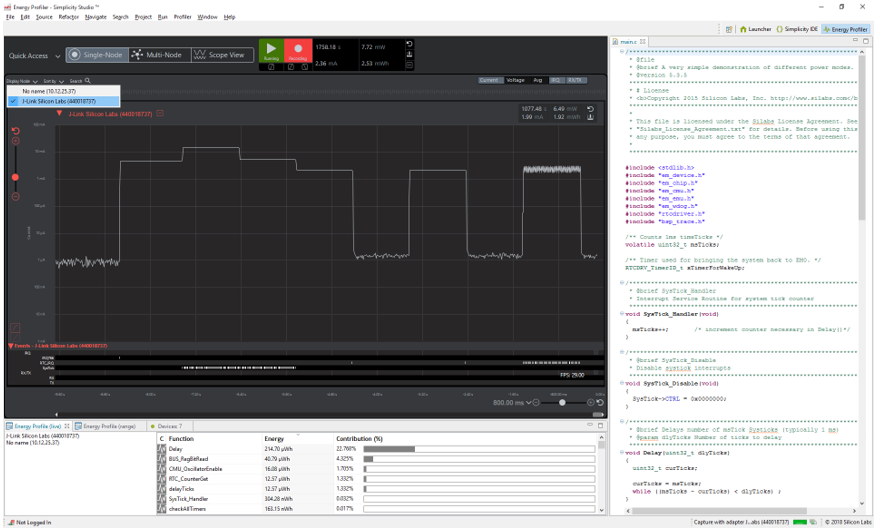
Displaying Nodes
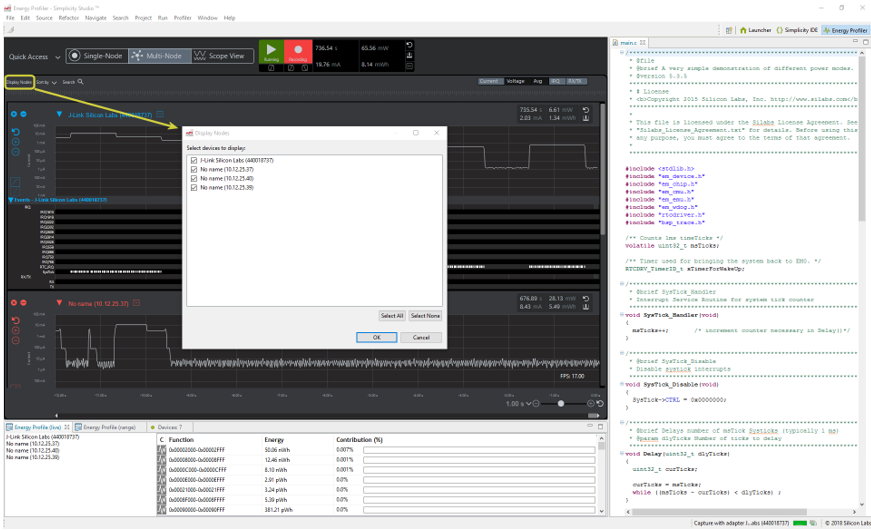
Enabling capture on any device automatically adds it to the Multi-Node view. However, as the number of devices displayed increases, UI performance may be impacted. Click Display Nodes to select the devices that will be displayed. This selection only affects the waveform display. If recording is enabled, data for all actively capturing devices is streamed to disk regardless of whether or not they are displayed.
Scope View#
Scope view is used to display multiple device waveforms and events, allowing you to investigate system behavior and interactions between devices. In Scope view, all waveforms are displayed in one waveform area, so that you can see all waveforms without needing to scroll the UI. It also enables the user overlay and align traces like an oscilloscope. All event traces are grouped below the waveform view. The Energy Profiler perspective combines this Scope view, the Code Correlation view, and the source code Editor view allowing you to perform in-depth analysis of a single device from many viewpoints.
Scope view offers the following capabilities:
Sorting
Node display control
Waveform display control
Sorting
Sorting in Scope view allows you to order events based upon several criteria. For example, it may be useful to sort events descending by average power, such that the events for the highest power consumers are easily identified at the top.
Displaying Nodes
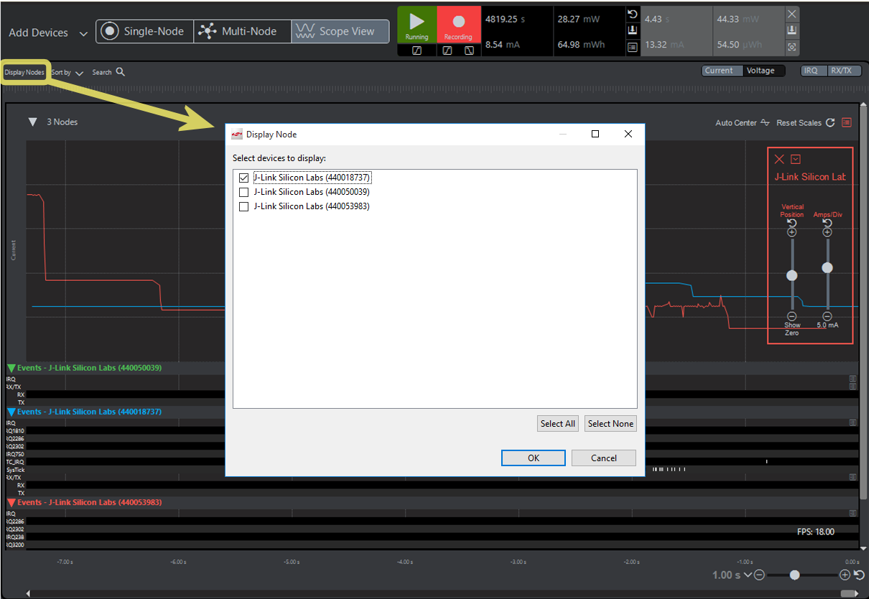
Enabling capture on any device automatically adds it to scope view. However, as the number of devices displayed increases, UI performance may be impacted. Click Display Nodes to select which devices will be displayed. This selection only enables or disables display of waveform and event data in the UI. If recording is enabled, data for all actively capturing devices is streamed to disk regardless of whether they are displayed.
Displaying Waveforms
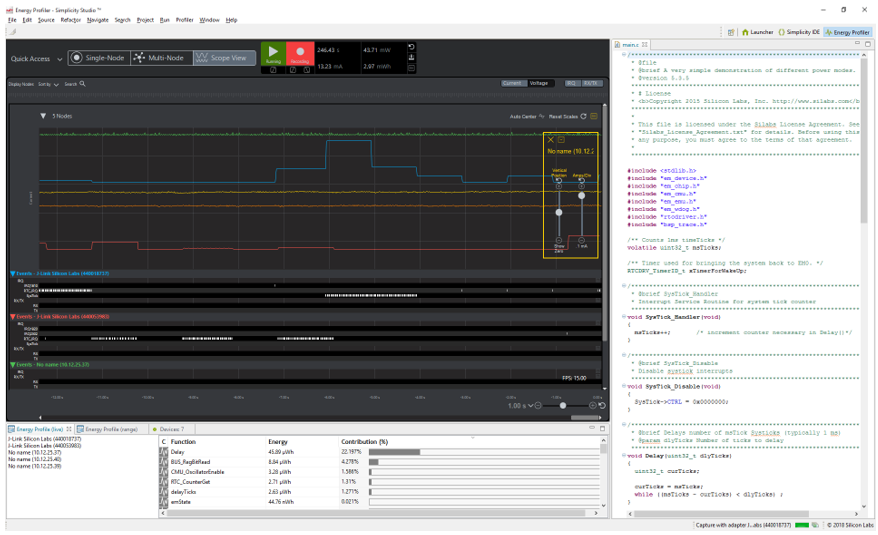
One of the Scope view’s key benefits is the ability to view waveforms in a single view at difference scales, enabling you to compare waveform characteristics that would not be possible for two waveforms on the same scale. The waveform scale/offset controls are available by default at the upper right corner of the Scope waveform view. The color of the waveform scale/offset control indicates which waveform will be adjusted when the sliders are moved.
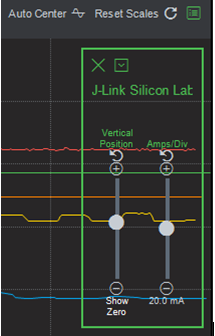
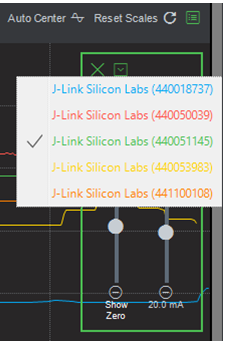
The drop-down menu at the top of the control allows you to select the device to be adjusted by the waveform scale and offset control. The debug adapter name colors match the colors in the waveform portion of Scope view.
Toggle wave scale/offset control display using the show/hide button above it.
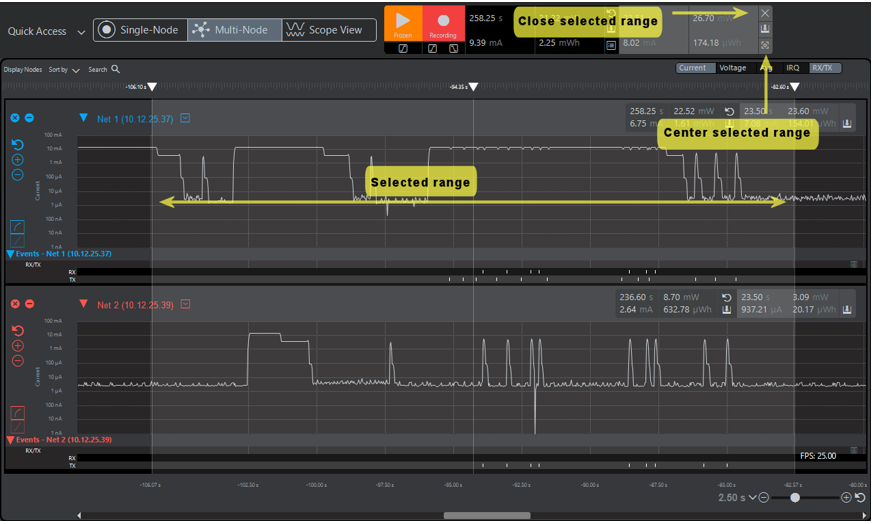
Selecting Ranges
Energy Profiler provides the ability to select a range of data by clicking and dragging across the waveforms or events. This is useful for determining power statistics for regions of interest. Once a range is selected, a light gray section summarizing the energy statistics for the selected region is displayed. That section also allows you to re-center the selection in the waveform view if it has scrolled out of view and includes a button to close/deselect the region.