Starting an Energy Analysis Session#
An energy analysis session can be started from either the Simplicity IDE Perspective or from the Energy Profiler.
From the Simplicity IDE Perspective#
Some Silicon Labs SDKs contain examples that are pre-configured to deliver energy profiling data to the Energy Profiler. In the Simplicity Studio Launcher perspective, you can find example titles such as "Powertest" or "Energy modes" or "Emode" for many development kits. In the figure below, the selected device is an EFR32 development kit. The Flex SDK has been installed.
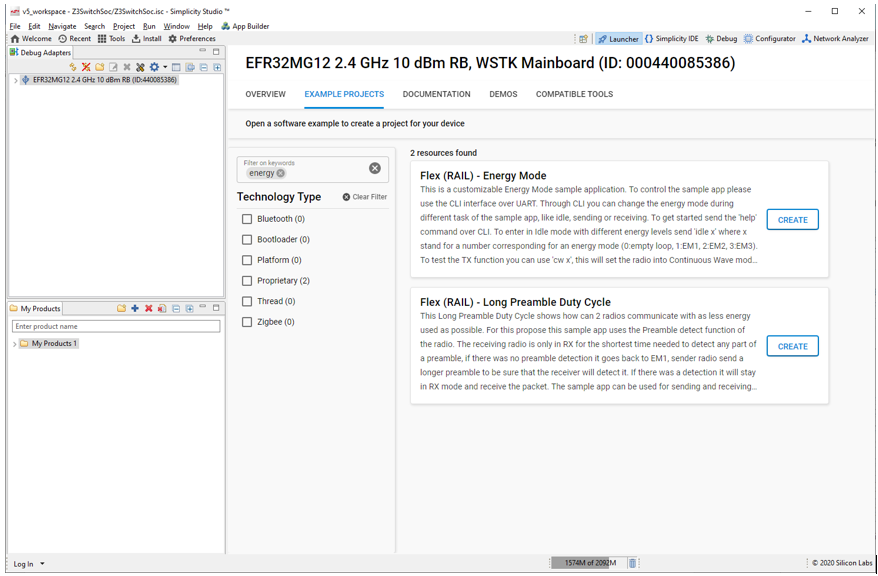
Create an example (in this case Flex(RAIL) - Energy Mode). Because this is a RAIL example, the Simplicity IDE perspective opens with the Radio Configurator open. If this is an AppBuilder project, click Generate.
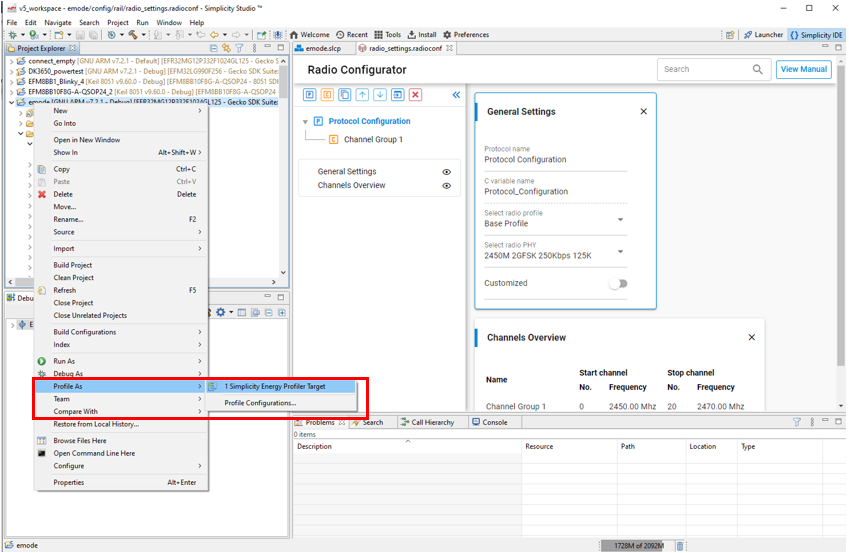
Right-click the project directory. In the context menu select Profile As > Simplicity Energy Profiler Target.
SSv5 then:
Rebuilds the entire project.
Flashes the application to compatible hardware.
Starts energy capture for that device.
Switches to the Energy Profiler perspective.
Displays the device data on Single-Node View, Multi-Node View, and Scope View.
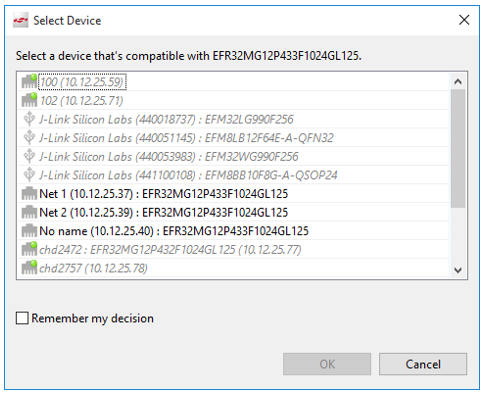
In step 2 above, if more than one connected device is compatible with the application being profiled, SSv5 prompts you to select a device. Select the target of interest and click OK.
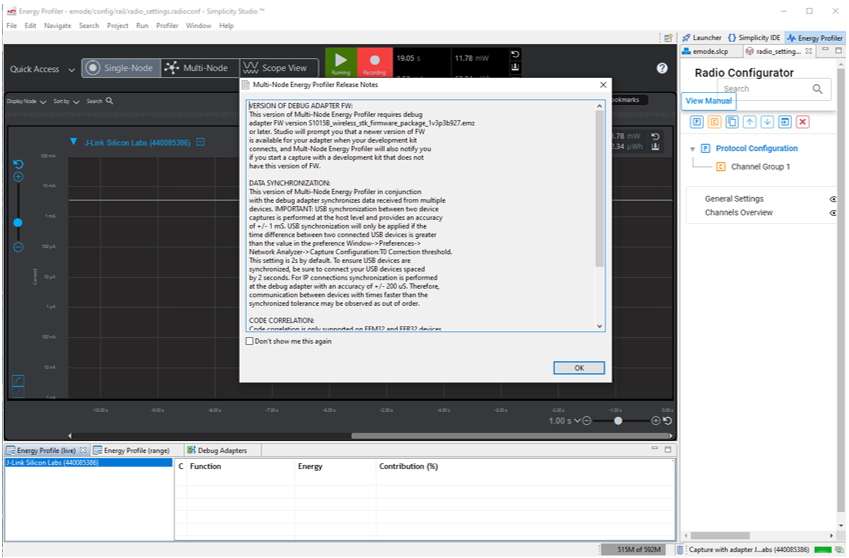
After the application is built and the firmware flashed, the Energy Profiler perspective is displayed, with a release notes dialog. Click OK.
From the Energy Profiler#
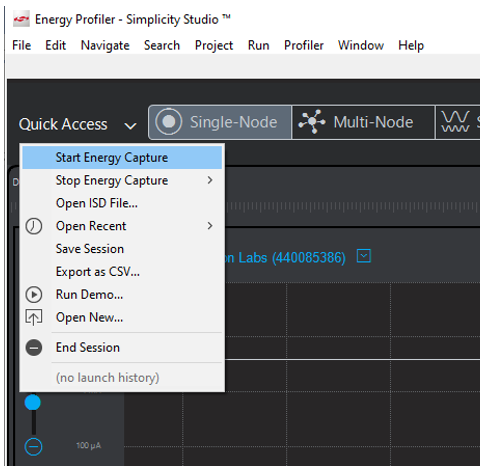
If application firmware is already running on a device, you can connect to it from the Energy Profiler tool. Open the Energy Profiler perspective. Click Quick Access to display its menu and select Start Energy Capture.
If more than one connected device is compatible with the application being profiled, SSv5 prompts you to select a device. Select the target of interest and click OK.
Energy Profiler then:
Starts energy capture for that device.
Depending upon which view is currently active, displays the device’s energy data on Single-Node view, Multi-Node view, or Scope view.
Customer Hardware and Software Design Information#
This section discusses design requirements in order for a device to be able to use Energy Profiler features. Among these features is Code Correlation, which connects power consumption and executed code. Using code correlation is discussed in more detail in Profiling with Code Correlation
Hardware Design#
EFM8 Hardware Interface
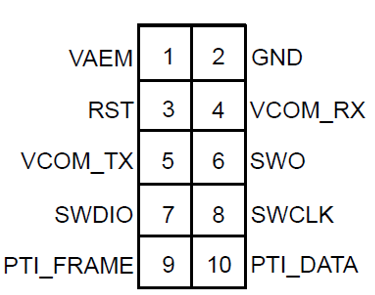
To use the Energy Profiler functionality on a board design, the board needs to include a debug interface that can be connected to a Silicon Labs starter kit (STK) or wireless starter kit (WSTK). For the basic Energy Profiler current measurements, the board must be powered from the VAEM supply of a Silicon Labs STK or WSTK. Both the current measurement and EFM8 C2 Debug interface can be obtained by using the Silicon Labs Mini Simplicity 10 pin connector. This connector is detailed in AN958: Debugging and Programming Interfaces for Custom Designs. The EFM8 C2 interface signals are on SWDIO (Pin 7 C2D) and SWCLK (Pin 8 C2CK) pins shown in the following figure.
Code correlation is not possible with the EFM8 parts as they do not include the SWO pin that is used to transmit the program counter information. As mentioned in AN958: Debugging and Programming Interfaces for Custom Designs, using the Silicon Labs debug adapter board (BRD8010A) is the easiest way to get the Mini Simplicity pinout from a Silicon Labs STK or WSTK development kit.
EFM32 and EFR32 Hardware Interface
To use the Energy Profiler functionality on a board design, the board needs to include a debug interface that can be connected to a Silicon Labs STK or WSTK. For the basic Energy Profiler current measurements, the board must be powered from the VAEM supply of a Silicon Labs STK or WSTK. To also include code correlation, the debug interface must include the SWD interface. Both the current measurement and the code correlation (SWD) can be obtained by using the Silicon Labs Mini Simplicity 10 pin connector. This connector is detailed in AN958: Debugging and Programming Interfaces for Custom Designs. The Mini Simplicity 10 pin connector can be used with all EFM32 and EFR32 parts. The pinout is shown in the following figure.
As mentioned in AN958: Debugging and Programming Interfaces for Custom Designs, using the Silicon Labs debug adapter board (BRD8010A) is the easiest way to get the Mini Simplicity pinout from a Silicon Labs STK or WSTK development kit. The debug adapter board is not compatible with the older EFM32 Development Kits (DKs) and some of the older EFM32 starter kits (STK) that have a different debug connector on them (Gecko, Giant Gecko (EFM32GG-STK3700), Leopard Gecko, Tiny Gecko, Wonder Gecko, Zero Gecko).
Software Design#
To use the current monitoring functionality provided by the AEM interface, no software changes or setup are required. To use the code correlation functionality, the SWD interface must be configured to output periodic program counter information. Currently, code correlation is not possible with the EFM8 family. The Multi-Node Energy Profiler can still be used to monitor the overall energy use of the parts over time / usage scenarios.
Software can be configured in two ways:
Project configurator method (using software components; preferred for SSv5 projects)
Legacy method (by manually adding the necessary source code)
Project Configurator Method#
This method of enabling code correlation is preferred in SSv5, as it leverages the software components and thereby reduces the chance of error.
In the Project Configurator, SOFTWARE COMPONENTS tab, find and install the SWO Debug component.
Click Configure to open the Component editor.
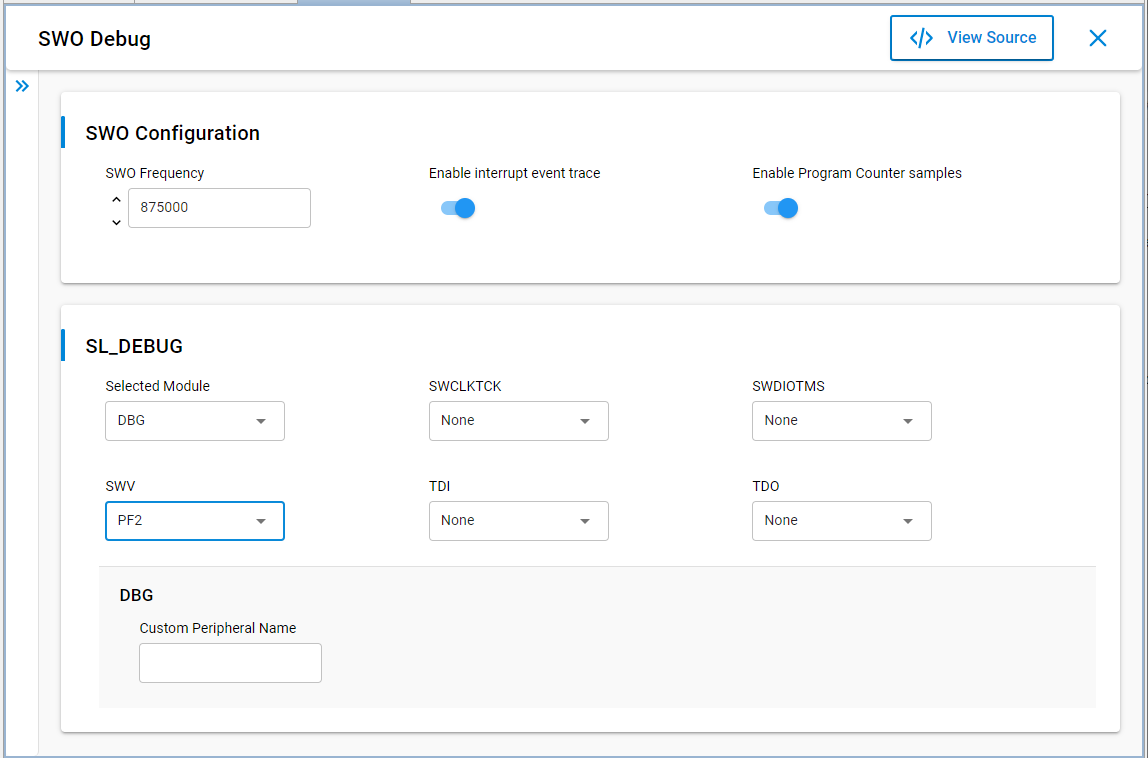
Open its configuration file and turn on Enable interrupt event trace and Enable program counter samples.
If the device allows SWO functionality on multiple GPIO pins, in the SL_Debug card's SWV field, select the pin to be used as the SWO output.
Further initialization of the software component in code is not required provided that the System Init component is installed in the project.
Legacy Method#
This method should be used for Appbuilder project and projects not created in the Project Configurator.
The following paths must be included in your project, as they provide access to relevant header files used to enable code correlation. These header files are readily available for Silicon Labs parts. For custom design boards use bsp_trace.h and traceconfig.h as a reference instead.
<SSv5 install>/developer/sdks/gecko_sdk_suite/<version>/hardware/kit/common/bsp
Grants access to bsp_trace.h
(not required for AppBuilder projects) <SSv5 install>/developer/sdks/gecko_sdk_suite/<version>/hardware/kit/kitname/config
Grants access to traceconfig.h
For AppBuilder projects, instead see the next step.
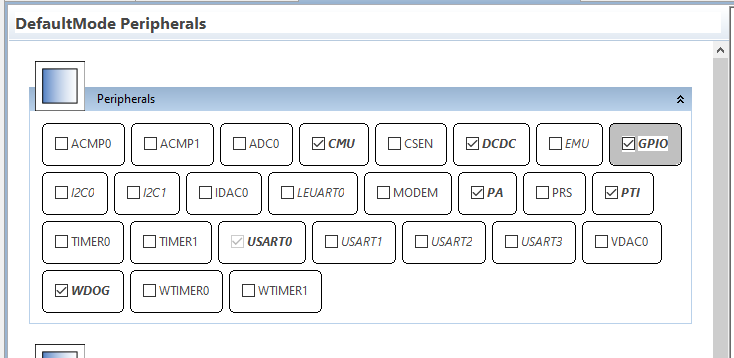
(Only for Appbuilder projects) In the Hardware Configurator file (.hwconf) in the "DefaultMode" peripheral tab, enable the GPIO module. This adds the BSP_TRACE_SWO_ macros to the hal-config.h file.
Add bsp_trace.c to the project (from <SSv5install>/developer/sdks/gecko_sdk_suite/<version>/hardware/kit/common/bsp)
The code must enable SWO output from the MCU. To enable this output, add
#include bsp_trace.hto the appropriate module and callBSP_TraceSwoSetup()during initialization as indicated in the following sections, based on the SDK being used.
Stackless project MCU SDK: Place BSP_TraceSwoSetup() after the EMU_DCDCInit() call in main().
#include "bsp_trace.h"
.
.
.
/* Initialize DCDC. Always start in low-noise mode. */
dcdcInit.dcdcMode = emuDcdcMode_LowNoise;
EMU_DCDCInit(&dcdcInit);
// Setup SWD for code correlation
BSP_TraceSwoSetup();Bluetooth LE SDK: Place BSP_TraceProfilerSetup() in main.c after the initApp() call.
#include "bsp_trace.h"
.
.
.
// Initialize application
initApp();
// Setup SWD for code correlation
BSP_TraceProfilerSetup();
// Initialize LEDs
BSP_LedsInit();Flex SDK: Place BSP_TraceProfilerSetup() in main.c after the BSP_Init() call.
#include "hal_common.h"
#include "bsp_trace.h"
.
.
.
// Initialize the BSP
BSP_Init(BSP_INIT_BCC);
// Setup SWD for code correlation
BSP_TraceProfilerSetup();EmberZNet SDK: Place BSP_TraceProfilerSetup() in af-main-soc.c after the emberInit() call.
#include "afv2-bookkeeping.h"
#if defined(CORTEXM3_EFR32_MICRO) || defined (CORTEXM3_EMBER_MICRO)
#define EXTENDED_RESET_INFO
#include "hal/micro/cortexm3/ diagnostic.h"
#endif
#include "bsp_trace.h"
.
.
.
int emberAfMain (MAIN_FUNCTION_PARAMETERS)
{
EmberStatus status;
int returnCode;
if (emberAfMainStartCallback(& returnCode, APP_FRAMEWORK_MAIN_ARGUMENTS)) {
return returnCode;
}
}
// Initialize the Ember Stack.
status = emberInit();
if (status != EMBER_SUCCESS) {
emberAfCorePrintln("%pemberInit 0x%x", "ERROR: ", status);
// The app can choose what to do here. If the app is running
// another device then it could stay running and report the
// error visually for example. This app asserts.
assert(false);
} else {
emberAfDebugPrintln("init pass");
}
// Setup SWD for code correlation
BSP_TraceProfilerSetup();The program must be built with debug information enabled so that source code lookup is possible. If you create your project in Simplicity Studio, this is enabled by default. If you import a project into Simplicity Studio, check compiler options in project context menu Properties...-> C/C++ Build -> Settings. If you build the program outside of Simplicity Studio, check compiler options of the build tools.
EFM32 Software Configuration
Add bsp_trace.c to the project. (from <SSv5 install>\developer\sdks\gecko_sdk_suite<version>\hardware\kit\common\bsp)
The macros BSP_TRACE_SWO_PIN, BSP_TRACE_SWO_PORT and BSP_TRACE_SWO_LOC must be defined. For EFM32 parts this is done by default for Silicon Labs development kits in <SSv5 install>\developer\sdks\gecko_sdk_suite\<version>\hardware\kit\<board>/hal-config-board.h. For a custom board design the Silicon Labs hal-config-board.h can be used as an example for defining the values. The following is an example for the Pearl Gecko Starter Kit (SLSTK3401A):
// $[GPIO] #define PORTIO_GPIO_SWV_PIN (2) #define PORTIO_GPIO_SWV_PORT (gpioPortF) #define PORTIO_GPIO_SWV_LOC (0) #define BSP_TRACE_SWO_PIN (2) #define BSP_TRACE_SWO_PORT (gpioPortF) #define BSP_TRACE_SWO_LOC (0) // [GPIO]$The code must enable SWO output from the MCU. To enable this output, add
#include bsp_trace.hto main.c and callBSP_TraceProfilerSetup()during initialization after theEMU_DCDCInit()call inmain().#include #include "bsp_trace.h" . . . /* Initialize DCDC. Always start in low-noise mode. */ dcdcInit.dcdcMode = emuDcdcMode_LowNoise; EMU_DCDCInit(&dcdcInit); // Setup SWD for code correlation BSP_TraceProfilerSetup();The program must be built with debug information enabled so that source code lookup is possible. If you create your project in SSv5, this is enabled by default. If you import a project into SSv5, check compiler options in project context menu Properties... > C/C++ Build > Settings. If you build your program outside of SSv5, check compiler options of the build tools.